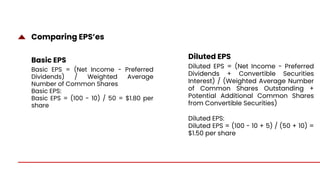
Asian Paints:
Financial Statement
Analysis
Presented to:
Prof. Archana Patra
M A N A C I
Akshay Pandey MBA/2006/09
Anubhab Bandyopadhyay MBA/2016/09
Himanshu Dubey MBA/2038/09
Manas Pratim Das MBA/2051/09
Rahul Raj MBA/2069/09
Vidhyut Pathak MBA/2096/09
By-
About the company:
Asian Paints is a leading multinational
paint company headquartered in
Mumbai, India. It is engaged in the
business of manufacturing, selling,
and distributing paints, coatings,
products related to home decor, bath
fittings, and providing various other
related services. The company has its
manufacturing locations in 15
countries with 26 manufacturing
facilities serving customers globally
around 60 countries.
Cash and bank balances Depreciation
Asian Paints has a significant
amount of cash and bank
balances and investments. As of
March 31, 2023, the company had
cash and cash equivalents of Rs.
346.39 crore, other balances with
banks of Rs. 264.36 crore, and
investments of Rs. 5,854.50 crore.
This gives Asian Paints a strong
financial position and provides it
with the flexibility to invest in new
opportunities and to weather any
economic downturns.
Asian Paints uses the straight-
line method of depreciation
for its property, plant, and
equipment. This is a common
method of depreciation that is
widely used in the industry.
The straight-line method
depreciates assets over their
useful life at a constant rate.
Comparing EPS’es
Basic EPS = (Net Income - Preferred
Dividends) / Weighted Average
Number of Common Shares
Diluted EPS = (Net Income - Preferred
Dividends + Convertible Securities
Interest) / (Weighted Average Number
of Common Shares Outstanding +
Potential Additional Common Shares
from Convertible Securities)
Basic EPS:
Basic EPS = (100 - 10) / 50 = $1.80 per
share
Diluted EPS:
Diluted EPS = (100 - 10 + 5) / (50 + 10) =
$1.50 per share
Basic EPS Diluted EPS
Company provided
information
Annual
reports and
financial
statements:
Investor
presentations
Analyst calls
Quarterly Earnings Calls
Corporate Governance
Transparency and Accountability
Risk Management
Ethical Standards
Shareholder Rights dividend policies,
and the protection of minority
shareholders.
Cash Flow Statement
Depreciation is not
a source of cash,
but it is added to
net profit. Why
No, the amount of dividend income doesn’t equal
to amount of dividend received. Dividend income
is the total income earned by the organization
from their investments in dividend-paying stocks.
It represents the sum of all dividends earned from
various investments over a year. Dividend income
for the year 2022-23 is 70.48 crore.
Depreciation is not a source of cash, but it is
added to net profit because it is a non-cash
expense. This means that it is a cost that is
incurred by the business, but it does not require
an outflow of cash. Depreciation is a method of
allocating the cost of a tangible asset over its
useful life. Depreciation is an important concept
for businesses to understand. It allows them to
accurately reflect the cost of their assets on
their income statement and to calculate their
cash flow from operating activities.
Does the amount of
dividend income
equal dividend
received? Why or
why not?
Does the amount of interest
expense equal interest paid?
Why or why not?
No, the amount of interest expense
doesn’t equal to the amount of
interest paid. They are related but
differ due to accounting principles.
Interest Expense is the total cost of
borrowing money over a specific
period, as recorded in the
organization’s income statement. It
represents the accrued interest cost
based on the interest rate and the
outstanding balance of debt
Change in working capital items
Change in working capital = (Summation of changes in current
assets) – (Summation of changes in current liabilities)
Change in working capital = (44.18+433.03+546.84-
119.60+173.91+61.08-11.63)–(23.58+39.65-
491.08+526.73+64.83+8.27+12.04)
Change in working capital = Rs. 943.79 cr
Therefore, the working capital has increased over the period & the
changed amount is Rs. 943.79 cr.
Free cash flow
Free cash flow = Operating cash flow – Capex expenses.
Here, operating cash flow = 4221.65 crores.
Capex expenses = 1057.27-16.28 = 1040.99 crores
Free cash flow = 4221.65 – 1040.99 = 3180.66 crores.
Thus we can conclude that company has huge stock of free cash
flow which will help it in case of any adverse situations in future.
Changes in balance sheet
Statement explaining changes in balance sheet items using the information in the
statement of profit and loss and cash flow statement
Assets
Cash and cash equivalents:
Increase: Net income from profit and loss statement
Increase: Cash flow from operating activities on cash flow statement
Decrease: Cash flow from investing activities on cash flow statement
Decrease: Cash flow from financing activities on cash flow statement
Accounts receivable:
Increase: Revenue from profit and loss statement
Decrease: Cash collected from customers on cash flow statement
Inventory:
Increase: Purchases from profit and loss statement
Decrease: Cost of goods sold from profit and loss statement
Decrease: Sales to customers on cash flow statement
Property, plant, and equipment:
Increase: Capital expenditures from cash flow statement
Decrease: Depreciation from profit and loss statement
Other assets:
Increase: Other income from profit and loss statement
Decrease: Other expenses from profit and loss statement
Liabilities
contd.
Accounts payable:
Increase: Cost of goods sold from profit and loss statement
Decrease: Cash paid to suppliers on cash flow statement
Accrued expenses:
Increase: Expenses from profit and loss statement
Decrease: Cash paid for expenses on cash flow statement
Other liabilities:
Increase: Other expenses from profit and loss statement
Decrease: Cash paid for other liabilities on cash flow statement
Shareholders' equity
Common stock:
Increase: Issuance of common stock on cash flow statement
Decrease: Repurchase of common stock on cash flow statement
Retained earnings:
Increase: Net income from profit and loss statement
Decrease: Dividends paid to shareholders on cash flow statement
The above statement can be used to explain the changes in all balance sheet items using the information in the sta
and loss and cash flow statement.
Thank
You

Asian Paints Grp-7_presentation.pdf

  • 1.
    Asian Paints: Financial Statement Analysis Presentedto: Prof. Archana Patra M A N A C I
  • 2.
    Akshay Pandey MBA/2006/09 AnubhabBandyopadhyay MBA/2016/09 Himanshu Dubey MBA/2038/09 Manas Pratim Das MBA/2051/09 Rahul Raj MBA/2069/09 Vidhyut Pathak MBA/2096/09 By-
  • 3.
    About the company: AsianPaints is a leading multinational paint company headquartered in Mumbai, India. It is engaged in the business of manufacturing, selling, and distributing paints, coatings, products related to home decor, bath fittings, and providing various other related services. The company has its manufacturing locations in 15 countries with 26 manufacturing facilities serving customers globally around 60 countries.
  • 4.
    Cash and bankbalances Depreciation Asian Paints has a significant amount of cash and bank balances and investments. As of March 31, 2023, the company had cash and cash equivalents of Rs. 346.39 crore, other balances with banks of Rs. 264.36 crore, and investments of Rs. 5,854.50 crore. This gives Asian Paints a strong financial position and provides it with the flexibility to invest in new opportunities and to weather any economic downturns. Asian Paints uses the straight- line method of depreciation for its property, plant, and equipment. This is a common method of depreciation that is widely used in the industry. The straight-line method depreciates assets over their useful life at a constant rate.
  • 5.
    Comparing EPS’es Basic EPS= (Net Income - Preferred Dividends) / Weighted Average Number of Common Shares Diluted EPS = (Net Income - Preferred Dividends + Convertible Securities Interest) / (Weighted Average Number of Common Shares Outstanding + Potential Additional Common Shares from Convertible Securities) Basic EPS: Basic EPS = (100 - 10) / 50 = $1.80 per share Diluted EPS: Diluted EPS = (100 - 10 + 5) / (50 + 10) = $1.50 per share Basic EPS Diluted EPS
  • 6.
    Company provided information Annual reports and financial statements: Investor presentations Analystcalls Quarterly Earnings Calls Corporate Governance Transparency and Accountability Risk Management Ethical Standards Shareholder Rights dividend policies, and the protection of minority shareholders.
  • 7.
  • 8.
    Depreciation is not asource of cash, but it is added to net profit. Why No, the amount of dividend income doesn’t equal to amount of dividend received. Dividend income is the total income earned by the organization from their investments in dividend-paying stocks. It represents the sum of all dividends earned from various investments over a year. Dividend income for the year 2022-23 is 70.48 crore. Depreciation is not a source of cash, but it is added to net profit because it is a non-cash expense. This means that it is a cost that is incurred by the business, but it does not require an outflow of cash. Depreciation is a method of allocating the cost of a tangible asset over its useful life. Depreciation is an important concept for businesses to understand. It allows them to accurately reflect the cost of their assets on their income statement and to calculate their cash flow from operating activities. Does the amount of dividend income equal dividend received? Why or why not?
  • 9.
    Does the amountof interest expense equal interest paid? Why or why not? No, the amount of interest expense doesn’t equal to the amount of interest paid. They are related but differ due to accounting principles. Interest Expense is the total cost of borrowing money over a specific period, as recorded in the organization’s income statement. It represents the accrued interest cost based on the interest rate and the outstanding balance of debt
  • 10.
    Change in workingcapital items Change in working capital = (Summation of changes in current assets) – (Summation of changes in current liabilities) Change in working capital = (44.18+433.03+546.84- 119.60+173.91+61.08-11.63)–(23.58+39.65- 491.08+526.73+64.83+8.27+12.04) Change in working capital = Rs. 943.79 cr Therefore, the working capital has increased over the period & the changed amount is Rs. 943.79 cr.
  • 11.
    Free cash flow Freecash flow = Operating cash flow – Capex expenses. Here, operating cash flow = 4221.65 crores. Capex expenses = 1057.27-16.28 = 1040.99 crores Free cash flow = 4221.65 – 1040.99 = 3180.66 crores. Thus we can conclude that company has huge stock of free cash flow which will help it in case of any adverse situations in future.
  • 12.
    Changes in balancesheet Statement explaining changes in balance sheet items using the information in the statement of profit and loss and cash flow statement Assets Cash and cash equivalents: Increase: Net income from profit and loss statement Increase: Cash flow from operating activities on cash flow statement Decrease: Cash flow from investing activities on cash flow statement Decrease: Cash flow from financing activities on cash flow statement Accounts receivable: Increase: Revenue from profit and loss statement Decrease: Cash collected from customers on cash flow statement Inventory: Increase: Purchases from profit and loss statement Decrease: Cost of goods sold from profit and loss statement Decrease: Sales to customers on cash flow statement Property, plant, and equipment: Increase: Capital expenditures from cash flow statement Decrease: Depreciation from profit and loss statement Other assets: Increase: Other income from profit and loss statement Decrease: Other expenses from profit and loss statement Liabilities
  • 13.
    contd. Accounts payable: Increase: Costof goods sold from profit and loss statement Decrease: Cash paid to suppliers on cash flow statement Accrued expenses: Increase: Expenses from profit and loss statement Decrease: Cash paid for expenses on cash flow statement Other liabilities: Increase: Other expenses from profit and loss statement Decrease: Cash paid for other liabilities on cash flow statement Shareholders' equity Common stock: Increase: Issuance of common stock on cash flow statement Decrease: Repurchase of common stock on cash flow statement Retained earnings: Increase: Net income from profit and loss statement Decrease: Dividends paid to shareholders on cash flow statement The above statement can be used to explain the changes in all balance sheet items using the information in the sta and loss and cash flow statement.
  • 14.