Download as PDF, PPTX


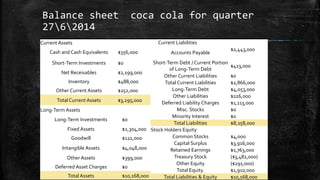

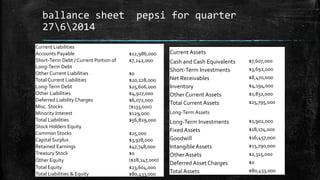

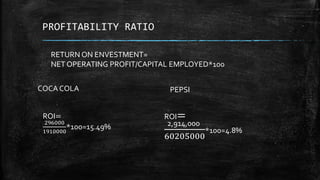
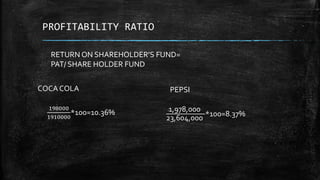
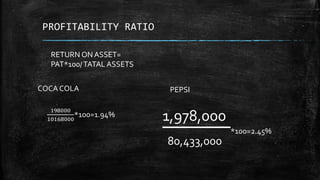
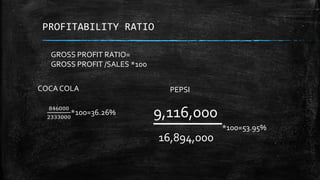
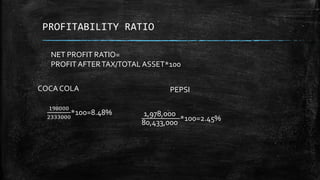
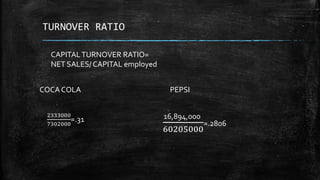
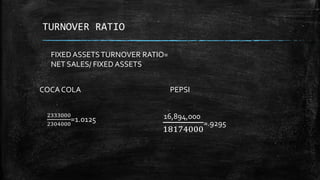
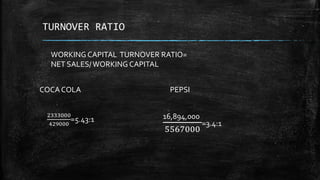
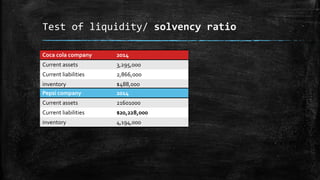

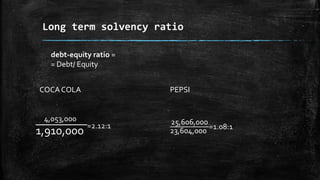
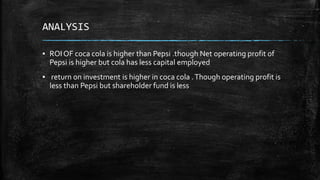


This document compares the financial position of Coca Cola and Pepsi through ratio analysis. It provides balance sheet and profit and loss statements for both companies for the quarter ending June 27, 2014. It then calculates and compares various ratios between the two companies to analyze their profitability, liquidity, turnover, and solvency. Key ratios show Coca Cola has a higher return on investment and return on assets, while Pepsi has higher revenue, gross profit ratio, and current ratio. In conclusion, while Pepsi earns more profit, Coca Cola provides a better return on investment.


