Valuation Of Maruti Suzuki
•
2 likes•1,645 views

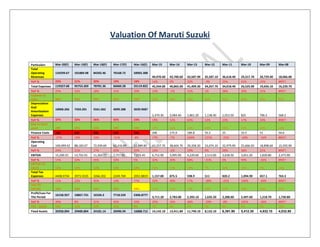
- The document provides financial data for Maruti Suzuki from March 2008 to the estimated March 2020, including revenues, expenses, profits, assets, liabilities, and other financial metrics. - It shows steady annual revenue growth for Maruti Suzuki over this period, from around Rs. 18 billion in 2008 to an estimated Rs. 1,242.99 billion in 2020, with expenses also increasing but remaining a high percentage of total revenues. - Profits have also increased substantially over time, with the net profit estimated at Rs. 161.58 billion for fiscal year ending March 2020, up significantly from Rs. 1,218.70 billion in 2008.

More Related Content
What's hot
What's hot (20)
Viewers also liked
Viewers also liked (20)
Similar to Valuation Of Maruti Suzuki
Similar to Valuation Of Maruti Suzuki (20)
More from Aakash Singh
Valuation Of Maruti Suzuki
- 1. Valuation Of Maruti Suzuki Particulars Mar-20(F) Mar-19(F) Mar-18(F) Mar-17(F) Mar-16(E) Mar-15 Mar-14 Mar-13 Mar-12 Mar-11 Mar-10 Mar-09 Mar-08 Total Operating Revenues 124299.67 101884.98 84202.46 70168.72 58965.308 49,970.60 43,700.60 43,587.90 35,587.10 36,618.40 29,317.70 20,729.40 18,066.80 YoY % 22% 21% 20% 19% 18% 14% 0% 22% -3% 25% 41% 15% #REF! Total Expenses 119327.68 95753.269 78701.36 66660.28 55119.822 45,934.00 40,865.00 41,409.30 34,267.70 34,018.40 26,525.00 19,656.10 16,220.70 YoY % 25% 22% 18% 21% 20% 12% -1% 21% 1% 28% 35% 21% #REF! Expense to sales 96% 94% 93% 95% 93% 92% 94% 95% 96% 93% 90% 95% 90% Depreciation And Amortisation Expenses 10068.266 7350.201 5561.662 4099.388 3039.9687 2,470.30 2,084.40 1,861.20 1,138.40 1,013.50 825 706.5 568.2 YoY % 37% 32% 36% 35% 23% 19% 12% 63% 12% 23% 17% 24% #REF! Dep to fixed asset 28% 25% 23% 20% 18% 17% 16% 16% 14% 16% 15% 14% 14% Finance Costs 160 220 200 150 190 206 175.9 189.8 55.2 25 33.5 51 59.6 YoY % -27% 10% 33% -21% -8% 17% -7% 244% 121% -25% -34% -14% #REF! Operating Cost 109,099.42 88,183.07 72,939.69 62,410.89 51,889.85 43,257.70 38,604.70 39,358.30 33,074.10 32,979.90 25,666.50 18,898.60 15,592.90 YoY % 24% 21% 17% 20% 20% 12% -2% 19% 0% 28% 36% 21% #REF! EBITDA 15,200.25 13,701.91 11,262.77 7,757.82 7,075.45 6,712.90 5,095.90 4,229.60 2,513.00 3,638.50 3,651.20 1,830.80 2,473.90 YoY % 11% 22% 45% 10% 5% 32% 20% 68% -31% 0% 99% -26% #REF! EBITDA TO SALES 12% 12% 12% 12% 12% 13% 12% 10% 7% 10% 12% 9% 14% Total Tax Expenses 4408.0734 3973.5535 3266.202 2249.769 2051.8819 1,157.00 875.5 598.9 511 820.2 1,094.90 457.1 763.3 YoY % 11% 22% 45% 10% 77% 32% 46% 17% -38% -25% 140% -40% #REF! TAX TO EBITDA 29% 29% 29% 29% 29% 17% 17% 14% 20% 23% 30% 25% 31% Profit/Loss For The Period 16158.957 10867.731 10104.3 7718.559 5306.8777 3,711.20 2,783.00 2,392.10 1,635.20 2,288.60 2,497.60 1,218.70 1,730.80 YoY % 49% 8% 31% 45% 43% 33% 16% 46% -29% -8% 105% -30% #REF! PAT - SALES 13% 11% 12% 11% 9% 7% 6% 5% 5% 6% 9% 6% 10% Fixed Assets 35958.094 29400.804 24181.14 20496.94 16888.715 14,142.10 13,411.80 11,740.10 8,132.10 6,391.90 5,412.30 4,932.10 4,032.80
- 2. YoY % 22% 22% 18% 21% 19% 5% 14% 44% 27% 18% 10% 22% #REF! Fixed Assets - SALES Margin 29% 29% 29% 29% 29% 28% 31% 27% 23% 17% 18% 24% 22% Total Current Liabilities 17936.569 14736.074 12307.36 10480.34 8589.3896 8,823.00 8,074.10 6,727.50 6,547.60 4,018.70 3,969.30 3,463.60 3,218.60 YoY % 22% 20% 17% 22% -3% 9% 20% 3% 63% 1% 15% 8% #REF! CL to Sales 18% 18% 18% 18% 17% 18% 18% 15% 18% 11% 14% 17% 18% Total Current Assets 23776.062 19925.994 15331.62 14443.26 12317.252 8,197.90 14,171.70 10,946.00 11,079.00 9,620.20 3,772.40 5,491.10 3,090.90 YoY % 19% 30% 6% 17% 50% -42% 29% -1% 15% 155% -31% 78% #REF! CA to Sales 23% 24% 22% 24% 25% 16% 32% 25% 31% 26% 13% 26% 17% Working Capital 5,839.49 5,189.92 3,024.26 3,962.92 3,727.86 -625.10 6,097.60 4,218.50 4,531.40 5,601.50 -196.90 2,027.50 -127.70 change in WC 649.57 2,165.66 -938.66 235.06 4,352.96 -6,722.70 1,879.10 -312.90 -1,070.10 5,798.40 -2,224.40 2,155.20 #REF! CAPEX -3,510.98 -2,130.54 -1,877.46 -491.16 -293.35 -1,740.00 -412.70 1,746.80 601.80 -33.90 -344.80 192.80 #REF! FCFF(revenue model) 13,653.58 9,693.23 10,812.69 5,764.16 963.96 14,018.60 2,754.00 2,196.80 2,470.30 -2,946.20 5,125.50 -974.30 #REF! Total Assets 62,535.79 55,382.18 48,858.79 43,436.88 38,468.10 33,551.00 30,535.70 26,734.20 22,302.20 18,425.10 16,444.90 13,675.40 12,404.00 YoY % 13% 13% 12% 13% 15% 10% 14% 20% 21% 12% 20% 10% #REF! Cost Of Materials Consumed 46,738.82 43,581.94 40,611.08 37,285.24 35,343.04 32,867.80 28,898.90 30,349.20 26,707.00 27,141.80 21,947.90 15,451.20 13,328.50 YoY % 7% 7% 9% 5% 8% 14% -5% 14% -2% 24% 42% 16% #REF! Purchase Of Stock-In Trade 5,687.49 4,936.86 4,230.59 3,681.18 3,229.25 2,665.20 2,431.40 2,186.40 1,532.50 1,278.10 905 725.6 777.1 YoY % 15% 17% 15% 14% 21% 10% 11% 43% 20% 41% 25% -7% #REF! Operating And Direct Expenses #DIV/0! #DIV/0! #DIV/0! #DIV/0! #DIV/0! 0 0 0 0 0 1,061.60 716.1 523.3 YoY % #DIV/0! #DIV/0! #DIV/0! #DIV/0! #DIV/0! #DIV/0! #DIV/0! #DIV/0! #DIV/0! -100% 48% 37% #REF! Changes In Inventories Of FG,WIP And Stock-In Trade 40 60 -40 50 73 -455.9 18.5 23.4 -131.2 -56 -200.9 356.6 -336.3 YoY % -33% -250% -180% -32% -116% -2564% -21% -118% 134% -72% -156% -206% #REF! COGS 52,466.31 48,578.80 44,801.67 41,016.42 38,645.28 35,077.10 31,348.80 32,559.00 28,108.30 28,363.90 22,652.00 16,533.40 13,769.30 Total Shareholders Funds 47,108.61 41,183.13 35,870.36 31,366.95 27,515.80 23,704.20 20,978.00 18,578.90 15,187.40 13,867.50 11,835.10 9,344.90 8,415.40 YoY % 14% 15% 14% 14% 16% 13% 13% 22% 10% 17% 27% 11% #REF! Total Capital And Liabilities 62,535.79 55,382.18 48,858.79 43,436.88 38,468.10 33,551.00 30,535.70 26,734.20 22,302.20 18,425.10 16,444.90 13,675.40 12,404.00 YoY % 13% 13% 12% 13% 15% 10% 14% 20% 21% 12% 20% 10% #REF!
- 3. Inventories 7,250.07 5,830.41 4,767.40 3,665.93 3,037.14 2,615.00 1,705.90 1,840.70 1,796.50 1,415.00 1,208.80 902.3 1,038.00 YoY % 24% 22% 30% 21% 16% 53% -7% 2% 27% 17% 34% -13% #REF! Cash And Cash Equivalents 0.10 0.28 0.80 2.90 7.07 18.3 629.7 775 2,436.10 2,508.50 98.2 1,939.00 324 YoY % -65% -64% -72% -59% -61% -97% -19% -68% -3% 2454% -95% 498% #REF! Current Investments 2,283.97 2,460.41 2,571.26 3,203.40 3,124.31 2,996.40 8,813.10 5,204.80 4,754.10 3,995.60 0 0 0 YoY % -7% -4% -20% 3% 4% -66% 69% 9% 19% #DIV/0! #DIV/0! #DIV/0! #REF! Trade Receivables 961.28 1,009.82 1,022.28 1,099.18 1,171.87 1,069.80 1,413.70 1,469.90 937.6 824.5 809.9 918.9 655.5 YoY % -5% -1% -7% -6% 10% -24% -4% 57% 14% 2% -12% 40% #REF! Trade Payables 12,198.68 10,457.97 8,930.38 7,684.16 6,589.59 5,561.40 4,897.50 4,157.90 3,349.90 2,608.30 2,318.10 2,569.60 854.9 YoY % 17% 17% 16% 17% 18% 14% 18% 24% 28% 13% -10% 201% #REF! EBIT 5,131.99 6,351.71 5,701.10 3,658.44 4,035.49 4,242.60 3,011.50 2,368.40 1,374.60 2,625.00 2,826.20 1,124.30 1,905.70 Basic EPS (Rs.) 107.01 71.97 66.92 51.12 35.14 24.58 18.43 15.84 11.32 15.84 17.28 8.43 11.98 CURRENT MARKET PRICE AS ON 31 MAR 2016 3719.1 3719.1 3719.1 3719.1 3719.1 3719.1 3719.1 3719.1 3719.1 3719.1 3719.1 3719.1 3719.1 Equity Share Capital 151 151 151 151 151 151 151 151 144.5 144.5 144.5 144.5 144.5 Profit/Loss Before Tax 20,567.03 14,841.28 13,370.50 9,968.33 7,358.76 4,868.20 3,658.50 2,991.00 2,146.20 3,108.80 3,592.50 1,675.80 2,494.10 YoY % 30% 31% 31% 29% 32% 33% 22% 39% -31% -13% 114% -33% #REF!
- 4. DCF ANALYSIS Particulars FCFF (EBITDA Formula) WACC Years (t) Discounted FCFF Mar-20 16573.38012 7% 5 11816.59097 Mar-19 11824.78891 7% 4 9021.074841 Mar-18 12425.5722 7% 3 10142.96821 Mar-17 6952.980996 7% 2 6073.002879 Mar-16 1845.554858 7% 1 1724.817624 Mar-15 14444.36786 Mar-14 3112.109892 Mar-13 2460.340921 Mar-12 2701.785237 Mar-11 -2717.734231 Mar-10 5372.896062 Mar-09 -797.9065381
- 5. Mar-08 #REF! Sum of Discounted FCFF 38778.45 Terminal Value (Growth 5%) 870102.5 Dicsounted Terminal Value (t=5) 620371 Value of company (Sum of Discounted FCFF+Discounted Terminal Value) 659149.5 Shares Outstanding 151 FCFF per share 4365.228 Current Market Price(31 March 2016) 3719 UPSIDE 17% BUY CALL
- 6. Forecasting Financial Ratios Profitability Ratios Profitability Ratios Mar- 20(F) Mar- 19(F) Mar- 18(F) Mar-17(F) Mar-16 (E) Mar-15 Mar-14 Mar-13 Mar-12 Mar-11 Mar-10 Mar-09 Mar-08 Gross Profit Ratio ((Total Operating Revenues- COGS)/Total Operating Revenues) 57.79% 52.32% 46.79% 41.55% 34.46% 29.80% 28.26% 25.30% 21.02% 22.54% 22.74% 20.24% 23.79% Return on Sales [PAT/Total Operating Revenues) 13.00% 10.67% 12.00% 11.00% 9.00% 7.43% 6.37% 5.49% 4.59% 6.25% 8.52% 5.88% 9.58% Return on Assets [PAT/ Average Total Assets] 25.84% 19.62% 20.68% 17.77% 13.80% 11.06% 9.11% 8.95% 7.33% 12.42% 15.19% 8.91% 13.95% Return on Equity [PAT / Average Stockholders' Equity] 34.30% 26.39% 28.17% 24.61% 19.29% 15.66% 13.27% 12.88% 10.77% 16.50% 21.10% 13.04% 20.57% Net Profit Ratio [PAT/Total Operating Revenue] 13.00% 10.67% 12.00% 11.00% 9.00% 7.43% 6.37% 5.49% 4.59% 6.25% 8.52% 5.88% 9.58% Liquidity Ratios Liquidity Ratios Current Ratio [Current Assets / Current Liabilities] 1.32556 1.3522 1.2457 1.378129 1.434 0.9292 1.7552 1.62705 1.69207 2.39386 0.9504 1.58537 0.96032 Quick Ratio [(Current Assets- Inventory) / Current Liabilities] 0.92136 0.9565 0.8584 1.028337 1.0804 0.6328 1.5439 1.35344 1.4177 2.04175 0.6459 1.32486 0.63782 Cash Ratio [(Cash and cash equi. + current investment) / CL 0.12734 0.167 0.209 0.305934 0.3646 0.3417 1.1695 0.88886 1.09814 1.61846 0.0247 0.55982 0.10066
- 7. Net Working Capital [Current Assets - Current Liabilities] 5839.49 5189.9 3024.3 3962.921 3727.9 -625.1 6097.6 4218.5 4531.4 5601.5 -196.9 2027.5 -127.7 Management Efficiency Ratios Management Efficiency Ratios Receivable Turnover [Sales / Accounts Receivable] 129.306 100.89 82.367 63.83733 50.317 46.71 30.912 29.6536 37.9555 44.4129 36.199 22.5589 27.5619 Day Sales Outstanding [365*( Trade Receivables/Sales)] 2.82276 3.6176 4.4314 5.717657 7.254 7.8141 11.808 12.3088 9.61652 8.21834 10.083 16.1798 13.2429 Inventory Turnover (COGS/Avg. Inventory) 7.23667 8.332 9.3975 11.18853 12.724 13.414 18.377 17.6884 15.6461 20.0452 18.739 18.3236 13.2652 Days Inventory Outstanding [365*( Inventory/ COGS)] 50.4376 43.807 38.84 32.62269 28.685 27.211 19.862 20.635 23.3284 18.2089 19.478 19.9196 27.5156 Accounts Payable Turnover (COGS / Accounts Payable) 4.30098 4.6451 5.0168 5.337792 5.8646 6.3072 6.401 7.83064 8.39079 10.8745 9.7718 6.43423 16.1063 Days Payable Outstanding [365*(Accounts Payable/COGS)] 84.8643 78.577 72.756 68.38034 62.238 57.87 57.023 46.6118 43.5001 33.5648 37.352 56.7278 22.6619 Operating Cycle [Days Inventory+Days Sales] 53.2604 47.425 43.271 38.34035 35.939 35.025 31.67 32.9438 32.9449 26.4272 29.561 36.0995 40.7585 Cash Conversion Cycle [Day Sales O/S+Days Inventory O/S- Days Payable O/S] -31.604 -31.15 -29.485 -30.04 -26.299 -22.85 -25.353 -13.668 -10.555 -7.1376 -7.791 -20.628 18.0966 Total Asset Turnover [Sales/ Total Assets] 1.98766 1.8397 1.7234 1.615418 1.5328 1.4894 1.4311 1.63042 1.59568 1.98742 1.7828 1.51582 1.45653 Leverage Ratios Leverage Ratios Debt Ratio [Total Liabilities/Total Assets] 1 1 1 1 1 1 1 1 1 1 1 1 1 Equity Ratio [Total Equity / 0.75331 0.7436 0.7342 0.722127 0.7153 0.7065 0.687 0.69495 0.68098 0.75264 0.7197 0.68334 0.67844
- 8. Total Assets] Debt-Equity Ratio [Total Liabilities / Total Equity] 1.32748 1.3448 1.3621 1.384798 1.398 1.4154 1.4556 1.43895 1.46847 1.32865 1.3895 1.46341 1.47396 Times Interest Earned [(PBT+Finance Cost) / Finance Cost] 129.544 68.46 67.852 67.45552 39.73 24.632 21.799 16.7587 39.8804 125.352 108.24 33.8588 42.8473 Valuation Growth Ratios EPS [PAT/NO. Of Share] 107.013 71.972 66.916 51.11628 35.145 24.577 18.43 15.8417 11.3163 15.8381 17.284 8.43391 11.9779 Price- Earnings Ratio [Current Market Price/EPS] 34.7537 51.674 55.579 72.75764 105.82 151.32 201.79 234.766 328.651 234.82 215.17 440.97 310.498 Book Value per Share [Shareholder's Funds/No Of Share] 311.978 272.74 237.55 207.7281 182.22 156.98 138.93 123.039 105.103 95.9689 81.904 64.6706 58.2381 PB Ratio [Current Market Price/BV] 11.921 13.636 15.656 17.90369 20.41 23.691 26.77 30.227 35.3853 38.7532 45.408 57.5084 63.8603
- 9. Valuation Ratios DATA Required 2015 CMP ON 31 MARCH 2016 3719.1 P/E 151.3214324 EPS ON 31 MARCH 2016 24.57748344 P/B 23.69133318 REVENUE ON 31 MARCH 2016 49,970.60 P/SALES RATIO 11.23829011 NO . O/S SHARE 151 PRICE TO CASH FLOW 87.60242411 NET WORTH 23,704.20 PRICE TO EARNING GROWTH RATIO 42.45430464 ANNUAL DIVIDEND 500.00 DIVIDEND YIELD 0.134441128 CASH FLOW FROM OPERATION 6410.6 MARKET CAP 561584.1 EPS GROWTH 33% ENTERPRISE VALUE 561422.2 SHORT TERM BORROWING 35.4 NET DEBT 161.9 LONG TERM BORROWING 144.8 EV/EBITDA 83.63333284 CASH & CASH EQUIVALENT 18.3 EV/SALES 11.23505021 EBITDA 6,712.90 EV/EBIT 132.3297506 Net Debt= SHORT TERM BORROWING+LONG TERM BORROWING-CASH & CASH EQUIVALENT
- 10. Analysis Company Profiles: Company 1: Maruti Suzuki: Maruti Suzuki India Limited, formerly known as Maruti Udyog Limited, is an automobile manufacturer in India. It is a subsidiary of Japanese automobile and motorcycle manufacturer Suzuki Motor Corporation. As of January 2016, it had a market share of 47% of the Indian passenger car market. Maruti Suzuki manufactures and sells popular cars such as the Alto, Swift, Zen, Celerio, Swift DZire, SX4 and Omni. The company is headquartered at New Delhi. Discounted Cash Flow Valuation 1. Revenue Growth: The revenue growth of the companies has been assumed as follows: Company 1: Maruti Suzuki: Maruti Suzuki has an potential to grow with an average growth of 22-25 % and the car industry is going to give 5 million car industry by 2020(as per live mint Dated : 26 Jul,2016) and on this basis the future operating revenue forecasting has been done with an growth rate of 18-22%. According to sales estimates from analysts polled by Thomson-Reuters, the company is among the best with regard to growth. Maruti Suzuki India (MSIL) maintained its leadership position with ~45% market share and its presence in the value for money segment, new launches and an extensive sales network, getting a boost from reviving domestic demand and rising export volumes. With strong export growth and an expanding domestic market, we expect MSIL’s net sales to grow at 18-22% CAGR. 2. The other financials are based on the revenue and the average/estimated of the last three –five years. 3. WACC (Weighted Average Cost of Capital) for all the three companies are calculated as follows: WACC Calculation Maruti Suzuki WACC 7% Weight of Debt 30.0% Weight of Equity 70.0% After-tax Cost of Debt 2.1% Corporate tax rate 29.0% Cost of Debt 3.0%
- 11. Cost of Equity 9.1% Adjusted Risk free Rate 5.0% Annual inflation rate 9.0% Country Risk Premium 1.5% Risk free Rate 8.0% Unlevered Beta 0.92 Market Premium 4.0% 4. Terminal Growth Rate Assumption: T growth rate is taken 5 % assumption for all the three companies. 5. After calculating the value of the company the following recommendation can be given for each of the companies: Name of the Company FCFF/ Share (Rs) Current Market Price (Rs) Upside (%) Recommendation Maruti Suzuki 4365.228347 3719 ( As on 31 March 2016) 17% BUY This report has been prepared by Aakash Singh, MBA Finance Student (SIBM HYD) only for the learning purpose. It includes research analysis, projections, forecasts and other predictive statements providing a basis for investment decisions. The views expressed therein are based solely on information available publicly/internal data/other reliable sources believed to be true. The information is provided merely as a complementary service and do not constitute an offer, solicitation for the purchase or sale of any financial instruments or neither me nor anyone responsible for the risk held by the investor.