SlideShare a Scribd company logo
Q1 Q2 Q3 Q4 Total
MVA 770 1,414 1,756 1,706 5,645
Sales	
  
Power 10,000,000 13,000,000 15,500,000 14,500,000 53,000,000
Dry 2,500,000 5,499,999 8,499,999 10,500,003 27,000,001
Scrap 150,000 222,000 288,000 300,000 960,000
Total	
  Sales 12,650,000 18,721,999 24,287,999 25,300,003 80,960,001
COGS
Power (6,850,000) (10,160,000) (11,865,000) (10,875,000) (39,750,000)
Dry (1,675,000) (3,514,999) (5,404,999) (6,930,002) (17,525,001)
Depreciation	
   (828,040) (854,673) (872,246) (905,042) (3,460,002)
Overheads (1,383,606) (1,410,236) (1,463,496) (1,463,496) (5,720,833)
Cogs 0 0 0 0 0
Cogs 0 0 0 0 0
Other	
  Cogs 0 0 0 0 0
Total	
  COGS (10,736,646) (15,939,908) (19,605,741) (20,173,540) (66,455,835)
Gross	
  Profit 1,913,354 2,782,091 4,682,258 5,126,463 14,504,166
Selling	
  	
  Expense (330,785) (355,785) (614,805) (631,779) (1,933,154)
G&A	
  Expense (297,754) (319,354) (348,176) (357,186) (1,322,470)
Depreciation	
  S,	
  G&A	
   (52,854) (54,554) (55,675) (57,769) (220,851)
Royalites	
  TEBEA 0 0 0 0 0
Net	
  Operating	
  Profit	
  (EBIT) 1,231,962 2,052,398 3,663,602 4,079,729 11,027,691
Bank	
  Interest	
  &	
  Finanance	
  cost	
   (442,330) (437,738) (792,570) (826,230) (2,498,868)
Ideal	
  Power	
  	
  -­‐	
  	
  Wage 0 0 0 0 0
Ideal	
  Power	
  	
  -­‐	
  	
  Depreciation 0 0 0 0 0
Foreign	
  Exchange	
  Differences 0 0 0 0 0
Net	
  Profit	
  Before	
  Tax 789,632 1,614,660 2,871,032 3,253,499 8,528,823
Deferred	
  Expense (177,500) (400,000) (355,000) (400,000) (1,332,500)
Net	
  Income	
   612,132 1,214,660 2,516,032 2,853,499 7,196,323
Key	
  Profitability	
  Indicators Q1 Q2 Q3 Q4 Total
Gross	
  Profit 15% 15% 19% 20% 18%
Other	
  Sales	
  Gross	
  Profit
EBIT	
  Margin 10% 11% 15% 16% 14%
EBITDA	
  Margin 17% 16% 19% 20% 18%
Net	
  Profit	
  Margin 5% 6% 10% 11% 9%
Depreciation	
  Margin	
  operatinal 7% 5% 4% 4% 5%
Budgeted Income Statement
USD Q1 Q2 Q3 Q4
Assets
Cash 	
  -­‐	
  6,098,740 	
  -­‐	
  5,952,764 129,592 3,038,623
	
  Receivables	
   15,617,390 16,450,723 17,117,389 17,450,726
Finished	
  Goods	
  Inventory 0 0 0 0
Work	
  In	
  Progress	
  Inventory 0 0 0 0
Raw	
  Materials	
  Inventory 17,891,812 20,866,479 22,611,312 24,391,813
Goods	
  in	
  Transit	
  &	
  Others 0 0 0 0
Total	
  Inventory 17,891,812 20,866,479 22,611,312 24,391,813
Dues	
  from	
  Related	
  Parties	
   8,671,420 8,671,420 8,671,420 8,671,420
Other	
  Debit	
  Balances 0 0 0 0
Other	
  Current	
  Assets 0 0 0 0
Total	
  Current	
  Assets 36,081,882 40,035,858 48,529,714 53,552,582
Net	
  Plant	
  Property	
  &	
  Equipment 42,040,199 41,130,972 40,303,051 39,340,240
Total	
  Long-­‐Term	
  Assets 42,040,199 41,130,972 40,303,051 39,340,240
Total	
  Assets 78,122,081 81,166,830 88,832,764 92,892,822
Liabilities
Bank	
  Overdrafts 0 0 0 0
Importation	
  Finance	
  (L/Cs) 0 0 0 0
Secured	
  Borrowings	
  (with	
  Recourse) 0 0 0 0
Total	
  Short-­‐term	
  Facilities 0 0 0 0
Current	
  Portion	
  of	
  Long-­‐Term	
  Debt 0 0 0 0
Accounts	
  &	
  Notes	
  Payable 	
  -­‐	
  5,620,879 	
  -­‐	
  3,547,642 5,847,261 6,653,820
Dues	
  to	
  Related	
  Parties	
  (Specific) 0 0 0 0
0 0 0 0 0
Dues	
  to	
  Related	
  Parties	
   74,574,155 74,574,155 74,574,155 74,574,155
Other	
  Current	
  Liabilities 643,149 0 0 0
Total	
  Current	
  Liabilities 69,596,425 71,026,513 80,421,416 81,227,975
Medium-­‐term	
  Loans
Long-­‐Term	
  Payables 4,600,000 4,600,000 0 0
Total	
  Long-­‐Term	
  Liabilities 4,600,000 4,600,000 0 0
Total	
  Liabilities 74,196,425 75,626,513 80,421,416 81,227,975
Equity
Common	
  Stock
Retained	
  Earning	
  "Opening" 3,522,860 4,579,283 6,653,684 9,380,889
Add:	
  	
  Net	
  Profit 225,297 383,533 825,164 951,459
Less:	
  	
  Dividends 0 0 0 0
Retained	
  Earning	
  "Ending" 3,748,157 4,962,817 7,478,848 10,332,348
Shareholders'	
  loan 0 0 0 0
Total	
  Equity 3,748,157 4,962,817 7,478,848 10,332,348
0 0 0 0 0
Balance Sheet
USD Q1 Q2 Q3 Q4
Cash	
  Flows	
  from	
  Operating	
  Activities
Net	
  Income 225,297 383,533 825,164 951,459
Tax	
  Expense 59,167 133,333 118,333 133,333
Depreciation 0 0 0 0
Forex	
  Differences 0 0 0 0
Adjusted	
  Net	
  income 284,464 516,867 943,497 1,084,792
Decrease	
  (Increase)	
  in	
  Inventory	
  Balances 1,548,333 	
  -­‐	
  1,151,333 	
  -­‐	
  593,500 	
  -­‐	
  593,500
Increase	
  (Decrease)	
  in	
  Receivables	
  	
  	
  and	
  Other	
  
Debit	
  Balances 5,533,332 	
  -­‐	
  0 0 	
  -­‐	
  3
Increase	
  (Decrease)	
  in	
  Payables	
  and	


  Other	
  Credit	
  Balances 	
  -­‐	
  6,437,380 1,530,197 2,108,213 3,986
Net	
  Cash	
  Flows	
  from	
  Operating	
  Activities 928,750 895,731 2,458,211 495,275
Cash	
  Flows	
  from	
  Investing	
  activities
Capital	
  Expenditures 	
  -­‐	
  1,396,924 303,076 320,937 320,937
Capitalized	
  Interest 0 0 0 0
Net	
  Cash	
  Flows	
  from	
  Investing	
  Activities 	
  -­‐	
  1,396,924 303,076 320,937 320,937
Cash	
  Flows	
  from	
  Financing	
  activities
Proceeds	
  from	
  Capital	
  Increase 0 0 0 0
Increase	
  (Decrease)	
  in	
  Long-­‐Term	
  Liabilities 	
  -­‐	
  4,600,000 0 0 0
Dividends	
  Paid 0 0 0 0
Increase	
  (Decrease)	
  in	
  Shareholders'	
  loan 0 0 0 0
Increase	
  (Decrease)	
  in	
  Bank	
  Overdrafts 0 0 0 0
Increase	
  (Decrease)	
  in	
  Financed	
  L/Cs 0 0 0 0
Increase	
  (Decrease)	
  in	
  Secured	
  Borrowings 0 0 0 0
0 0 0 0
Net	
  Cash	
  Flows	
  from	
  Financing	
  Activities 	
  -­‐	
  4,600,000 0 0 0
Net	
  Increase	
  (Decrease)	
  In	
  Cash	
  Balance 	
  -­‐	
  5,068,174 1,198,806 2,779,148 816,212
Opening	
  cash	
  Balance 	
  -­‐	
  1,089,733 	
  -­‐	
  7,284,903 	
  -­‐	
  2,767,889 2,089,078
Ending	
  Cash	
  Balance (6,157,907)	


   (6,086,097)	


   11,259	


   2,905,290	


USD Q1 Q2 Q3 Q4
Cash	
  Flows	
  from	
  Operating	
  Activities 928,750 895,731 2,458,211 495,275
Cash	
  Flows	
  from	
  Investing	
  activities 	
  -­‐	
  1,396,924 303,076 320,937 320,937
Cash	
  Flows	
  from	
  Financing	
  activities 	
  -­‐	
  4,600,000 0 0 0
Net	
  Increase	
  (Decrease)	
  In	
  Cash	
  Balance 	
  -­‐	
  5,068,174 1,198,806 2,779,148 816,212
Ending	
  Cash	
  Balance (6,157,907)	


   (6,086,097)	


   11,259	


   2,905,290	


0 0 0 0
Projected Cash Flow
Summarized Cash Flow Statement (Indirect Method)
USD Q1 Q2 Q3 Q4
Short-­‐Term	
  Bank	
  Facilities 0 0 0 0
Spontaneous	
  Financing 69,596,425 71,026,513 80,421,416 81,227,975
0
Long-­‐Term	
  Bank	
  Debt	
  &	
  Equivelants 4,600,000 4,600,000 0 0
0
Equity	
  &	
  Shareholders'	
  loan 3,748,157 4,962,817 7,478,848 10,332,348
Total 77,944,581 80,589,330 87,900,264 91,560,322
	
  -­‐	
  177,500.00 	
  -­‐	
  577,500.00 	
  -­‐	
  932,500.00 	
  -­‐	
  1,332,500.00
USD Q1 Q2 Q3 Q4
Long-­‐Term	
  Assets 42,040,199 41,130,972 40,303,051 39,340,240
Net	
  Operating	
  Working	
  Capital 	
  -­‐	
  33,514,542 	
  -­‐	
  30,990,655 	
  -­‐	
  31,891,702 	
  -­‐	
  27,675,393
Total	
  Bank	
  Debt 4,600,000 4,600,000 0 0
Equity	
  &	
  Shareholders'	
  loan 3,748,157 4,962,817 7,478,848 10,332,348
Net	
  Investment 33,600,459 27,511,220 19,945,105 28,142,667
Item
Dupoint Formula Q1 Q2 Q3 Q4
RETURN	
  ON	
  SALES 4.84% 6.49% 10.36% 11.28%
TOTAL	
  ASSET	
  TURNOVER 0.49 0.69 0.82 0.82
RETURN	
  ON	
  ASSETS 2.35% 4.49% 8.50% 9.22%
ASSET	
  LEVERAGE 20.84 16.35 11.88 8.99
RETURN	
  ON	
  EQUITY 49% 73% 101% 83%
Item Q1 Q2 Q3 Q4
Profitability
Sales	
  Growth N/A 48.0% 29.7% 4.2%
COGS	
  /	
  Sales 84.9% 85.1% 80.7% 79.7%
Gross	
  Profit	
  Margin 15.1% 14.9% 19.3% 20.3%
S	
  G&A	
  /	
  Sales 2.6% 1.9% 2.5% 2.5%
Interest	
  /	
  Sales 3.5% 2.3% 3.3% 3.3%
FX	
  Loss	
  /	
  Sales 0.0% 0.0% 0.0% 0.0%
EBITDA	
  Margin 9.7% 11.0% 15.1% 16.1%
Net	
  Operating	
  Profit	
  Margin 9.7% 11.0% 15.1% 16.1%
NPBT	
  /	
  Sales 6.2% 8.6% 11.8% 12.9%
Profit	
  margin 4.8% 6.5% 10.4% 11.3%
Net	
  Profit	
  Growth N/A 98% 107% 13%
Item Q1 Q2 Q3 Q4
Asset Efficiency & Turnover
Net	
  Investment	


  USD 33,600,459	


   27,511,220	


   19,945,105	


   28,142,667	


Fixed	
  Assets	
  Turnover 0.90	


   1.37	


   1.81	


   1.93	


Working	
  Capital	
  Turnover 1.05	


   1.40	


   1.50	


   1.42	


Financial Highlights'
Financial Structure
Financial Structure
Item Q1 Q2 Q3 Q4
Business Cycles
Net	
  Cash	
  to	
  Cash	
  Cycle N/A N/A N/A N/A
Total	
  Receivables	
  Days	
  on	
  Hands 86 119 94 369
Third	
  Party	
  Receivables	
  Days	
  on	
  Hand 111 77 62 246
Affiliates	
  Receivables	
  Days	
  On	
  Hand 31 42 96 123
Inventory	
  Days	
  On	
  Hand 150 109 299 419
RM	
  Days	
  On	
  Hand 150 109 299 419
WIP	
  Days	
  On	
  Hand N/A N/A N/A N/A
FG	
  Days	
  On	
  Hand N/A N/A N/A N/A
GIT	
  &	
  Others	
  	
  Days	
  On	
  Hand N/A N/A N/A N/A
Other	
  Current	
  Assets	
  Days	
  On	
  Hand N/A N/A N/A N/A
Total	
  Payables	
  Days	
  on	
  Hands 289 395 1,043 1,442
Third	
  Party	
  payables	
  Days	
  on	
  Hand -­‐47	
   -­‐26	
   16 112
Affiliates	
  payables	
  Days	
  On	
  Hand 313 421 1,027 1,331
Other	
  Current	
  Liabilities	
  Days	
  On	
  Hand 5 2 N/A N/A
Item Q1 Q2 Q3 Q4
LIQUIDITY
Cash	
  Ratio 0.088-­‐	


   0.08-­‐	


   0.00	


   0.04	


Current	
  Ratio 0.5	


   0.6	


   0.6	


   0.7	


Quick	
  Ratio 0.3	


   0.3	


   0.3	


   0.4	


EBITDA	


  USD 14,783,541 24,628,775 43,963,221 48,956,749
Net	
  Working	
  Capital	


  USD -­‐33,514,542	
   -­‐30,990,655	
   -­‐31,891,702	
   -­‐27,675,393	
  
Item Q1 Q2 Q3 Q4
LEVERAGE & CAPITAL STRUCTURE
Financial	
  Leverage 	
  20.8	
   	
  16.4	
   	
  11.9	
   	
  9.0	
  
Gearing	
  (Bank	
  Debt/Equity) 	
  1.2	
   	
  0.9	
   	
  0.0	
   	
  0.0	
  
Current	
  Lab.	
  /	
  Total	
  Assets 89% 88% 91% 87%
Total	
  Bank	
  Debt	
  /	
  EBITDA 	
  0.3	
   	
  0.2	
   	
  0.0	
   	
  0.0	
  
Operating	
  Cash	
  Flows	
  /	
  Interest 	
  2.1	
   	
  2.0	
   	
  3.1	
   	
  0.6	
  
Operating	
  Cash	
  Flows	
  /	
  Bank	
  Debt 	
  2.4	
   	
  2.3	
   N/A N/A
Times	
  Interest	
  Covered	
  (Per	
  EBIT) 	
  2.8	
   	
  4.7	
   	
  4.6	
   	
  4.9	
  
Fixed	
  Charge	
  Coverage	
  (Per	
  EBIT) 	
  2.8	
   	
  4.7	
   	
  4.6	
   	
  4.9	
  
USD Q1 Q2 Q3 Q4 Total
Cash	
  Flows	
  from	
  Operating	
  Activities
Net	
  Cash	
  Collections	
  from	
  Sales 	
  -­‐	
  24,288,810 	
  -­‐	
  833,332 	
  -­‐	
  666,667 	
  -­‐	
  333,337
Suppliers	
  Payments 40,324,818 	
  -­‐	
  16,841,338 	
  -­‐	
  11,955,672 	
  -­‐	
  21,147,481
Other	
  Operating	
  Cash	
  Receipts	
  (Payments) 312,364 	
  -­‐	
  998,934 	
  -­‐	
  614,805 	
  -­‐	
  631,779
Income	
  Taxes	
  Paid 	
  -­‐	
  177,500 	
  -­‐	
  400,000 	
  -­‐	
  355,000 	
  -­‐	
  400,000
Interest	
  Payments 	
  -­‐	
  442,330 	
  -­‐	
  437,738 	
  -­‐	
  792,570 	
  -­‐	
  826,230
Net	
  Cash	
  Flows	
  from	
  Operating	
  Activities 15,728,542 	
  -­‐	
  19,511,342 	
  -­‐	
  14,384,714 	
  -­‐	
  23,338,827
Cash	
  Flows	
  from	
  Investing	
  activities
Capital	
  Expenditures 	
  -­‐	
  1,396,924 303,076 320,937 320,937
Net	
  Cash	
  Flows	
  from	
  Investing	
  Activities 	
  -­‐	
  1,396,924 303,076 320,937 320,937
Cash	
  Flows	
  from	
  Financing	
  activities
Proceeds	
  from	
  Capital	
  Increase 0 0 0 0
Increase	
  (Decrease)	
  in	
  Long-­‐Term	
  Liabilities 	
  -­‐	
  4,600,000 0 0 0
Dividends	
  Paid 0 0 0 0
Increase	
  (Decrease)	
  in	
  Shareholders'	
  loan 0 0 0 0
Increase	
  (Decrease)	
  in	
  Bank	
  Overdrafts 0 0 0 0
Increase	
  (Decrease)	
  in	
  Financed	
  L/Cs 0 0 0 0
Increase	
  (Decrease)	
  in	
  Secured	
  Borrowings 0 0 0 0
Net	
  Cash	
  Flows	
  from	
  Financing	
  Activities 	
  -­‐	
  4,600,000 0 0 0
Net	
  Increase	
  (Decrease)	
  In	
  Cash	
  Balance 9,731,617 	
  -­‐	
  19,208,266 	
  -­‐	
  14,063,777 	
  -­‐	
  23,017,891
Opening	
  cash	
  Balance 	
  -­‐	
  1,089,733 	
  -­‐	
  7,284,903 	
  -­‐	
  2,767,889 2,089,078
Ending	
  Cash	
  Balance 8,641,885 	
  -­‐	
  26,493,170 	
  -­‐	
  16,831,666 	
  -­‐	
  20,928,812
Cash Flow Statement (Direct Method)

More Related Content

What's hot

Muthengi mike bamburi financial model - enhancement
Muthengi mike   bamburi financial model - enhancementMuthengi mike   bamburi financial model - enhancement
Muthengi mike bamburi financial model - enhancement
Mike Muthengi
 
Example print out-efm-de
Example print out-efm-deExample print out-efm-de
Example print out-efm-de
Excel Financial Model
 
Basic Hotel Accounting Principles #4 Session by Dino Leonandri
Basic Hotel Accounting Principles  #4 Session by Dino LeonandriBasic Hotel Accounting Principles  #4 Session by Dino Leonandri
Basic Hotel Accounting Principles #4 Session by Dino Leonandri
DINOLEONANDRI
 
Consolidate december-2012
Consolidate december-2012Consolidate december-2012
Consolidate december-2012
Afridi Khy
 
wasif file
wasif filewasif file
wasif file
Abdul Wasif Khan
 
$ANF Valuation Model
$ANF Valuation Model$ANF Valuation Model
$ANF Valuation Model
Lindsay Meyer
 
THE GAP PRESENTATION
THE GAP PRESENTATIONTHE GAP PRESENTATION
THE GAP PRESENTATIONRicky Ying
 
M&A Advisory Firms jmfl
M&A Advisory Firms   jmflM&A Advisory Firms   jmfl
M&A Advisory Firms jmfl
rakeshsalunke201
 
bKash equity valuation 2018
bKash equity valuation 2018bKash equity valuation 2018
bKash equity valuation 2018
Faysal Ahmed Likhon
 
Financial ratios asian paints
Financial ratios   asian paintsFinancial ratios   asian paints
Financial ratios asian paintsSalil Nagvekar
 
Brph apresentação call 2 t14 (eng)
Brph apresentação call 2 t14 (eng)Brph apresentação call 2 t14 (eng)
Brph apresentação call 2 t14 (eng)
brpharma
 
Basic Hotel's Accounting Principles #12 Forecasting by Dino Leonandri
Basic Hotel's Accounting Principles  #12 Forecasting by Dino LeonandriBasic Hotel's Accounting Principles  #12 Forecasting by Dino Leonandri
Basic Hotel's Accounting Principles #12 Forecasting by Dino Leonandri
DINOLEONANDRI
 
Ceragon Financial Metrics Q1-2013
Ceragon Financial Metrics Q1-2013Ceragon Financial Metrics Q1-2013
Ceragon Financial Metrics Q1-2013Ceragon
 
Financial Statement Analysis - 2009 presentation
Financial Statement Analysis - 2009 presentationFinancial Statement Analysis - 2009 presentation
Financial Statement Analysis - 2009 presentation
Felix Yamasato
 
Brph apresentação call 4 t13 (eng)
Brph apresentação call 4 t13 (eng)Brph apresentação call 4 t13 (eng)
Brph apresentação call 4 t13 (eng)brpharma
 
Financial ratio analysis of sony and samsung
Financial ratio analysis of sony and samsungFinancial ratio analysis of sony and samsung
Financial ratio analysis of sony and samsung
AmbreenFareed
 

What's hot (16)

Muthengi mike bamburi financial model - enhancement
Muthengi mike   bamburi financial model - enhancementMuthengi mike   bamburi financial model - enhancement
Muthengi mike bamburi financial model - enhancement
 
Example print out-efm-de
Example print out-efm-deExample print out-efm-de
Example print out-efm-de
 
Basic Hotel Accounting Principles #4 Session by Dino Leonandri
Basic Hotel Accounting Principles  #4 Session by Dino LeonandriBasic Hotel Accounting Principles  #4 Session by Dino Leonandri
Basic Hotel Accounting Principles #4 Session by Dino Leonandri
 
Consolidate december-2012
Consolidate december-2012Consolidate december-2012
Consolidate december-2012
 
wasif file
wasif filewasif file
wasif file
 
$ANF Valuation Model
$ANF Valuation Model$ANF Valuation Model
$ANF Valuation Model
 
THE GAP PRESENTATION
THE GAP PRESENTATIONTHE GAP PRESENTATION
THE GAP PRESENTATION
 
M&A Advisory Firms jmfl
M&A Advisory Firms   jmflM&A Advisory Firms   jmfl
M&A Advisory Firms jmfl
 
bKash equity valuation 2018
bKash equity valuation 2018bKash equity valuation 2018
bKash equity valuation 2018
 
Financial ratios asian paints
Financial ratios   asian paintsFinancial ratios   asian paints
Financial ratios asian paints
 
Brph apresentação call 2 t14 (eng)
Brph apresentação call 2 t14 (eng)Brph apresentação call 2 t14 (eng)
Brph apresentação call 2 t14 (eng)
 
Basic Hotel's Accounting Principles #12 Forecasting by Dino Leonandri
Basic Hotel's Accounting Principles  #12 Forecasting by Dino LeonandriBasic Hotel's Accounting Principles  #12 Forecasting by Dino Leonandri
Basic Hotel's Accounting Principles #12 Forecasting by Dino Leonandri
 
Ceragon Financial Metrics Q1-2013
Ceragon Financial Metrics Q1-2013Ceragon Financial Metrics Q1-2013
Ceragon Financial Metrics Q1-2013
 
Financial Statement Analysis - 2009 presentation
Financial Statement Analysis - 2009 presentationFinancial Statement Analysis - 2009 presentation
Financial Statement Analysis - 2009 presentation
 
Brph apresentação call 4 t13 (eng)
Brph apresentação call 4 t13 (eng)Brph apresentação call 4 t13 (eng)
Brph apresentação call 4 t13 (eng)
 
Financial ratio analysis of sony and samsung
Financial ratio analysis of sony and samsungFinancial ratio analysis of sony and samsung
Financial ratio analysis of sony and samsung
 

Similar to Work sample

Neslte India Ltd_Financial Model Working.pdf
Neslte India Ltd_Financial Model Working.pdfNeslte India Ltd_Financial Model Working.pdf
Neslte India Ltd_Financial Model Working.pdf
DeepakKumar234566
 
AT&TFinancial and Operational Results
AT&TFinancial and Operational ResultsAT&TFinancial and Operational Results
AT&TFinancial and Operational Resultsfinance1
 
AT&T Financial and Operational Results
AT&T Financial and Operational ResultsAT&T Financial and Operational Results
AT&T Financial and Operational Resultsfinance1
 
UAC annual report 2017
UAC annual report 2017UAC annual report 2017
UAC annual report 2017
Michael Olafusi
 
Apresentação 1T06
Apresentação 1T06Apresentação 1T06
Apresentação 1T06
RiRossi
 
Williams sonoma model
Williams sonoma model Williams sonoma model
Williams sonoma model
Trishala Rasya
 
Guaranty Trust Bank financial report 2009
Guaranty Trust Bank financial report 2009Guaranty Trust Bank financial report 2009
Guaranty Trust Bank financial report 2009
Michael Olafusi
 
Ssgc final report (29 04-2014)
Ssgc final report (29 04-2014)Ssgc final report (29 04-2014)
Ssgc final report (29 04-2014)
Iqra University Karachi, Pakistan
 
INVESTAURA_Business-Planning-Template.pdf
INVESTAURA_Business-Planning-Template.pdfINVESTAURA_Business-Planning-Template.pdf
INVESTAURA_Business-Planning-Template.pdf
Gina Davidovic - PMP, PgMP, RMP, PMI-ACP
 
Nordnet's report presentation, January-September 2015
Nordnet's report presentation, January-September 2015Nordnet's report presentation, January-September 2015
Nordnet's report presentation, January-September 2015
Nordnet
 
Abengoa's 2014 economic and financial report
Abengoa's 2014 economic and financial reportAbengoa's 2014 economic and financial report
Abengoa's 2014 economic and financial report
Abengoa
 
1 Front Page 2 Memo TO.docx
1  Front Page 2  Memo TO.docx1  Front Page 2  Memo TO.docx
1 Front Page 2 Memo TO.docx
karisariddell
 
Balance SheetThe Procter & Gamble CompanyAnnual Balance Sheet (yea.docx
Balance SheetThe Procter & Gamble CompanyAnnual Balance Sheet (yea.docxBalance SheetThe Procter & Gamble CompanyAnnual Balance Sheet (yea.docx
Balance SheetThe Procter & Gamble CompanyAnnual Balance Sheet (yea.docx
ikirkton
 
Project_Valuation.ppsx
Project_Valuation.ppsxProject_Valuation.ppsx
Project_Valuation.ppsx
Matteo Marcantognini Palacios
 
NFLX-model.pdf
NFLX-model.pdfNFLX-model.pdf
NFLX-model.pdf
ShankarSanyal2
 
Example Presentation Of Financial Reports PowerPoint Presentation Slides
Example Presentation Of Financial Reports PowerPoint Presentation Slides Example Presentation Of Financial Reports PowerPoint Presentation Slides
Example Presentation Of Financial Reports PowerPoint Presentation Slides
SlideTeam
 
2015 Financial Report
2015 Financial Report2015 Financial Report
2015 Financial Report
BANCO SANTANDER
 
InKnowVision June 2012 HNW Technical Webinar 2 - Valuation Planning
InKnowVision June 2012 HNW Technical Webinar 2 - Valuation PlanningInKnowVision June 2012 HNW Technical Webinar 2 - Valuation Planning
InKnowVision June 2012 HNW Technical Webinar 2 - Valuation Planning
InKnowVision
 

Similar to Work sample (20)

Neslte India Ltd_Financial Model Working.pdf
Neslte India Ltd_Financial Model Working.pdfNeslte India Ltd_Financial Model Working.pdf
Neslte India Ltd_Financial Model Working.pdf
 
AT&TFinancial and Operational Results
AT&TFinancial and Operational ResultsAT&TFinancial and Operational Results
AT&TFinancial and Operational Results
 
AT&T Financial and Operational Results
AT&T Financial and Operational ResultsAT&T Financial and Operational Results
AT&T Financial and Operational Results
 
Finance present
Finance presentFinance present
Finance present
 
UAC annual report 2017
UAC annual report 2017UAC annual report 2017
UAC annual report 2017
 
Apresentação 1T06
Apresentação 1T06Apresentação 1T06
Apresentação 1T06
 
Williams sonoma model
Williams sonoma model Williams sonoma model
Williams sonoma model
 
Guaranty Trust Bank financial report 2009
Guaranty Trust Bank financial report 2009Guaranty Trust Bank financial report 2009
Guaranty Trust Bank financial report 2009
 
Ssgc final report (29 04-2014)
Ssgc final report (29 04-2014)Ssgc final report (29 04-2014)
Ssgc final report (29 04-2014)
 
INVESTAURA_Business-Planning-Template.pdf
INVESTAURA_Business-Planning-Template.pdfINVESTAURA_Business-Planning-Template.pdf
INVESTAURA_Business-Planning-Template.pdf
 
Nordnet's report presentation, January-September 2015
Nordnet's report presentation, January-September 2015Nordnet's report presentation, January-September 2015
Nordnet's report presentation, January-September 2015
 
Abengoa's 2014 economic and financial report
Abengoa's 2014 economic and financial reportAbengoa's 2014 economic and financial report
Abengoa's 2014 economic and financial report
 
1 Front Page 2 Memo TO.docx
1  Front Page 2  Memo TO.docx1  Front Page 2  Memo TO.docx
1 Front Page 2 Memo TO.docx
 
Balance SheetThe Procter & Gamble CompanyAnnual Balance Sheet (yea.docx
Balance SheetThe Procter & Gamble CompanyAnnual Balance Sheet (yea.docxBalance SheetThe Procter & Gamble CompanyAnnual Balance Sheet (yea.docx
Balance SheetThe Procter & Gamble CompanyAnnual Balance Sheet (yea.docx
 
Security analysis
Security analysisSecurity analysis
Security analysis
 
Project_Valuation.ppsx
Project_Valuation.ppsxProject_Valuation.ppsx
Project_Valuation.ppsx
 
NFLX-model.pdf
NFLX-model.pdfNFLX-model.pdf
NFLX-model.pdf
 
Example Presentation Of Financial Reports PowerPoint Presentation Slides
Example Presentation Of Financial Reports PowerPoint Presentation Slides Example Presentation Of Financial Reports PowerPoint Presentation Slides
Example Presentation Of Financial Reports PowerPoint Presentation Slides
 
2015 Financial Report
2015 Financial Report2015 Financial Report
2015 Financial Report
 
InKnowVision June 2012 HNW Technical Webinar 2 - Valuation Planning
InKnowVision June 2012 HNW Technical Webinar 2 - Valuation PlanningInKnowVision June 2012 HNW Technical Webinar 2 - Valuation Planning
InKnowVision June 2012 HNW Technical Webinar 2 - Valuation Planning
 

Recently uploaded

Filing Your Delaware Franchise Tax A Detailed Guide
Filing Your Delaware Franchise Tax A Detailed GuideFiling Your Delaware Franchise Tax A Detailed Guide
Filing Your Delaware Franchise Tax A Detailed Guide
YourLegal Accounting
 
Accpac to QuickBooks Conversion Navigating the Transition with Online Account...
Accpac to QuickBooks Conversion Navigating the Transition with Online Account...Accpac to QuickBooks Conversion Navigating the Transition with Online Account...
Accpac to QuickBooks Conversion Navigating the Transition with Online Account...
PaulBryant58
 
Role of Remote Sensing and Monitoring in Mining
Role of Remote Sensing and Monitoring in MiningRole of Remote Sensing and Monitoring in Mining
Role of Remote Sensing and Monitoring in Mining
Naaraayani Minerals Pvt.Ltd
 
RMD24 | Debunking the non-endemic revenue myth Marvin Vacquier Droop | First ...
RMD24 | Debunking the non-endemic revenue myth Marvin Vacquier Droop | First ...RMD24 | Debunking the non-endemic revenue myth Marvin Vacquier Droop | First ...
RMD24 | Debunking the non-endemic revenue myth Marvin Vacquier Droop | First ...
BBPMedia1
 
3.0 Project 2_ Developing My Brand Identity Kit.pptx
3.0 Project 2_ Developing My Brand Identity Kit.pptx3.0 Project 2_ Developing My Brand Identity Kit.pptx
3.0 Project 2_ Developing My Brand Identity Kit.pptx
tanyjahb
 
RMD24 | Retail media: hoe zet je dit in als je geen AH of Unilever bent? Heid...
RMD24 | Retail media: hoe zet je dit in als je geen AH of Unilever bent? Heid...RMD24 | Retail media: hoe zet je dit in als je geen AH of Unilever bent? Heid...
RMD24 | Retail media: hoe zet je dit in als je geen AH of Unilever bent? Heid...
BBPMedia1
 
Brand Analysis for an artist named Struan
Brand Analysis for an artist named StruanBrand Analysis for an artist named Struan
Brand Analysis for an artist named Struan
sarahvanessa51503
 
Search Disrupted Google’s Leaked Documents Rock the SEO World.pdf
Search Disrupted Google’s Leaked Documents Rock the SEO World.pdfSearch Disrupted Google’s Leaked Documents Rock the SEO World.pdf
Search Disrupted Google’s Leaked Documents Rock the SEO World.pdf
Arihant Webtech Pvt. Ltd
 
Business Valuation Principles for Entrepreneurs
Business Valuation Principles for EntrepreneursBusiness Valuation Principles for Entrepreneurs
Business Valuation Principles for Entrepreneurs
Ben Wann
 
Project File Report BBA 6th semester.pdf
Project File Report BBA 6th semester.pdfProject File Report BBA 6th semester.pdf
Project File Report BBA 6th semester.pdf
RajPriye
 
Cree_Rey_BrandIdentityKit.PDF_PersonalBd
Cree_Rey_BrandIdentityKit.PDF_PersonalBdCree_Rey_BrandIdentityKit.PDF_PersonalBd
Cree_Rey_BrandIdentityKit.PDF_PersonalBd
creerey
 
一比一原版加拿大渥太华大学毕业证(uottawa毕业证书)如何办理
一比一原版加拿大渥太华大学毕业证(uottawa毕业证书)如何办理一比一原版加拿大渥太华大学毕业证(uottawa毕业证书)如何办理
一比一原版加拿大渥太华大学毕业证(uottawa毕业证书)如何办理
taqyed
 
BeMetals Presentation_May_22_2024 .pdf
BeMetals Presentation_May_22_2024   .pdfBeMetals Presentation_May_22_2024   .pdf
BeMetals Presentation_May_22_2024 .pdf
DerekIwanaka1
 
Attending a job Interview for B1 and B2 Englsih learners
Attending a job Interview for B1 and B2 Englsih learnersAttending a job Interview for B1 and B2 Englsih learners
Attending a job Interview for B1 and B2 Englsih learners
Erika906060
 
FINAL PRESENTATION.pptx12143241324134134
FINAL PRESENTATION.pptx12143241324134134FINAL PRESENTATION.pptx12143241324134134
FINAL PRESENTATION.pptx12143241324134134
LR1709MUSIC
 
Sustainability: Balancing the Environment, Equity & Economy
Sustainability: Balancing the Environment, Equity & EconomySustainability: Balancing the Environment, Equity & Economy
Sustainability: Balancing the Environment, Equity & Economy
Operational Excellence Consulting
 
India Orthopedic Devices Market: Unlocking Growth Secrets, Trends and Develop...
India Orthopedic Devices Market: Unlocking Growth Secrets, Trends and Develop...India Orthopedic Devices Market: Unlocking Growth Secrets, Trends and Develop...
India Orthopedic Devices Market: Unlocking Growth Secrets, Trends and Develop...
Kumar Satyam
 
Affordable Stationery Printing Services in Jaipur | Navpack n Print
Affordable Stationery Printing Services in Jaipur | Navpack n PrintAffordable Stationery Printing Services in Jaipur | Navpack n Print
Affordable Stationery Printing Services in Jaipur | Navpack n Print
Navpack & Print
 
falcon-invoice-discounting-a-premier-platform-for-investors-in-india
falcon-invoice-discounting-a-premier-platform-for-investors-in-indiafalcon-invoice-discounting-a-premier-platform-for-investors-in-india
falcon-invoice-discounting-a-premier-platform-for-investors-in-india
Falcon Invoice Discounting
 
PriyoShop Celebration Pohela Falgun Mar 20, 2024
PriyoShop Celebration Pohela Falgun Mar 20, 2024PriyoShop Celebration Pohela Falgun Mar 20, 2024
PriyoShop Celebration Pohela Falgun Mar 20, 2024
PriyoShop.com LTD
 

Recently uploaded (20)

Filing Your Delaware Franchise Tax A Detailed Guide
Filing Your Delaware Franchise Tax A Detailed GuideFiling Your Delaware Franchise Tax A Detailed Guide
Filing Your Delaware Franchise Tax A Detailed Guide
 
Accpac to QuickBooks Conversion Navigating the Transition with Online Account...
Accpac to QuickBooks Conversion Navigating the Transition with Online Account...Accpac to QuickBooks Conversion Navigating the Transition with Online Account...
Accpac to QuickBooks Conversion Navigating the Transition with Online Account...
 
Role of Remote Sensing and Monitoring in Mining
Role of Remote Sensing and Monitoring in MiningRole of Remote Sensing and Monitoring in Mining
Role of Remote Sensing and Monitoring in Mining
 
RMD24 | Debunking the non-endemic revenue myth Marvin Vacquier Droop | First ...
RMD24 | Debunking the non-endemic revenue myth Marvin Vacquier Droop | First ...RMD24 | Debunking the non-endemic revenue myth Marvin Vacquier Droop | First ...
RMD24 | Debunking the non-endemic revenue myth Marvin Vacquier Droop | First ...
 
3.0 Project 2_ Developing My Brand Identity Kit.pptx
3.0 Project 2_ Developing My Brand Identity Kit.pptx3.0 Project 2_ Developing My Brand Identity Kit.pptx
3.0 Project 2_ Developing My Brand Identity Kit.pptx
 
RMD24 | Retail media: hoe zet je dit in als je geen AH of Unilever bent? Heid...
RMD24 | Retail media: hoe zet je dit in als je geen AH of Unilever bent? Heid...RMD24 | Retail media: hoe zet je dit in als je geen AH of Unilever bent? Heid...
RMD24 | Retail media: hoe zet je dit in als je geen AH of Unilever bent? Heid...
 
Brand Analysis for an artist named Struan
Brand Analysis for an artist named StruanBrand Analysis for an artist named Struan
Brand Analysis for an artist named Struan
 
Search Disrupted Google’s Leaked Documents Rock the SEO World.pdf
Search Disrupted Google’s Leaked Documents Rock the SEO World.pdfSearch Disrupted Google’s Leaked Documents Rock the SEO World.pdf
Search Disrupted Google’s Leaked Documents Rock the SEO World.pdf
 
Business Valuation Principles for Entrepreneurs
Business Valuation Principles for EntrepreneursBusiness Valuation Principles for Entrepreneurs
Business Valuation Principles for Entrepreneurs
 
Project File Report BBA 6th semester.pdf
Project File Report BBA 6th semester.pdfProject File Report BBA 6th semester.pdf
Project File Report BBA 6th semester.pdf
 
Cree_Rey_BrandIdentityKit.PDF_PersonalBd
Cree_Rey_BrandIdentityKit.PDF_PersonalBdCree_Rey_BrandIdentityKit.PDF_PersonalBd
Cree_Rey_BrandIdentityKit.PDF_PersonalBd
 
一比一原版加拿大渥太华大学毕业证(uottawa毕业证书)如何办理
一比一原版加拿大渥太华大学毕业证(uottawa毕业证书)如何办理一比一原版加拿大渥太华大学毕业证(uottawa毕业证书)如何办理
一比一原版加拿大渥太华大学毕业证(uottawa毕业证书)如何办理
 
BeMetals Presentation_May_22_2024 .pdf
BeMetals Presentation_May_22_2024   .pdfBeMetals Presentation_May_22_2024   .pdf
BeMetals Presentation_May_22_2024 .pdf
 
Attending a job Interview for B1 and B2 Englsih learners
Attending a job Interview for B1 and B2 Englsih learnersAttending a job Interview for B1 and B2 Englsih learners
Attending a job Interview for B1 and B2 Englsih learners
 
FINAL PRESENTATION.pptx12143241324134134
FINAL PRESENTATION.pptx12143241324134134FINAL PRESENTATION.pptx12143241324134134
FINAL PRESENTATION.pptx12143241324134134
 
Sustainability: Balancing the Environment, Equity & Economy
Sustainability: Balancing the Environment, Equity & EconomySustainability: Balancing the Environment, Equity & Economy
Sustainability: Balancing the Environment, Equity & Economy
 
India Orthopedic Devices Market: Unlocking Growth Secrets, Trends and Develop...
India Orthopedic Devices Market: Unlocking Growth Secrets, Trends and Develop...India Orthopedic Devices Market: Unlocking Growth Secrets, Trends and Develop...
India Orthopedic Devices Market: Unlocking Growth Secrets, Trends and Develop...
 
Affordable Stationery Printing Services in Jaipur | Navpack n Print
Affordable Stationery Printing Services in Jaipur | Navpack n PrintAffordable Stationery Printing Services in Jaipur | Navpack n Print
Affordable Stationery Printing Services in Jaipur | Navpack n Print
 
falcon-invoice-discounting-a-premier-platform-for-investors-in-india
falcon-invoice-discounting-a-premier-platform-for-investors-in-indiafalcon-invoice-discounting-a-premier-platform-for-investors-in-india
falcon-invoice-discounting-a-premier-platform-for-investors-in-india
 
PriyoShop Celebration Pohela Falgun Mar 20, 2024
PriyoShop Celebration Pohela Falgun Mar 20, 2024PriyoShop Celebration Pohela Falgun Mar 20, 2024
PriyoShop Celebration Pohela Falgun Mar 20, 2024
 

Work sample

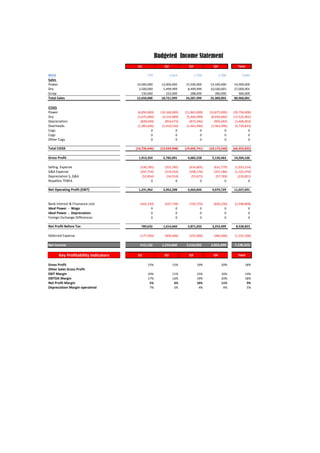
  • 1. Q1 Q2 Q3 Q4 Total MVA 770 1,414 1,756 1,706 5,645 Sales   Power 10,000,000 13,000,000 15,500,000 14,500,000 53,000,000 Dry 2,500,000 5,499,999 8,499,999 10,500,003 27,000,001 Scrap 150,000 222,000 288,000 300,000 960,000 Total  Sales 12,650,000 18,721,999 24,287,999 25,300,003 80,960,001 COGS Power (6,850,000) (10,160,000) (11,865,000) (10,875,000) (39,750,000) Dry (1,675,000) (3,514,999) (5,404,999) (6,930,002) (17,525,001) Depreciation   (828,040) (854,673) (872,246) (905,042) (3,460,002) Overheads (1,383,606) (1,410,236) (1,463,496) (1,463,496) (5,720,833) Cogs 0 0 0 0 0 Cogs 0 0 0 0 0 Other  Cogs 0 0 0 0 0 Total  COGS (10,736,646) (15,939,908) (19,605,741) (20,173,540) (66,455,835) Gross  Profit 1,913,354 2,782,091 4,682,258 5,126,463 14,504,166 Selling    Expense (330,785) (355,785) (614,805) (631,779) (1,933,154) G&A  Expense (297,754) (319,354) (348,176) (357,186) (1,322,470) Depreciation  S,  G&A   (52,854) (54,554) (55,675) (57,769) (220,851) Royalites  TEBEA 0 0 0 0 0 Net  Operating  Profit  (EBIT) 1,231,962 2,052,398 3,663,602 4,079,729 11,027,691 Bank  Interest  &  Finanance  cost   (442,330) (437,738) (792,570) (826,230) (2,498,868) Ideal  Power    -­‐    Wage 0 0 0 0 0 Ideal  Power    -­‐    Depreciation 0 0 0 0 0 Foreign  Exchange  Differences 0 0 0 0 0 Net  Profit  Before  Tax 789,632 1,614,660 2,871,032 3,253,499 8,528,823 Deferred  Expense (177,500) (400,000) (355,000) (400,000) (1,332,500) Net  Income   612,132 1,214,660 2,516,032 2,853,499 7,196,323 Key  Profitability  Indicators Q1 Q2 Q3 Q4 Total Gross  Profit 15% 15% 19% 20% 18% Other  Sales  Gross  Profit EBIT  Margin 10% 11% 15% 16% 14% EBITDA  Margin 17% 16% 19% 20% 18% Net  Profit  Margin 5% 6% 10% 11% 9% Depreciation  Margin  operatinal 7% 5% 4% 4% 5% Budgeted Income Statement
  • 2. USD Q1 Q2 Q3 Q4 Assets Cash  -­‐  6,098,740  -­‐  5,952,764 129,592 3,038,623  Receivables   15,617,390 16,450,723 17,117,389 17,450,726 Finished  Goods  Inventory 0 0 0 0 Work  In  Progress  Inventory 0 0 0 0 Raw  Materials  Inventory 17,891,812 20,866,479 22,611,312 24,391,813 Goods  in  Transit  &  Others 0 0 0 0 Total  Inventory 17,891,812 20,866,479 22,611,312 24,391,813 Dues  from  Related  Parties   8,671,420 8,671,420 8,671,420 8,671,420 Other  Debit  Balances 0 0 0 0 Other  Current  Assets 0 0 0 0 Total  Current  Assets 36,081,882 40,035,858 48,529,714 53,552,582 Net  Plant  Property  &  Equipment 42,040,199 41,130,972 40,303,051 39,340,240 Total  Long-­‐Term  Assets 42,040,199 41,130,972 40,303,051 39,340,240 Total  Assets 78,122,081 81,166,830 88,832,764 92,892,822 Liabilities Bank  Overdrafts 0 0 0 0 Importation  Finance  (L/Cs) 0 0 0 0 Secured  Borrowings  (with  Recourse) 0 0 0 0 Total  Short-­‐term  Facilities 0 0 0 0 Current  Portion  of  Long-­‐Term  Debt 0 0 0 0 Accounts  &  Notes  Payable  -­‐  5,620,879  -­‐  3,547,642 5,847,261 6,653,820 Dues  to  Related  Parties  (Specific) 0 0 0 0 0 0 0 0 0 Dues  to  Related  Parties   74,574,155 74,574,155 74,574,155 74,574,155 Other  Current  Liabilities 643,149 0 0 0 Total  Current  Liabilities 69,596,425 71,026,513 80,421,416 81,227,975 Medium-­‐term  Loans Long-­‐Term  Payables 4,600,000 4,600,000 0 0 Total  Long-­‐Term  Liabilities 4,600,000 4,600,000 0 0 Total  Liabilities 74,196,425 75,626,513 80,421,416 81,227,975 Equity Common  Stock Retained  Earning  "Opening" 3,522,860 4,579,283 6,653,684 9,380,889 Add:    Net  Profit 225,297 383,533 825,164 951,459 Less:    Dividends 0 0 0 0 Retained  Earning  "Ending" 3,748,157 4,962,817 7,478,848 10,332,348 Shareholders'  loan 0 0 0 0 Total  Equity 3,748,157 4,962,817 7,478,848 10,332,348 0 0 0 0 0 Balance Sheet
  • 3. USD Q1 Q2 Q3 Q4 Cash  Flows  from  Operating  Activities Net  Income 225,297 383,533 825,164 951,459 Tax  Expense 59,167 133,333 118,333 133,333 Depreciation 0 0 0 0 Forex  Differences 0 0 0 0 Adjusted  Net  income 284,464 516,867 943,497 1,084,792 Decrease  (Increase)  in  Inventory  Balances 1,548,333  -­‐  1,151,333  -­‐  593,500  -­‐  593,500 Increase  (Decrease)  in  Receivables      and  Other   Debit  Balances 5,533,332  -­‐  0 0  -­‐  3 Increase  (Decrease)  in  Payables  and          Other  Credit  Balances  -­‐  6,437,380 1,530,197 2,108,213 3,986 Net  Cash  Flows  from  Operating  Activities 928,750 895,731 2,458,211 495,275 Cash  Flows  from  Investing  activities Capital  Expenditures  -­‐  1,396,924 303,076 320,937 320,937 Capitalized  Interest 0 0 0 0 Net  Cash  Flows  from  Investing  Activities  -­‐  1,396,924 303,076 320,937 320,937 Cash  Flows  from  Financing  activities Proceeds  from  Capital  Increase 0 0 0 0 Increase  (Decrease)  in  Long-­‐Term  Liabilities  -­‐  4,600,000 0 0 0 Dividends  Paid 0 0 0 0 Increase  (Decrease)  in  Shareholders'  loan 0 0 0 0 Increase  (Decrease)  in  Bank  Overdrafts 0 0 0 0 Increase  (Decrease)  in  Financed  L/Cs 0 0 0 0 Increase  (Decrease)  in  Secured  Borrowings 0 0 0 0 0 0 0 0 Net  Cash  Flows  from  Financing  Activities  -­‐  4,600,000 0 0 0 Net  Increase  (Decrease)  In  Cash  Balance  -­‐  5,068,174 1,198,806 2,779,148 816,212 Opening  cash  Balance  -­‐  1,089,733  -­‐  7,284,903  -­‐  2,767,889 2,089,078 Ending  Cash  Balance (6,157,907)                         (6,086,097)               11,259                             2,905,290                 USD Q1 Q2 Q3 Q4 Cash  Flows  from  Operating  Activities 928,750 895,731 2,458,211 495,275 Cash  Flows  from  Investing  activities  -­‐  1,396,924 303,076 320,937 320,937 Cash  Flows  from  Financing  activities  -­‐  4,600,000 0 0 0 Net  Increase  (Decrease)  In  Cash  Balance  -­‐  5,068,174 1,198,806 2,779,148 816,212 Ending  Cash  Balance (6,157,907)                         (6,086,097)               11,259                             2,905,290                 0 0 0 0 Projected Cash Flow Summarized Cash Flow Statement (Indirect Method)
  • 4. USD Q1 Q2 Q3 Q4 Short-­‐Term  Bank  Facilities 0 0 0 0 Spontaneous  Financing 69,596,425 71,026,513 80,421,416 81,227,975 0 Long-­‐Term  Bank  Debt  &  Equivelants 4,600,000 4,600,000 0 0 0 Equity  &  Shareholders'  loan 3,748,157 4,962,817 7,478,848 10,332,348 Total 77,944,581 80,589,330 87,900,264 91,560,322  -­‐  177,500.00  -­‐  577,500.00  -­‐  932,500.00  -­‐  1,332,500.00 USD Q1 Q2 Q3 Q4 Long-­‐Term  Assets 42,040,199 41,130,972 40,303,051 39,340,240 Net  Operating  Working  Capital  -­‐  33,514,542  -­‐  30,990,655  -­‐  31,891,702  -­‐  27,675,393 Total  Bank  Debt 4,600,000 4,600,000 0 0 Equity  &  Shareholders'  loan 3,748,157 4,962,817 7,478,848 10,332,348 Net  Investment 33,600,459 27,511,220 19,945,105 28,142,667 Item Dupoint Formula Q1 Q2 Q3 Q4 RETURN  ON  SALES 4.84% 6.49% 10.36% 11.28% TOTAL  ASSET  TURNOVER 0.49 0.69 0.82 0.82 RETURN  ON  ASSETS 2.35% 4.49% 8.50% 9.22% ASSET  LEVERAGE 20.84 16.35 11.88 8.99 RETURN  ON  EQUITY 49% 73% 101% 83% Item Q1 Q2 Q3 Q4 Profitability Sales  Growth N/A 48.0% 29.7% 4.2% COGS  /  Sales 84.9% 85.1% 80.7% 79.7% Gross  Profit  Margin 15.1% 14.9% 19.3% 20.3% S  G&A  /  Sales 2.6% 1.9% 2.5% 2.5% Interest  /  Sales 3.5% 2.3% 3.3% 3.3% FX  Loss  /  Sales 0.0% 0.0% 0.0% 0.0% EBITDA  Margin 9.7% 11.0% 15.1% 16.1% Net  Operating  Profit  Margin 9.7% 11.0% 15.1% 16.1% NPBT  /  Sales 6.2% 8.6% 11.8% 12.9% Profit  margin 4.8% 6.5% 10.4% 11.3% Net  Profit  Growth N/A 98% 107% 13% Item Q1 Q2 Q3 Q4 Asset Efficiency & Turnover Net  Investment            USD 33,600,459                             27,511,220                 19,945,105                 28,142,667                 Fixed  Assets  Turnover 0.90                                                     1.37                                           1.81                                           1.93                                           Working  Capital  Turnover 1.05                                                     1.40                                           1.50                                           1.42                                           Financial Highlights' Financial Structure Financial Structure
  • 5. Item Q1 Q2 Q3 Q4 Business Cycles Net  Cash  to  Cash  Cycle N/A N/A N/A N/A Total  Receivables  Days  on  Hands 86 119 94 369 Third  Party  Receivables  Days  on  Hand 111 77 62 246 Affiliates  Receivables  Days  On  Hand 31 42 96 123 Inventory  Days  On  Hand 150 109 299 419 RM  Days  On  Hand 150 109 299 419 WIP  Days  On  Hand N/A N/A N/A N/A FG  Days  On  Hand N/A N/A N/A N/A GIT  &  Others    Days  On  Hand N/A N/A N/A N/A Other  Current  Assets  Days  On  Hand N/A N/A N/A N/A Total  Payables  Days  on  Hands 289 395 1,043 1,442 Third  Party  payables  Days  on  Hand -­‐47   -­‐26   16 112 Affiliates  payables  Days  On  Hand 313 421 1,027 1,331 Other  Current  Liabilities  Days  On  Hand 5 2 N/A N/A Item Q1 Q2 Q3 Q4 LIQUIDITY Cash  Ratio 0.088-­‐                                                 0.08-­‐                                           0.00                                           0.04                                           Current  Ratio 0.5                                                         0.6                                               0.6                                               0.7                                               Quick  Ratio 0.3                                                         0.3                                               0.3                                               0.4                                               EBITDA                  USD 14,783,541 24,628,775 43,963,221 48,956,749 Net  Working  Capital          USD -­‐33,514,542   -­‐30,990,655   -­‐31,891,702   -­‐27,675,393   Item Q1 Q2 Q3 Q4 LEVERAGE & CAPITAL STRUCTURE Financial  Leverage  20.8    16.4    11.9    9.0   Gearing  (Bank  Debt/Equity)  1.2    0.9    0.0    0.0   Current  Lab.  /  Total  Assets 89% 88% 91% 87% Total  Bank  Debt  /  EBITDA  0.3    0.2    0.0    0.0   Operating  Cash  Flows  /  Interest  2.1    2.0    3.1    0.6   Operating  Cash  Flows  /  Bank  Debt  2.4    2.3   N/A N/A Times  Interest  Covered  (Per  EBIT)  2.8    4.7    4.6    4.9   Fixed  Charge  Coverage  (Per  EBIT)  2.8    4.7    4.6    4.9   USD Q1 Q2 Q3 Q4 Total Cash  Flows  from  Operating  Activities Net  Cash  Collections  from  Sales  -­‐  24,288,810  -­‐  833,332  -­‐  666,667  -­‐  333,337 Suppliers  Payments 40,324,818  -­‐  16,841,338  -­‐  11,955,672  -­‐  21,147,481 Other  Operating  Cash  Receipts  (Payments) 312,364  -­‐  998,934  -­‐  614,805  -­‐  631,779 Income  Taxes  Paid  -­‐  177,500  -­‐  400,000  -­‐  355,000  -­‐  400,000 Interest  Payments  -­‐  442,330  -­‐  437,738  -­‐  792,570  -­‐  826,230 Net  Cash  Flows  from  Operating  Activities 15,728,542  -­‐  19,511,342  -­‐  14,384,714  -­‐  23,338,827 Cash  Flows  from  Investing  activities Capital  Expenditures  -­‐  1,396,924 303,076 320,937 320,937 Net  Cash  Flows  from  Investing  Activities  -­‐  1,396,924 303,076 320,937 320,937 Cash  Flows  from  Financing  activities Proceeds  from  Capital  Increase 0 0 0 0 Increase  (Decrease)  in  Long-­‐Term  Liabilities  -­‐  4,600,000 0 0 0 Dividends  Paid 0 0 0 0 Increase  (Decrease)  in  Shareholders'  loan 0 0 0 0 Increase  (Decrease)  in  Bank  Overdrafts 0 0 0 0 Increase  (Decrease)  in  Financed  L/Cs 0 0 0 0 Increase  (Decrease)  in  Secured  Borrowings 0 0 0 0 Net  Cash  Flows  from  Financing  Activities  -­‐  4,600,000 0 0 0 Net  Increase  (Decrease)  In  Cash  Balance 9,731,617  -­‐  19,208,266  -­‐  14,063,777  -­‐  23,017,891 Opening  cash  Balance  -­‐  1,089,733  -­‐  7,284,903  -­‐  2,767,889 2,089,078 Ending  Cash  Balance 8,641,885  -­‐  26,493,170  -­‐  16,831,666  -­‐  20,928,812 Cash Flow Statement (Direct Method)