Downloaded 176 times

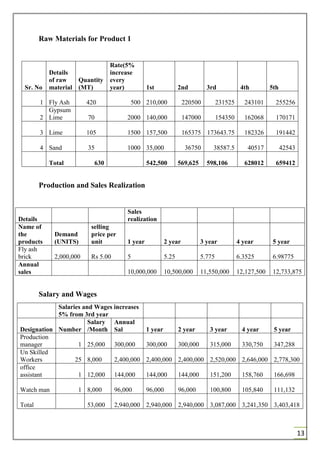
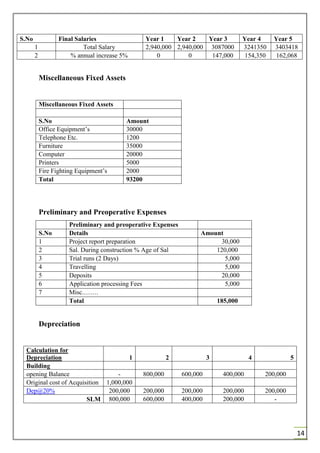
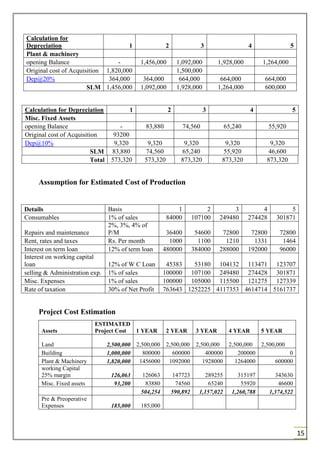
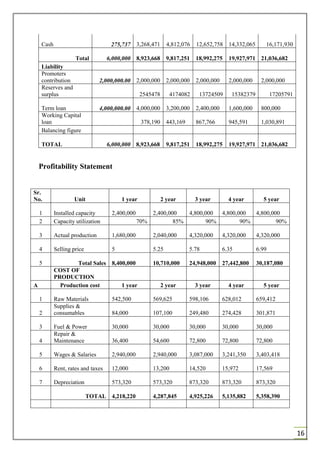

The document discusses establishing a fly ash brick manufacturing business. It notes the high demand for bricks in India and environmental issues with traditional clay brick production. Fly ash bricks are a more sustainable alternative that utilize waste ash from thermal power plants. The summary provides an overview of the market opportunity, production process, equipment needs, and financial feasibility analysis conducted for the proposed business.


