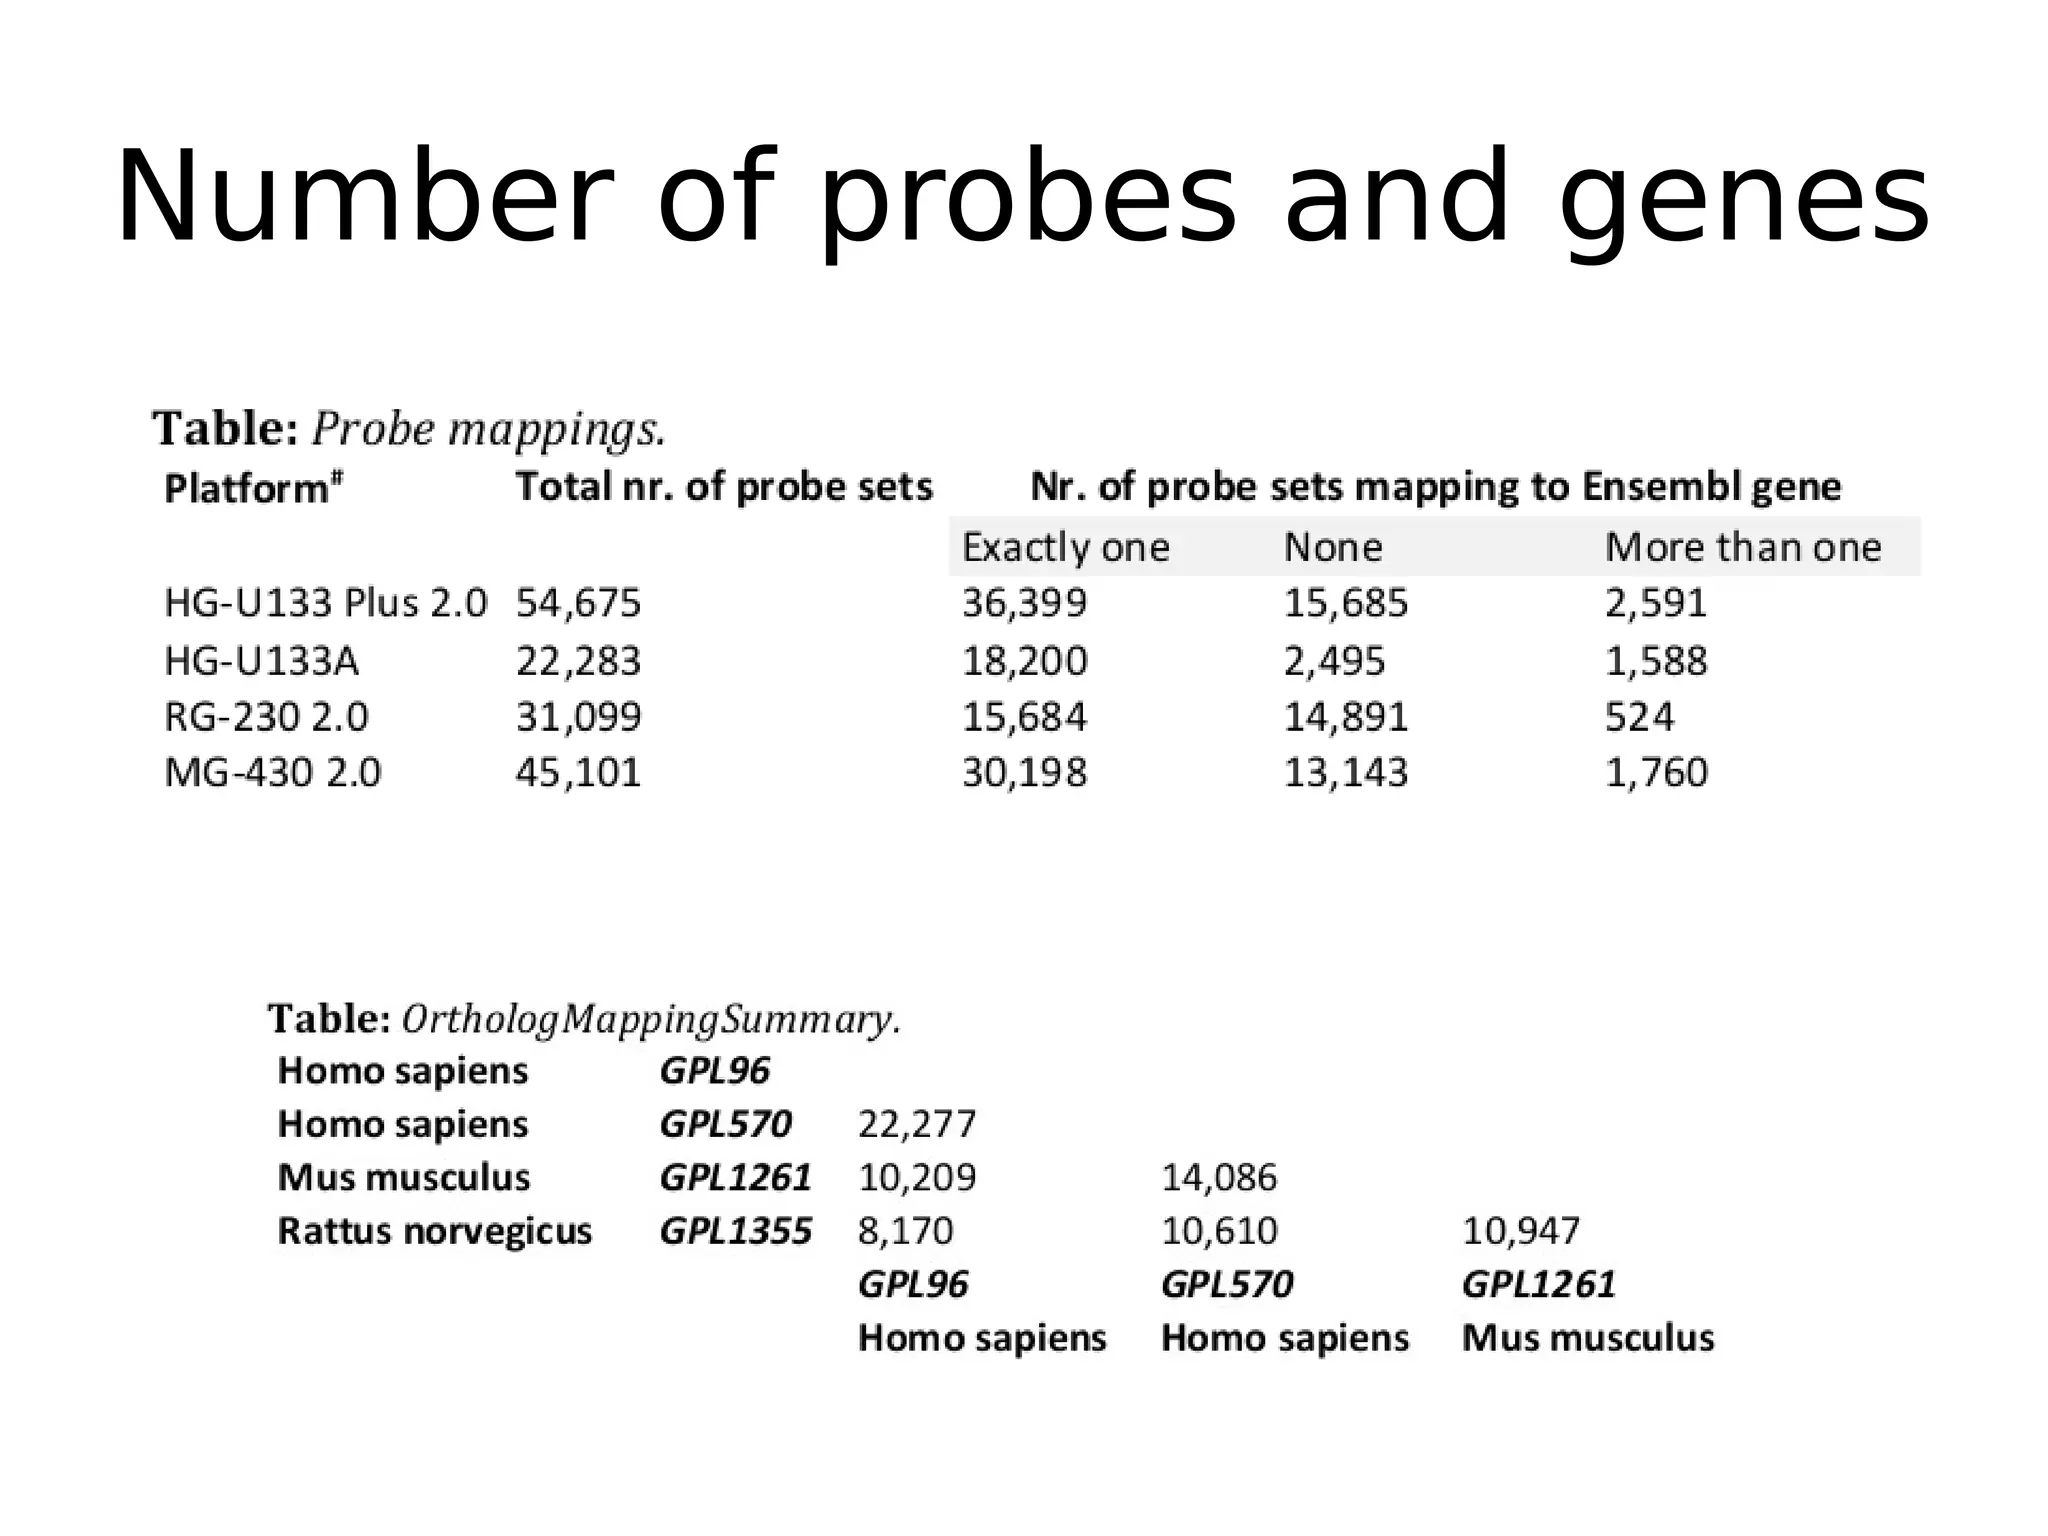
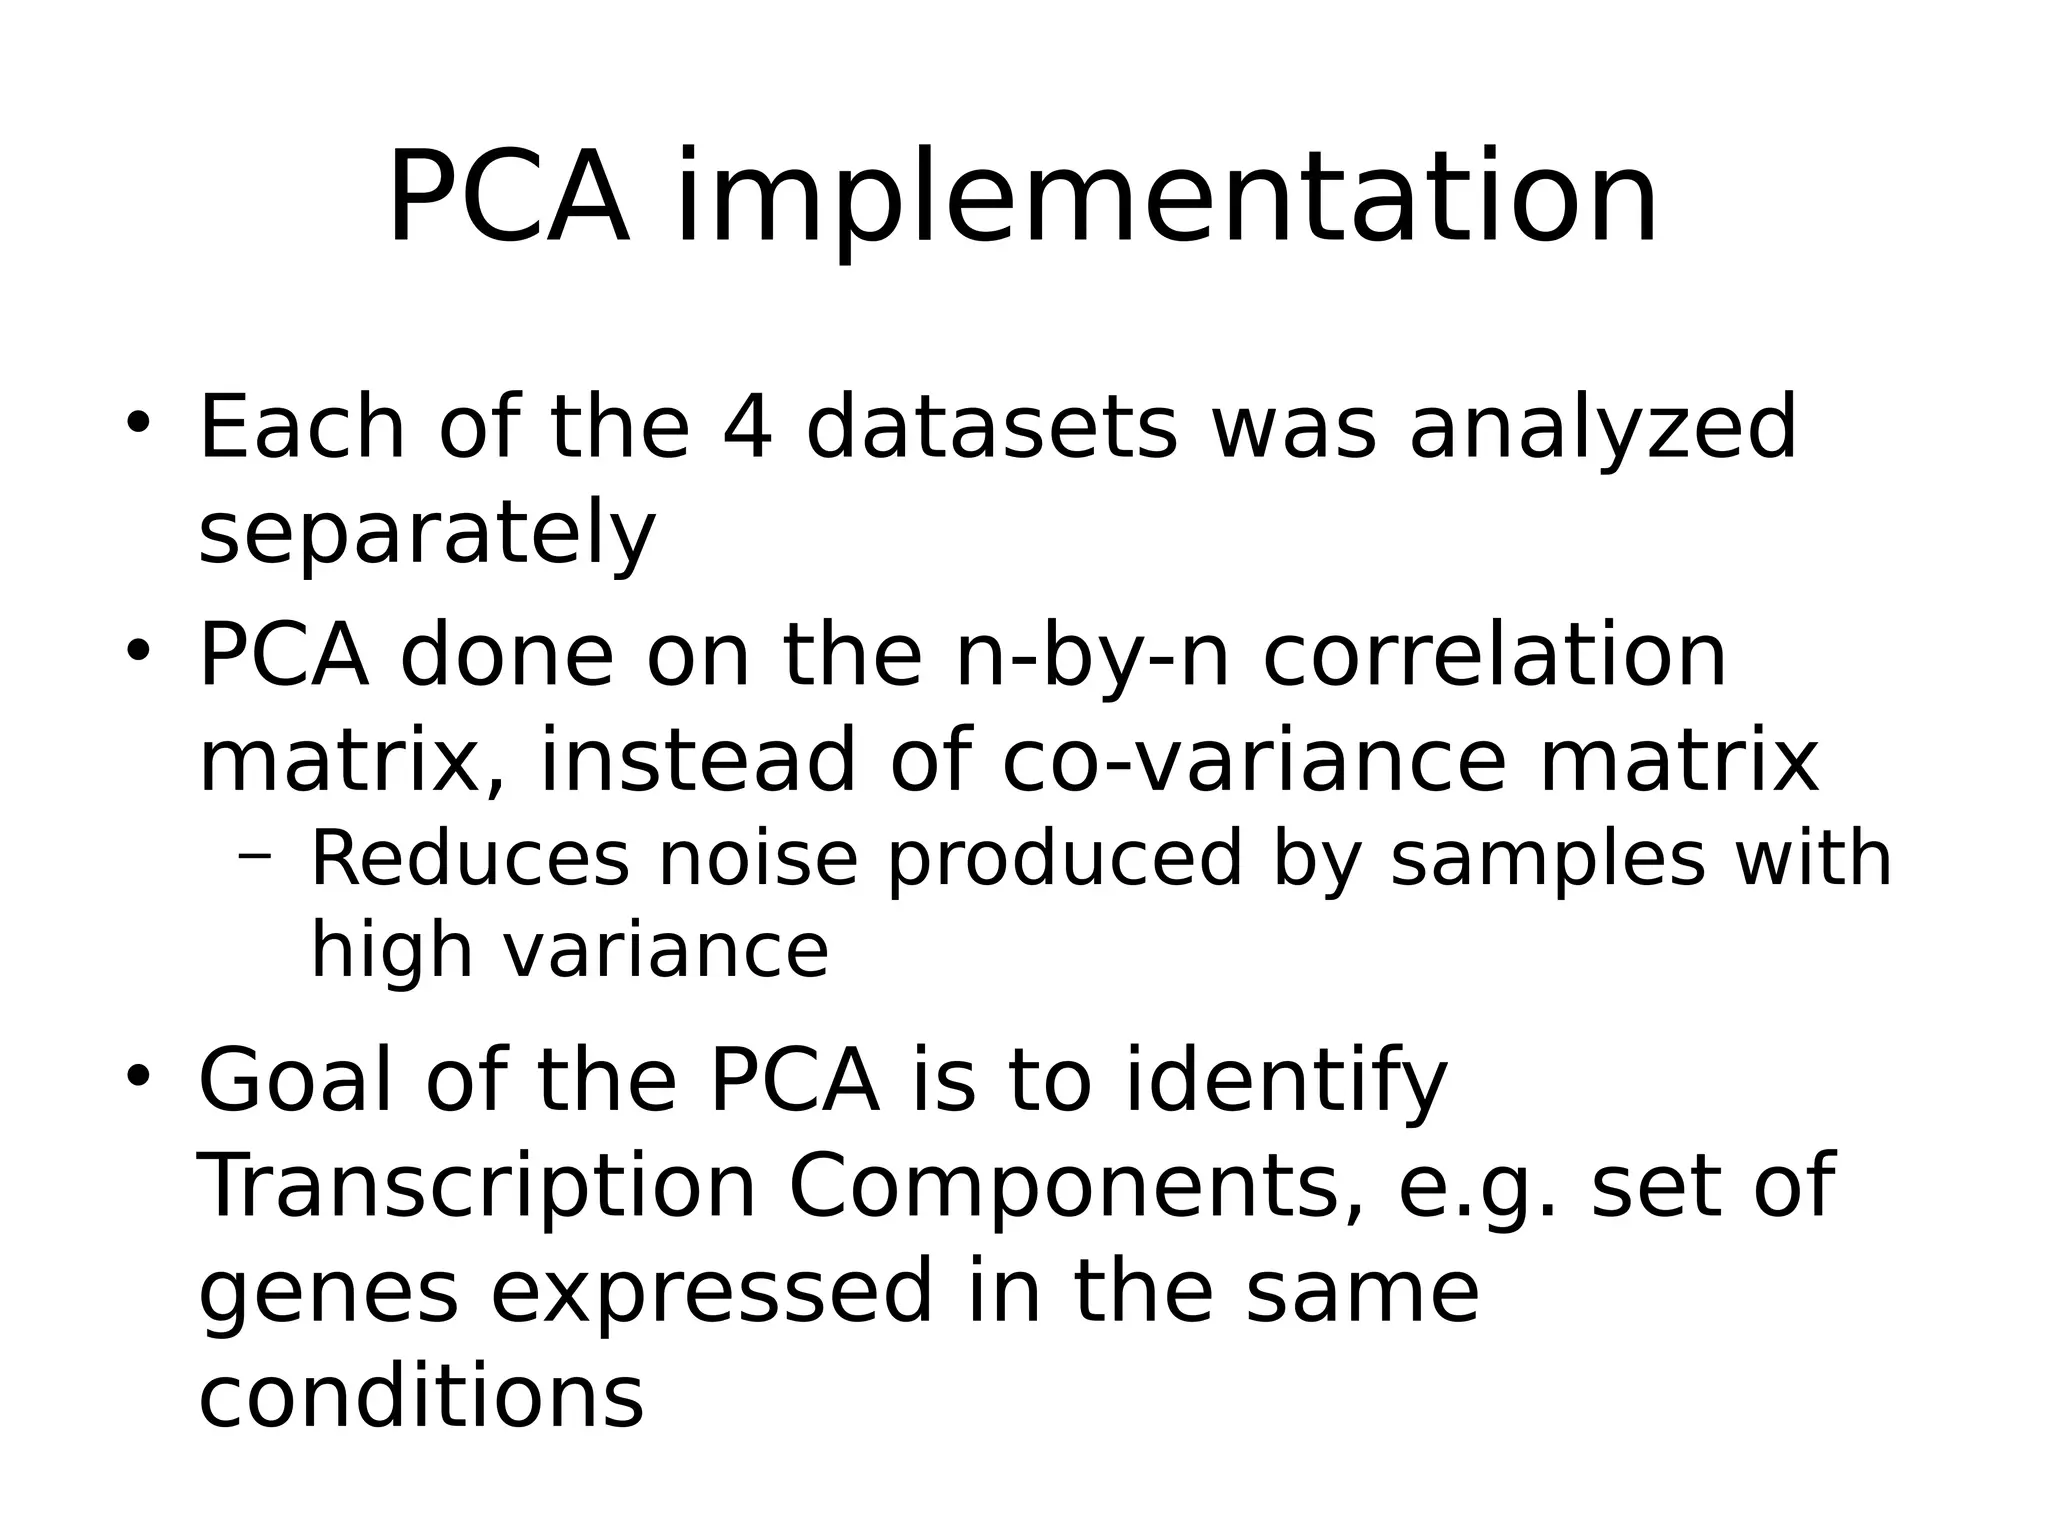
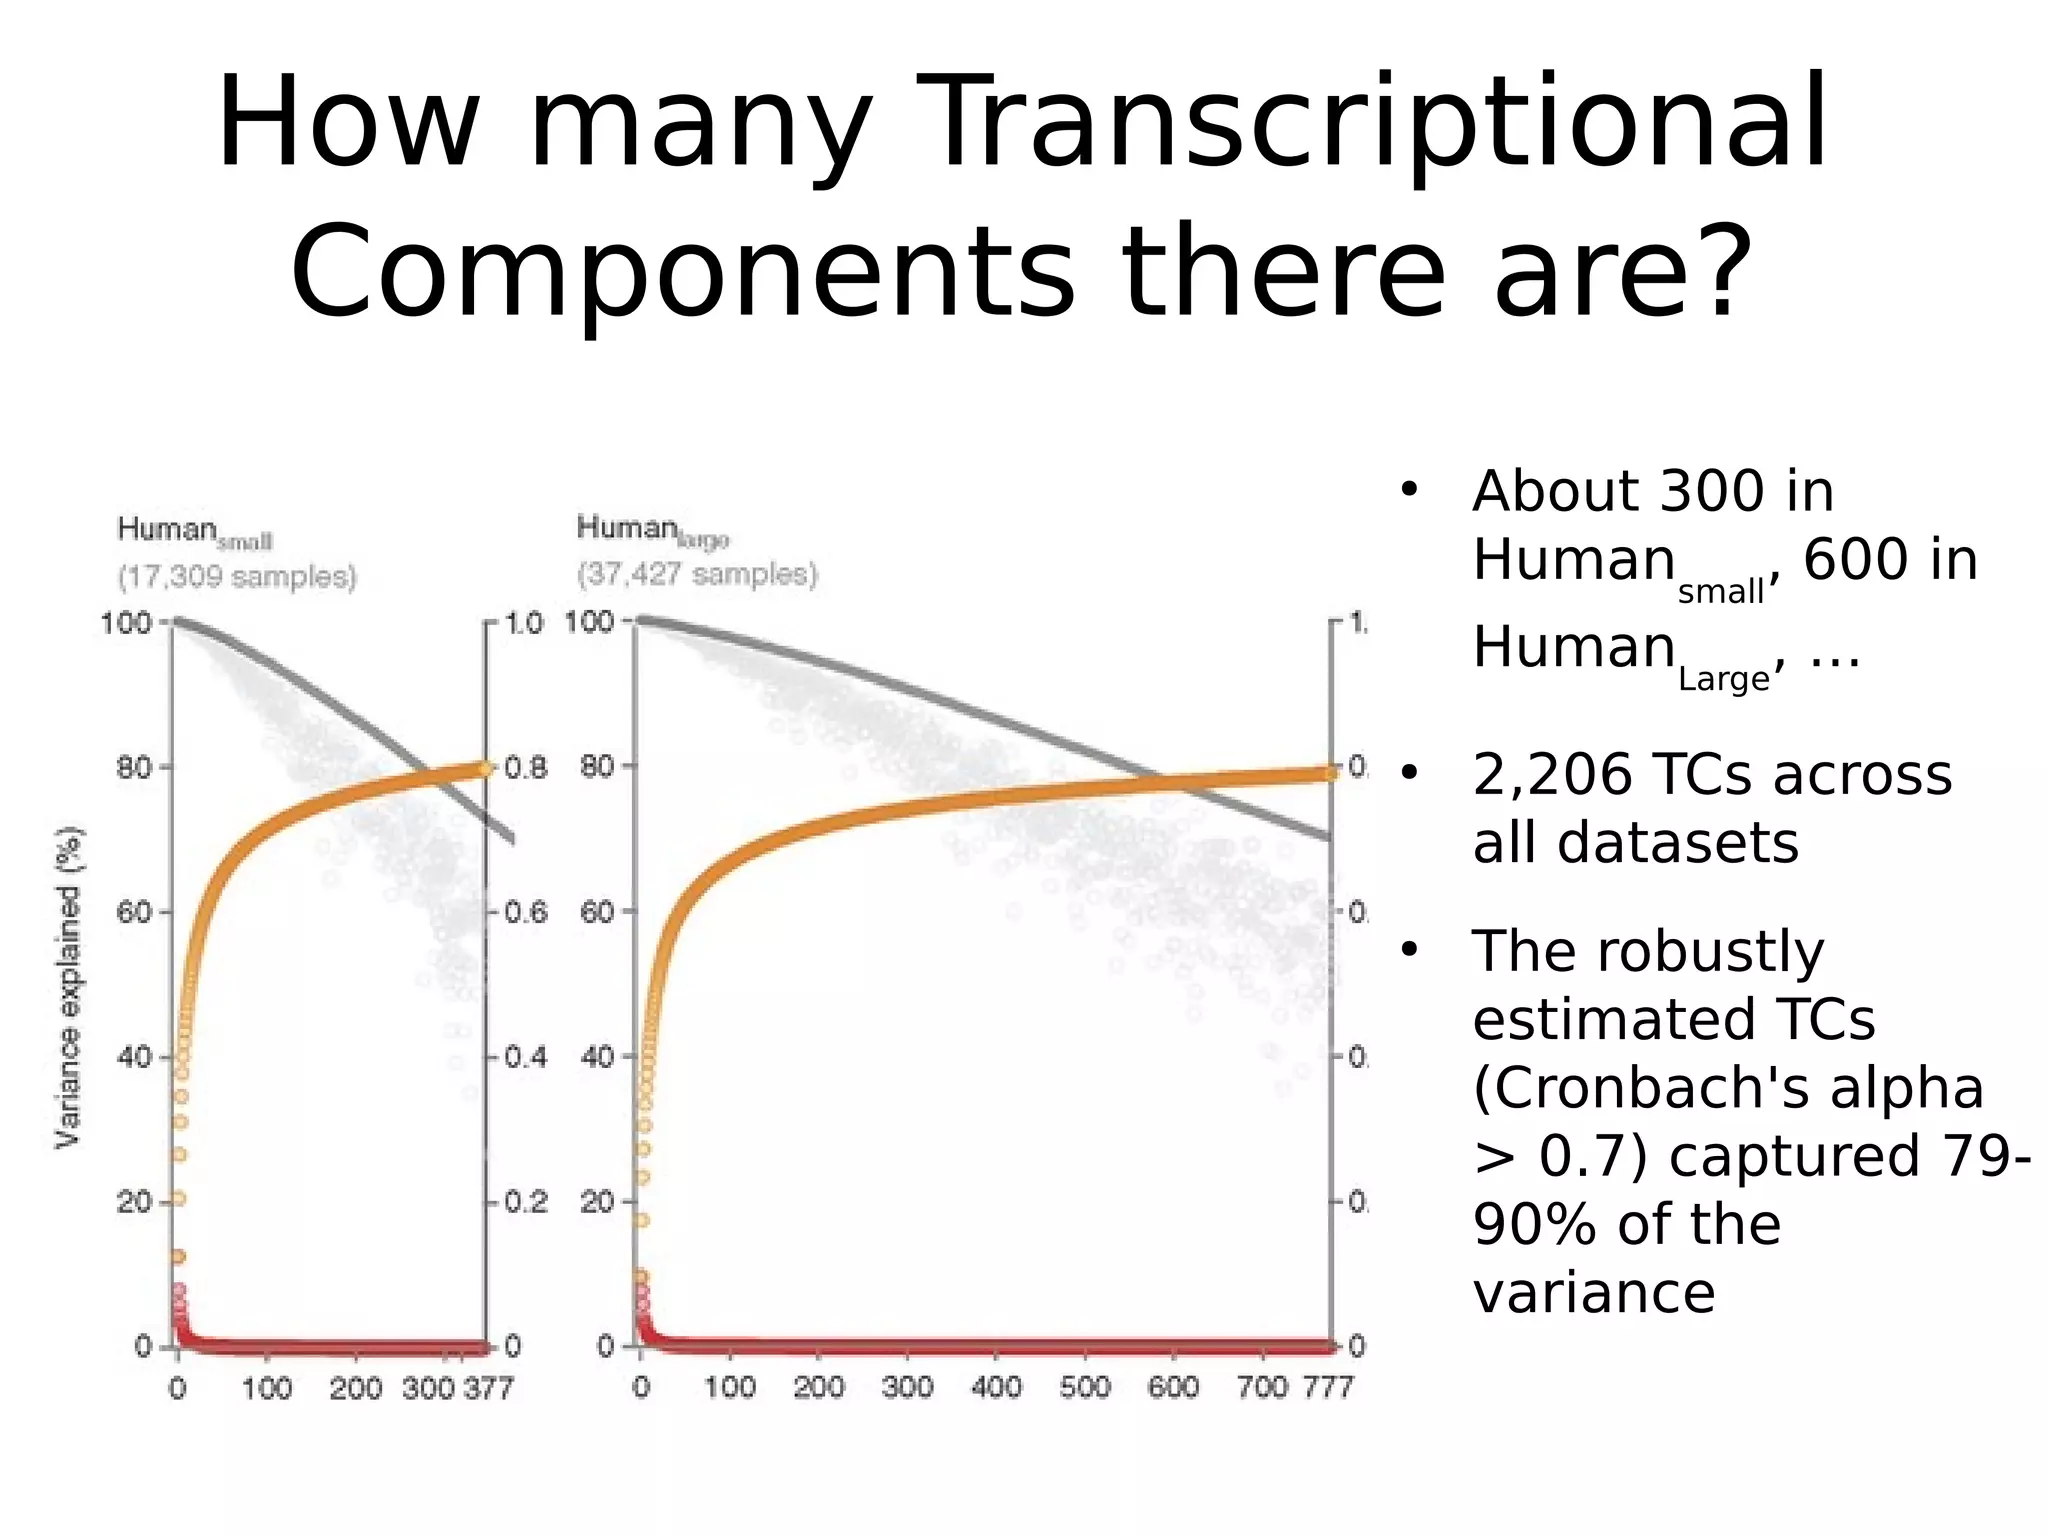
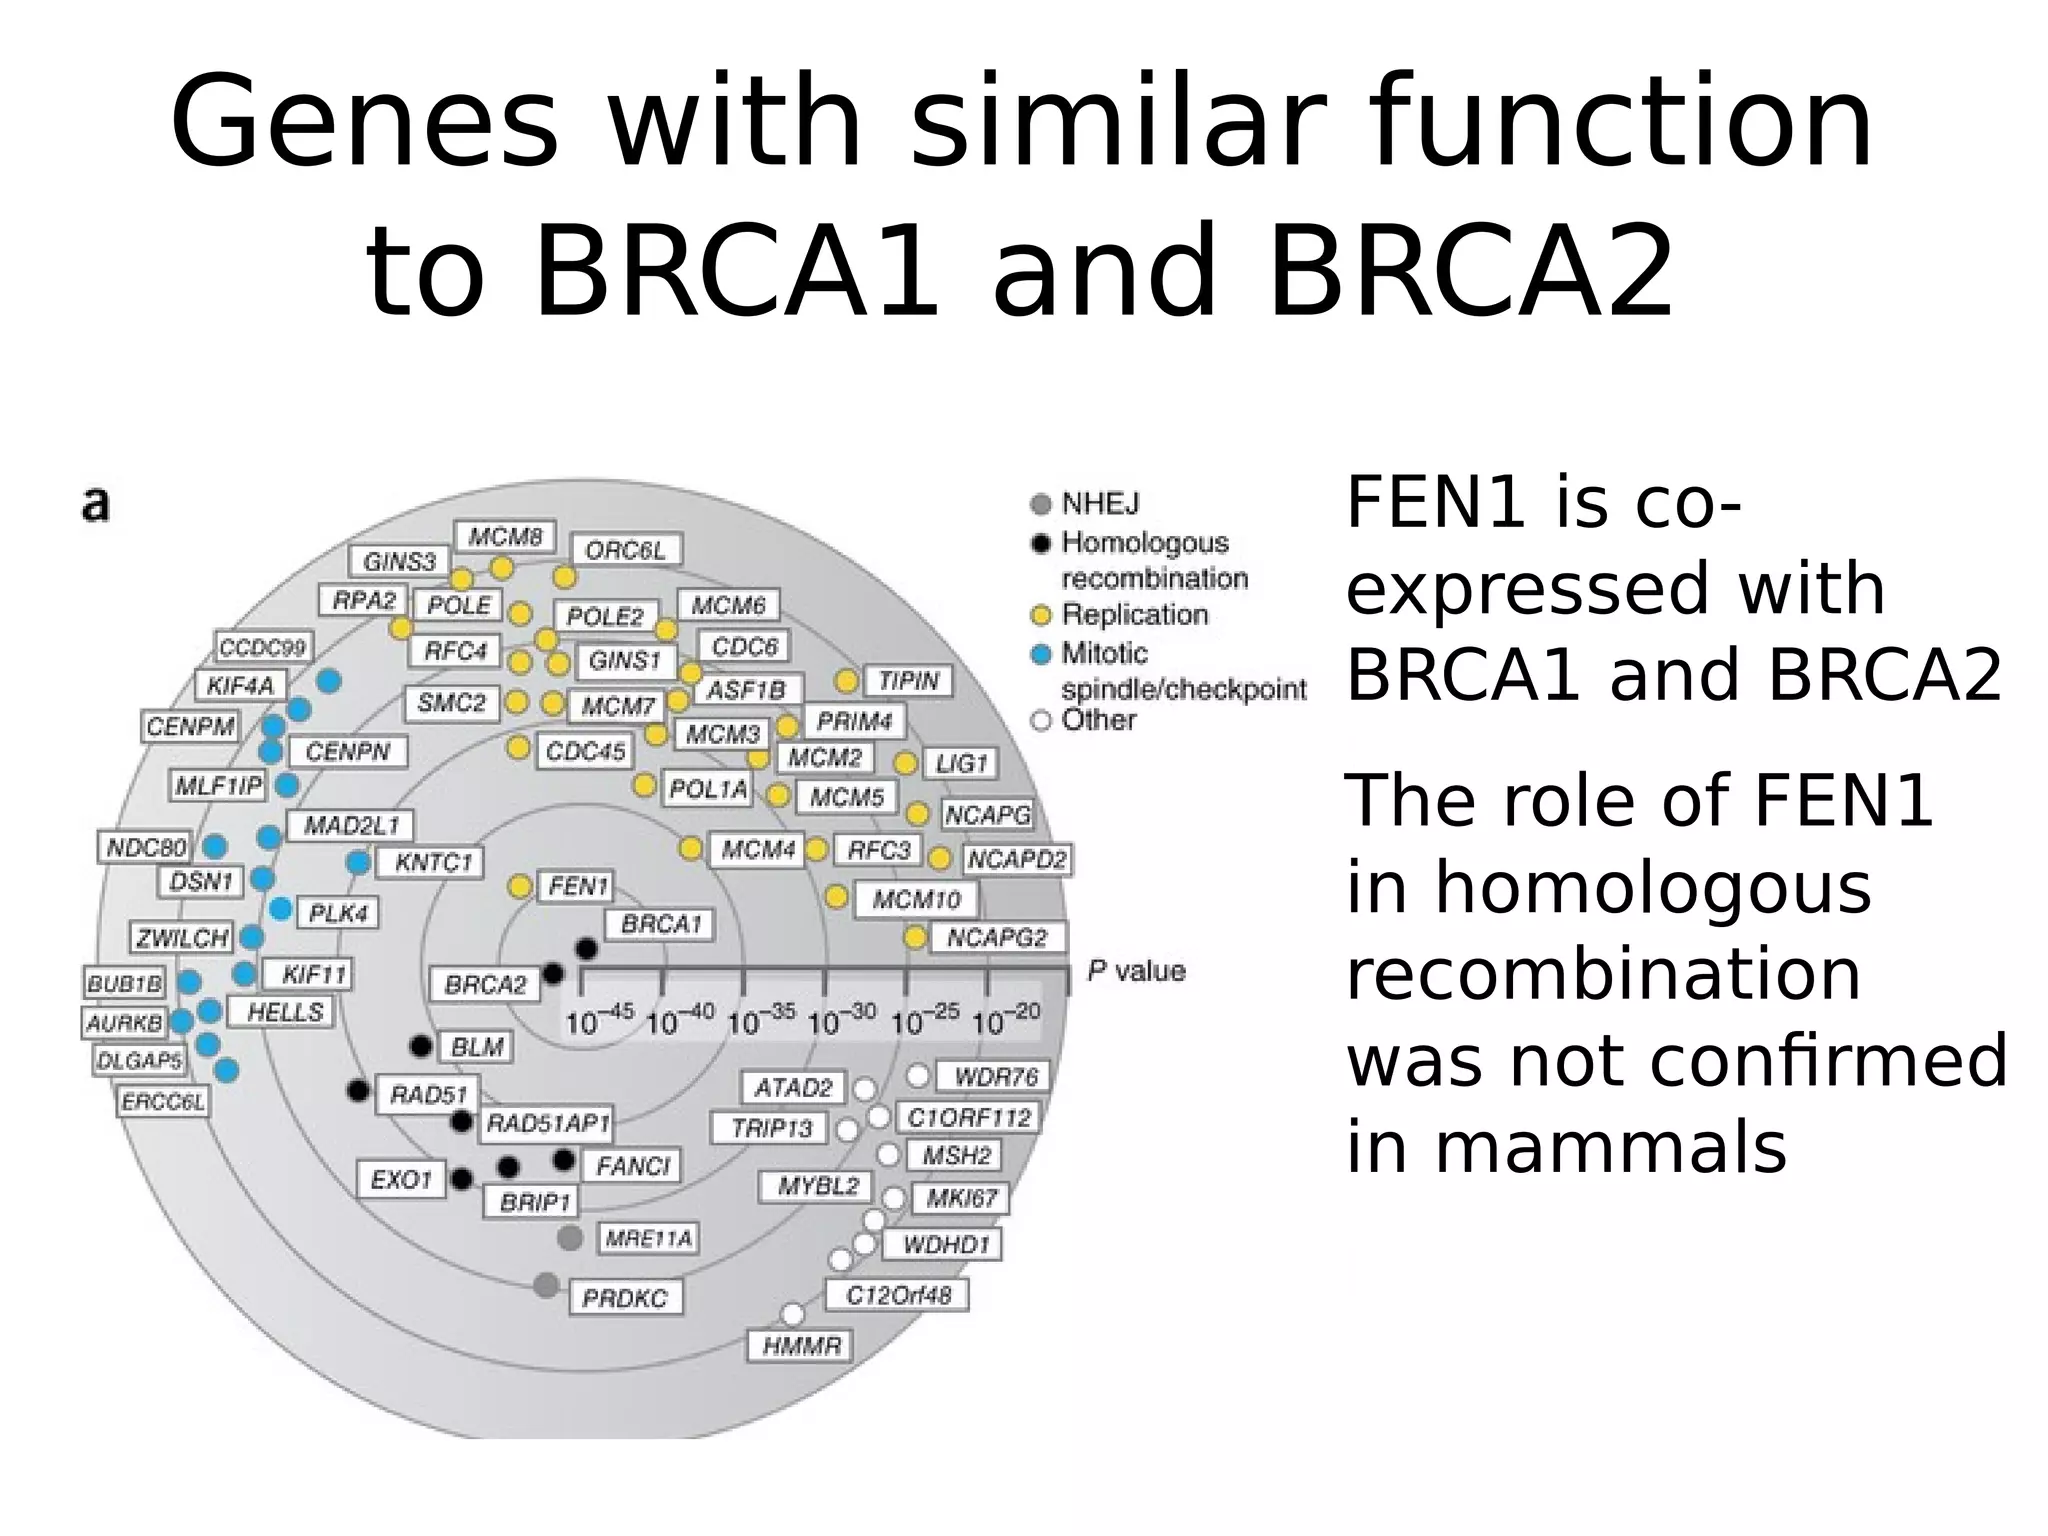
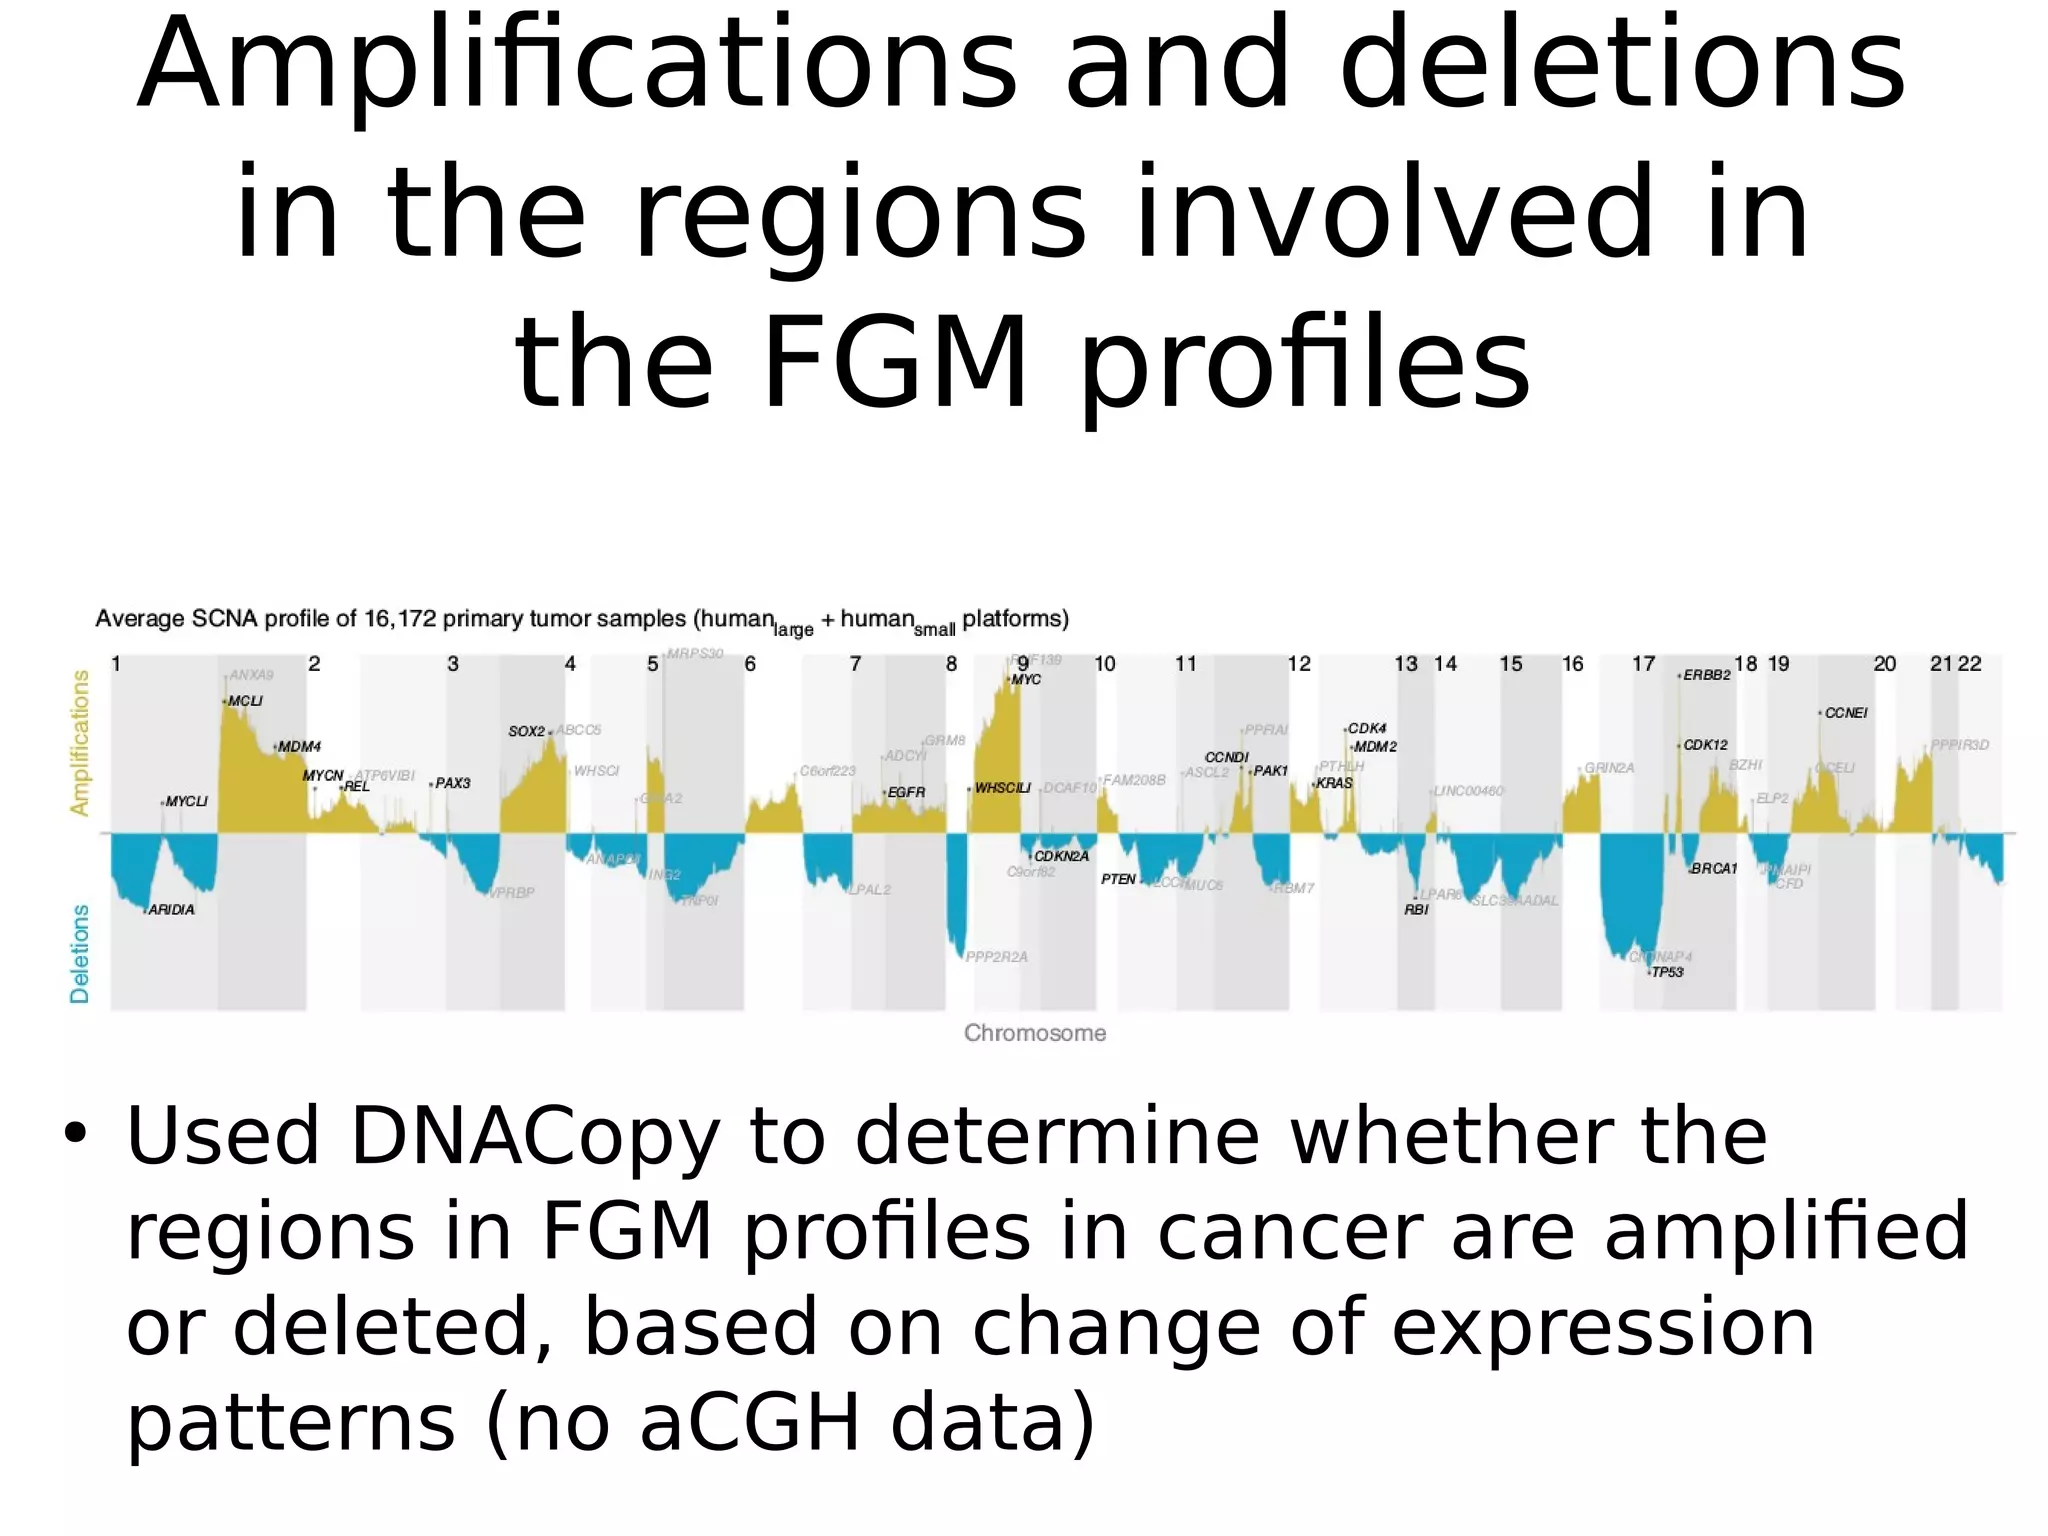
Fehrman et al, Nat Gen 2014.
Gene Expression analysis
identifies global gene
dosage sensitivity in cancer
Giovanni JC 30 March 2015
What is a PCA?
• PCA is a technique to
reduce a dataset with
3+ variables to two
or few dimensions
• Examples:
– a dataset of
individuals age,
height, weight, etc..
– a dataset of gene
expression
height
age
weight
height
age
w
eight
What is a PCA projection?
• In a PCA we rotate a 3+
dimensional plane, trying
to find the best “projection”
for observing separation
between data points
• Implementation:
– Find a line (PC1) that
separates the dataset in two
groups, explaining most of
the variance
– Find a second line (PC2)
orthogonal to the first, to
explain most of the
remaining variance
PC1
PC2
Variance explained by each
PC
PC coefficients
• The PCA will produce a new set of data
“axes”, called Principal Components (PC)
• Each PC is a combination of the original
variables, multiplied by a coefficient
Expression
gene 1
Expression
gene 2
Expression
gene 3
Expression
gene 4
Expression
gene 5
PC1 PC2 PC3 PC4
* 5.4 * 3.2 *-0.4 * 0.0 *-0.2
Eigenvector
coefficient
Interpreting each PC
●
Depending on which variables contribute
to a PC, we can give a biological
interpretation
– If weight and height contribute to PC1 while
age does not, then PC1 describes the “size” of
the individual
●
In gene expression, PCs can represent a set
of genes expressed in the same
transcription profile
– Thus we rename PCs as Transcriptional Components
(TCs)
Gene Expression Dataset
• Expression data from Gene Expression Omnibus
(Affymetrix, 4 datasets)
• Quality Control:
– a PCA is applied to each dataset, obtaining a PC explaining
80-90% of data variance
– This PC can be interpreted as probe- or platform- specific
variance, independently on the sample
– All the samples that have a correlation <0.75 with this PC are
removed, as they are considered low quality
• Final dataset:
– Human small: 17,309 samples
– Human large: 32,427
– Mouse: 17,081
– Rat: 6,023
Copy Number data and
samples annotation
• 470 tumor samples with array CGH
data (Agilent), analyzed with
DNACopy
– 51 ERBB2-amplified breast cancer, 173
inflammatory breast cancer, 246 multiple
myeloma
• Sample annotation: text-mining to
determine cancer/cell line/normal
samples
Number of probes and genes
Datasets for Gene Set
Enrichment Analysis
PCA implementation
• Each of the 4 datasets was analyzed
separately
• PCA done on the n-by-n correlation
matrix, instead of co-variance matrix
– Reduces noise produced by samples with
high variance
• Goal of the PCA is to identify
Transcription Components, e.g. set of
genes expressed in the same
conditions
Parameters of the PCA
• TC size: order of the component
– How much of the gene expression variance is represented by the TC
• TC setting: score of the component in a given sample
– How much the expression profile represented by a TC is active in the sample
• TC wiring: PC coefficient
– For every gene and for every expression profile (TC), how much the expression is
supposed to change
How many Transcriptional
Components there are?
●
About 300 in
Humansmall
, 600 in
HumanLarge
, …
●
2,206 TCs across
all datasets
●
The robustly
estimated TCs
(Cronbach's alpha
> 0.7) captured 79-
90% of the
variance
Do the TCs have biological meaning?
●
All the TCs had at least one gene set
enriched (GSEA), meaning that they
represent biological phenomena
Are the TCs different across
the four datasets?
● Humansmall
is
very similar to
Humanlarge
,
●
Mouse is similar
to Rat
●
Overall the most
robust
components are
similar in all four
datasets
TC3 represents
genes
expressed in
the brain
A TC-based gene network
●
Constructed a gene regulation
network with 19,997 genes
– Two genes are connected if they are in the
same TC (co-expressed)
●
This network can be used to predict
gene function using “guilt-by-
association”
– A gene involved in a TC where 100 other
genes are associated to apoptosis is probably
also associated to it
Guilt by association
●
Used the 2,206 TCs from the 4
datasets
●
Calculated a GSEA Z-score in each
TC for each gene set
●
A gene with unknown function is
associated to a gene set if its GSEA
scores are correlated with its
eigenvector coefficients
Genes with similar function
to BRCA1 and BRCA2
FEN1 is co-
expressed with
BRCA1 and BRCA2
The role of FEN1
in homologous
recombination
was not confirmed
in mammals
Involvement of FEN1 in
Homologous Recombination
1b: siRNA
silencing of
FEN1
2C, top:
if homologous
recombination
occurs, GFP is
expressed
FEM1 inhibition reduces homologous recombination
2d: chemical inhibition of FEM1 with MTT
2e: decrease of HR after inhibition of FEN1
Inhibition of FEM1 and PARP1 increases DNA breaks
2f: PARP1 inhibition
2g: higher number of DNA breaks if when both PARP1 and FEN1
are inhibited
2h: higher sensitivity to PARP1 inhibition
Identification of unstable samples
●
A subset of human samples showed enrichment for genes mapping
to the same chromosome band
●
This is the effect of large SCNAs in cancer tissue or cancer cell lines
Autocorrelation between TC
and chromosome position
Autocorrelation: eigenvector coefficients of a gene is
correlated with its neighbors
e.g. expression of gene is correlated with neighbors
Identification of SCNAs from
expression profiles
●
Used 18,713 samples with no SCNAs to
determine 718 non-genetic TCs, which are
then applied to the other 18,714 samples
●
SCNAs levels where correlated with residual
expression (not explained by TCs), explaining
28% of variation
●
This 28% variation is called Functional
Genomic mRNA profile (FGM) and
represent variation in gene expression that
diverge from the physiological status status
Identification of potential SCNA
events from expression profiles
Functional Genomic mRNA profile
●
FGM: Functional Genomic mRNA profile
– The portion of expression that can not be
explained by the 718 physiological non-
genetic PCs
●
20 trisomy samples clearly showed higher FGM
expression
●
In 470 cancer samples, FGM levels correlated
with SCNA levels (aCGH), explaining 86% of
variance
Most genes are dosage-sensitive
to chromosome arm duplications
●
They did another PCA on the FGM
profile data, for every
chromosome arm
– Describing if there are
changes in the expression of
all the genes in a chromosome
arm, not due to physiological
constraints (718 TCs)
●
The PC1, representing the most
prominent FGM pattern, described
a complete duplication or deletion
of the arm
●
91% of the probes were dosage-
sensitive to the complete
duplication/deletion of a
chromosome arm
More on dosage sensitivity
●
Fig 4b: highly expressed genes are more dosage-
sensitive
●
Fig 4c: similar patterns are observed with an eQTL
meta-analysis
FGM profiling of 16,172
tumor samples
●
Data preparation:
– Excluded cell lines (text mining + similar TC
profile)
– Excluded genetically identical samples and
related individuals (based on similarity of
eQTL expression) (234 mix-ups)
– Only samples with high genomic instability
(high auto-correlation) (potentially cancer
samples)
Hierarchical clustering of FGM
Most cancer
types show
samples with
similarly altered
expression
Some cancers
have similar
alteration
patterns
Amplifications and deletions
in the regions involved in
the FGM profiles
●
Used DNACopy to determine whether the
regions in FGM profiles in cancer are amplified
or deleted, based on change of expression
patterns (no aCGH data)
Distribution of genomic instability
●
Genomic instability: autocorrelation between
expression of a gene and its neighbors'
– e.g. tendency of a sample to have a high number of regions
with altered expression, likely to be amplified/deleted
Higher genomic instability corresponds
to lower survival and higher grade
Distribution of genomic instability
across genome and genes
Samples
where
CDKN2A and
ERBB2 have
altered
expression
Summary
●
Used PCA to obtain 2,206 expression
components
●
Of these, 718 represent physiological non-
genetic expression profiles
●
The expression not explained by these
718 TCs (FGM profile) can be explained by
SCNA alterations
●
Most genes are dosage-sensitive, at least
for arm-level alterations
Fehrman Nat Gen 2014 - Journal Club

Fehrman Nat Gen 2014 - Journal Club

  • 1.
    Fehrman et al,Nat Gen 2014. Gene Expression analysis identifies global gene dosage sensitivity in cancer Giovanni JC 30 March 2015
  • 2.
    What is aPCA? • PCA is a technique to reduce a dataset with 3+ variables to two or few dimensions • Examples: – a dataset of individuals age, height, weight, etc.. – a dataset of gene expression height age weight
  • 3.
    height age w eight What is aPCA projection? • In a PCA we rotate a 3+ dimensional plane, trying to find the best “projection” for observing separation between data points • Implementation: – Find a line (PC1) that separates the dataset in two groups, explaining most of the variance – Find a second line (PC2) orthogonal to the first, to explain most of the remaining variance PC1 PC2
  • 4.
  • 5.
    PC coefficients • ThePCA will produce a new set of data “axes”, called Principal Components (PC) • Each PC is a combination of the original variables, multiplied by a coefficient Expression gene 1 Expression gene 2 Expression gene 3 Expression gene 4 Expression gene 5 PC1 PC2 PC3 PC4 * 5.4 * 3.2 *-0.4 * 0.0 *-0.2 Eigenvector coefficient
  • 6.
    Interpreting each PC ● Dependingon which variables contribute to a PC, we can give a biological interpretation – If weight and height contribute to PC1 while age does not, then PC1 describes the “size” of the individual ● In gene expression, PCs can represent a set of genes expressed in the same transcription profile – Thus we rename PCs as Transcriptional Components (TCs)
  • 7.
    Gene Expression Dataset •Expression data from Gene Expression Omnibus (Affymetrix, 4 datasets) • Quality Control: – a PCA is applied to each dataset, obtaining a PC explaining 80-90% of data variance – This PC can be interpreted as probe- or platform- specific variance, independently on the sample – All the samples that have a correlation <0.75 with this PC are removed, as they are considered low quality • Final dataset: – Human small: 17,309 samples – Human large: 32,427 – Mouse: 17,081 – Rat: 6,023
  • 8.
    Copy Number dataand samples annotation • 470 tumor samples with array CGH data (Agilent), analyzed with DNACopy – 51 ERBB2-amplified breast cancer, 173 inflammatory breast cancer, 246 multiple myeloma • Sample annotation: text-mining to determine cancer/cell line/normal samples
  • 9.
  • 10.
    Datasets for GeneSet Enrichment Analysis
  • 11.
    PCA implementation • Eachof the 4 datasets was analyzed separately • PCA done on the n-by-n correlation matrix, instead of co-variance matrix – Reduces noise produced by samples with high variance • Goal of the PCA is to identify Transcription Components, e.g. set of genes expressed in the same conditions
  • 12.
    Parameters of thePCA • TC size: order of the component – How much of the gene expression variance is represented by the TC • TC setting: score of the component in a given sample – How much the expression profile represented by a TC is active in the sample • TC wiring: PC coefficient – For every gene and for every expression profile (TC), how much the expression is supposed to change
  • 13.
    How many Transcriptional Componentsthere are? ● About 300 in Humansmall , 600 in HumanLarge , … ● 2,206 TCs across all datasets ● The robustly estimated TCs (Cronbach's alpha > 0.7) captured 79- 90% of the variance
  • 14.
    Do the TCshave biological meaning? ● All the TCs had at least one gene set enriched (GSEA), meaning that they represent biological phenomena
  • 15.
    Are the TCsdifferent across the four datasets? ● Humansmall is very similar to Humanlarge , ● Mouse is similar to Rat ● Overall the most robust components are similar in all four datasets
  • 16.
  • 17.
    A TC-based genenetwork ● Constructed a gene regulation network with 19,997 genes – Two genes are connected if they are in the same TC (co-expressed) ● This network can be used to predict gene function using “guilt-by- association” – A gene involved in a TC where 100 other genes are associated to apoptosis is probably also associated to it
  • 18.
    Guilt by association ● Usedthe 2,206 TCs from the 4 datasets ● Calculated a GSEA Z-score in each TC for each gene set ● A gene with unknown function is associated to a gene set if its GSEA scores are correlated with its eigenvector coefficients
  • 19.
    Genes with similarfunction to BRCA1 and BRCA2 FEN1 is co- expressed with BRCA1 and BRCA2 The role of FEN1 in homologous recombination was not confirmed in mammals
  • 20.
    Involvement of FEN1in Homologous Recombination 1b: siRNA silencing of FEN1 2C, top: if homologous recombination occurs, GFP is expressed
  • 21.
    FEM1 inhibition reduceshomologous recombination 2d: chemical inhibition of FEM1 with MTT 2e: decrease of HR after inhibition of FEN1
  • 22.
    Inhibition of FEM1and PARP1 increases DNA breaks 2f: PARP1 inhibition 2g: higher number of DNA breaks if when both PARP1 and FEN1 are inhibited 2h: higher sensitivity to PARP1 inhibition
  • 23.
    Identification of unstablesamples ● A subset of human samples showed enrichment for genes mapping to the same chromosome band ● This is the effect of large SCNAs in cancer tissue or cancer cell lines
  • 24.
    Autocorrelation between TC andchromosome position Autocorrelation: eigenvector coefficients of a gene is correlated with its neighbors e.g. expression of gene is correlated with neighbors
  • 25.
    Identification of SCNAsfrom expression profiles ● Used 18,713 samples with no SCNAs to determine 718 non-genetic TCs, which are then applied to the other 18,714 samples ● SCNAs levels where correlated with residual expression (not explained by TCs), explaining 28% of variation ● This 28% variation is called Functional Genomic mRNA profile (FGM) and represent variation in gene expression that diverge from the physiological status status
  • 26.
    Identification of potentialSCNA events from expression profiles
  • 27.
    Functional Genomic mRNAprofile ● FGM: Functional Genomic mRNA profile – The portion of expression that can not be explained by the 718 physiological non- genetic PCs ● 20 trisomy samples clearly showed higher FGM expression ● In 470 cancer samples, FGM levels correlated with SCNA levels (aCGH), explaining 86% of variance
  • 28.
    Most genes aredosage-sensitive to chromosome arm duplications ● They did another PCA on the FGM profile data, for every chromosome arm – Describing if there are changes in the expression of all the genes in a chromosome arm, not due to physiological constraints (718 TCs) ● The PC1, representing the most prominent FGM pattern, described a complete duplication or deletion of the arm ● 91% of the probes were dosage- sensitive to the complete duplication/deletion of a chromosome arm
  • 29.
    More on dosagesensitivity ● Fig 4b: highly expressed genes are more dosage- sensitive ● Fig 4c: similar patterns are observed with an eQTL meta-analysis
  • 30.
    FGM profiling of16,172 tumor samples ● Data preparation: – Excluded cell lines (text mining + similar TC profile) – Excluded genetically identical samples and related individuals (based on similarity of eQTL expression) (234 mix-ups) – Only samples with high genomic instability (high auto-correlation) (potentially cancer samples)
  • 31.
    Hierarchical clustering ofFGM Most cancer types show samples with similarly altered expression Some cancers have similar alteration patterns
  • 32.
    Amplifications and deletions inthe regions involved in the FGM profiles ● Used DNACopy to determine whether the regions in FGM profiles in cancer are amplified or deleted, based on change of expression patterns (no aCGH data)
  • 33.
    Distribution of genomicinstability ● Genomic instability: autocorrelation between expression of a gene and its neighbors' – e.g. tendency of a sample to have a high number of regions with altered expression, likely to be amplified/deleted
  • 34.
    Higher genomic instabilitycorresponds to lower survival and higher grade
  • 35.
    Distribution of genomicinstability across genome and genes
  • 36.
  • 37.
    Summary ● Used PCA toobtain 2,206 expression components ● Of these, 718 represent physiological non- genetic expression profiles ● The expression not explained by these 718 TCs (FGM profile) can be explained by SCNA alterations ● Most genes are dosage-sensitive, at least for arm-level alterations