

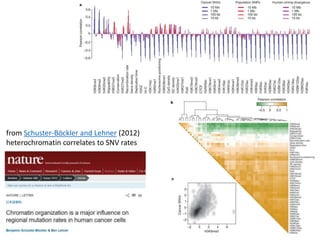
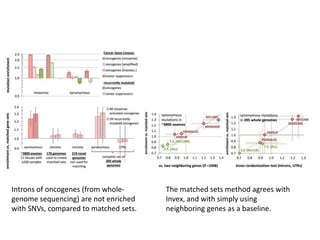
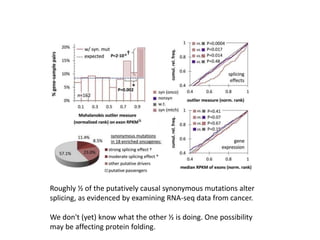
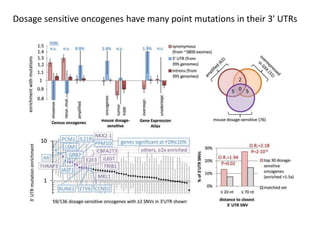

1) The document discusses how synonymous mutations, which do not change the protein sequence, are frequently found to act as drivers in carcinogenesis. 2) Using data from thousands of human cancer genomes, the author finds that oncogenes are enriched for synonymous mutations, showing synonymous mutations can be selected for during cancer development. 3) Further analysis suggests some synonymous mutations may impact mRNA folding, splicing, or microRNA binding sites and thus influence gene expression, providing a means for them to act as drivers.


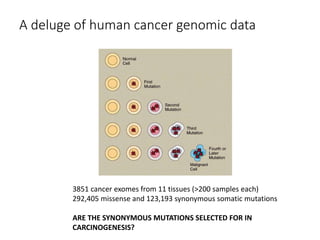
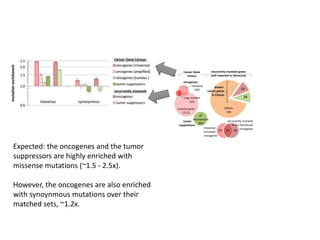
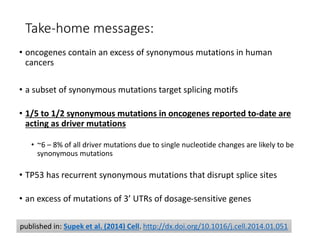
![Polymer [ बहुलक ] Chemistry Notes PDF - Irfanullah Mehar - JJ Sir Chemistry.pdf](https://cdn.slidesharecdn.com/ss_thumbnails/polymerchemistrynotespdf-irfanullahmehar-jjsirchemistry-260210172118-3f9b37f7-thumbnail.jpg?width=640&height=640&fit=bounds)


