Downloaded 45 times


![Introduction
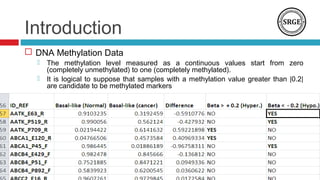
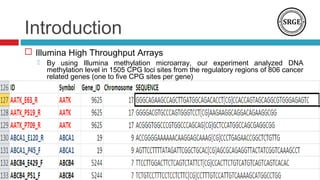
we analyze the DNA methylation data from 28 breast cancer
subtypes paired samples, The normal tissue is located at least 2
Centimeters away from site of the tumor. The methylation data
reported in this paper have been previously deposited in NCBIs
Gene Expression Omnibus (GEO) and are accessible through
GEO Series accession number [GEO: GSE22135]. The
methylation level measured as a continuous values start from
zero (completely unmethylated) to one (completely methylated).](https://image.slidesharecdn.com/ibica2014p8visualizingandidentifyingthednamethylation-140522120822-phpapp01/85/Ibica2014-p-8-visualizing-and-identifying-the-dna-methylation-13-320.jpg)


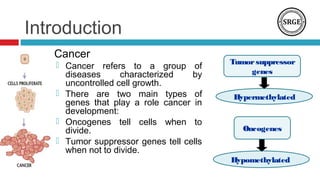
The document discusses the role of DNA methylation in breast cancer subtypes, emphasizing its significance in gene expression regulation and cancer development. It presents methodologies for analyzing DNA methylation data, including filtering techniques and statistical tests to identify differential methylation markers. The study highlights the potential for future research using formal concept analysis to better understand DNA methylation across various subtypes of breast cancer.


