Download to read offline
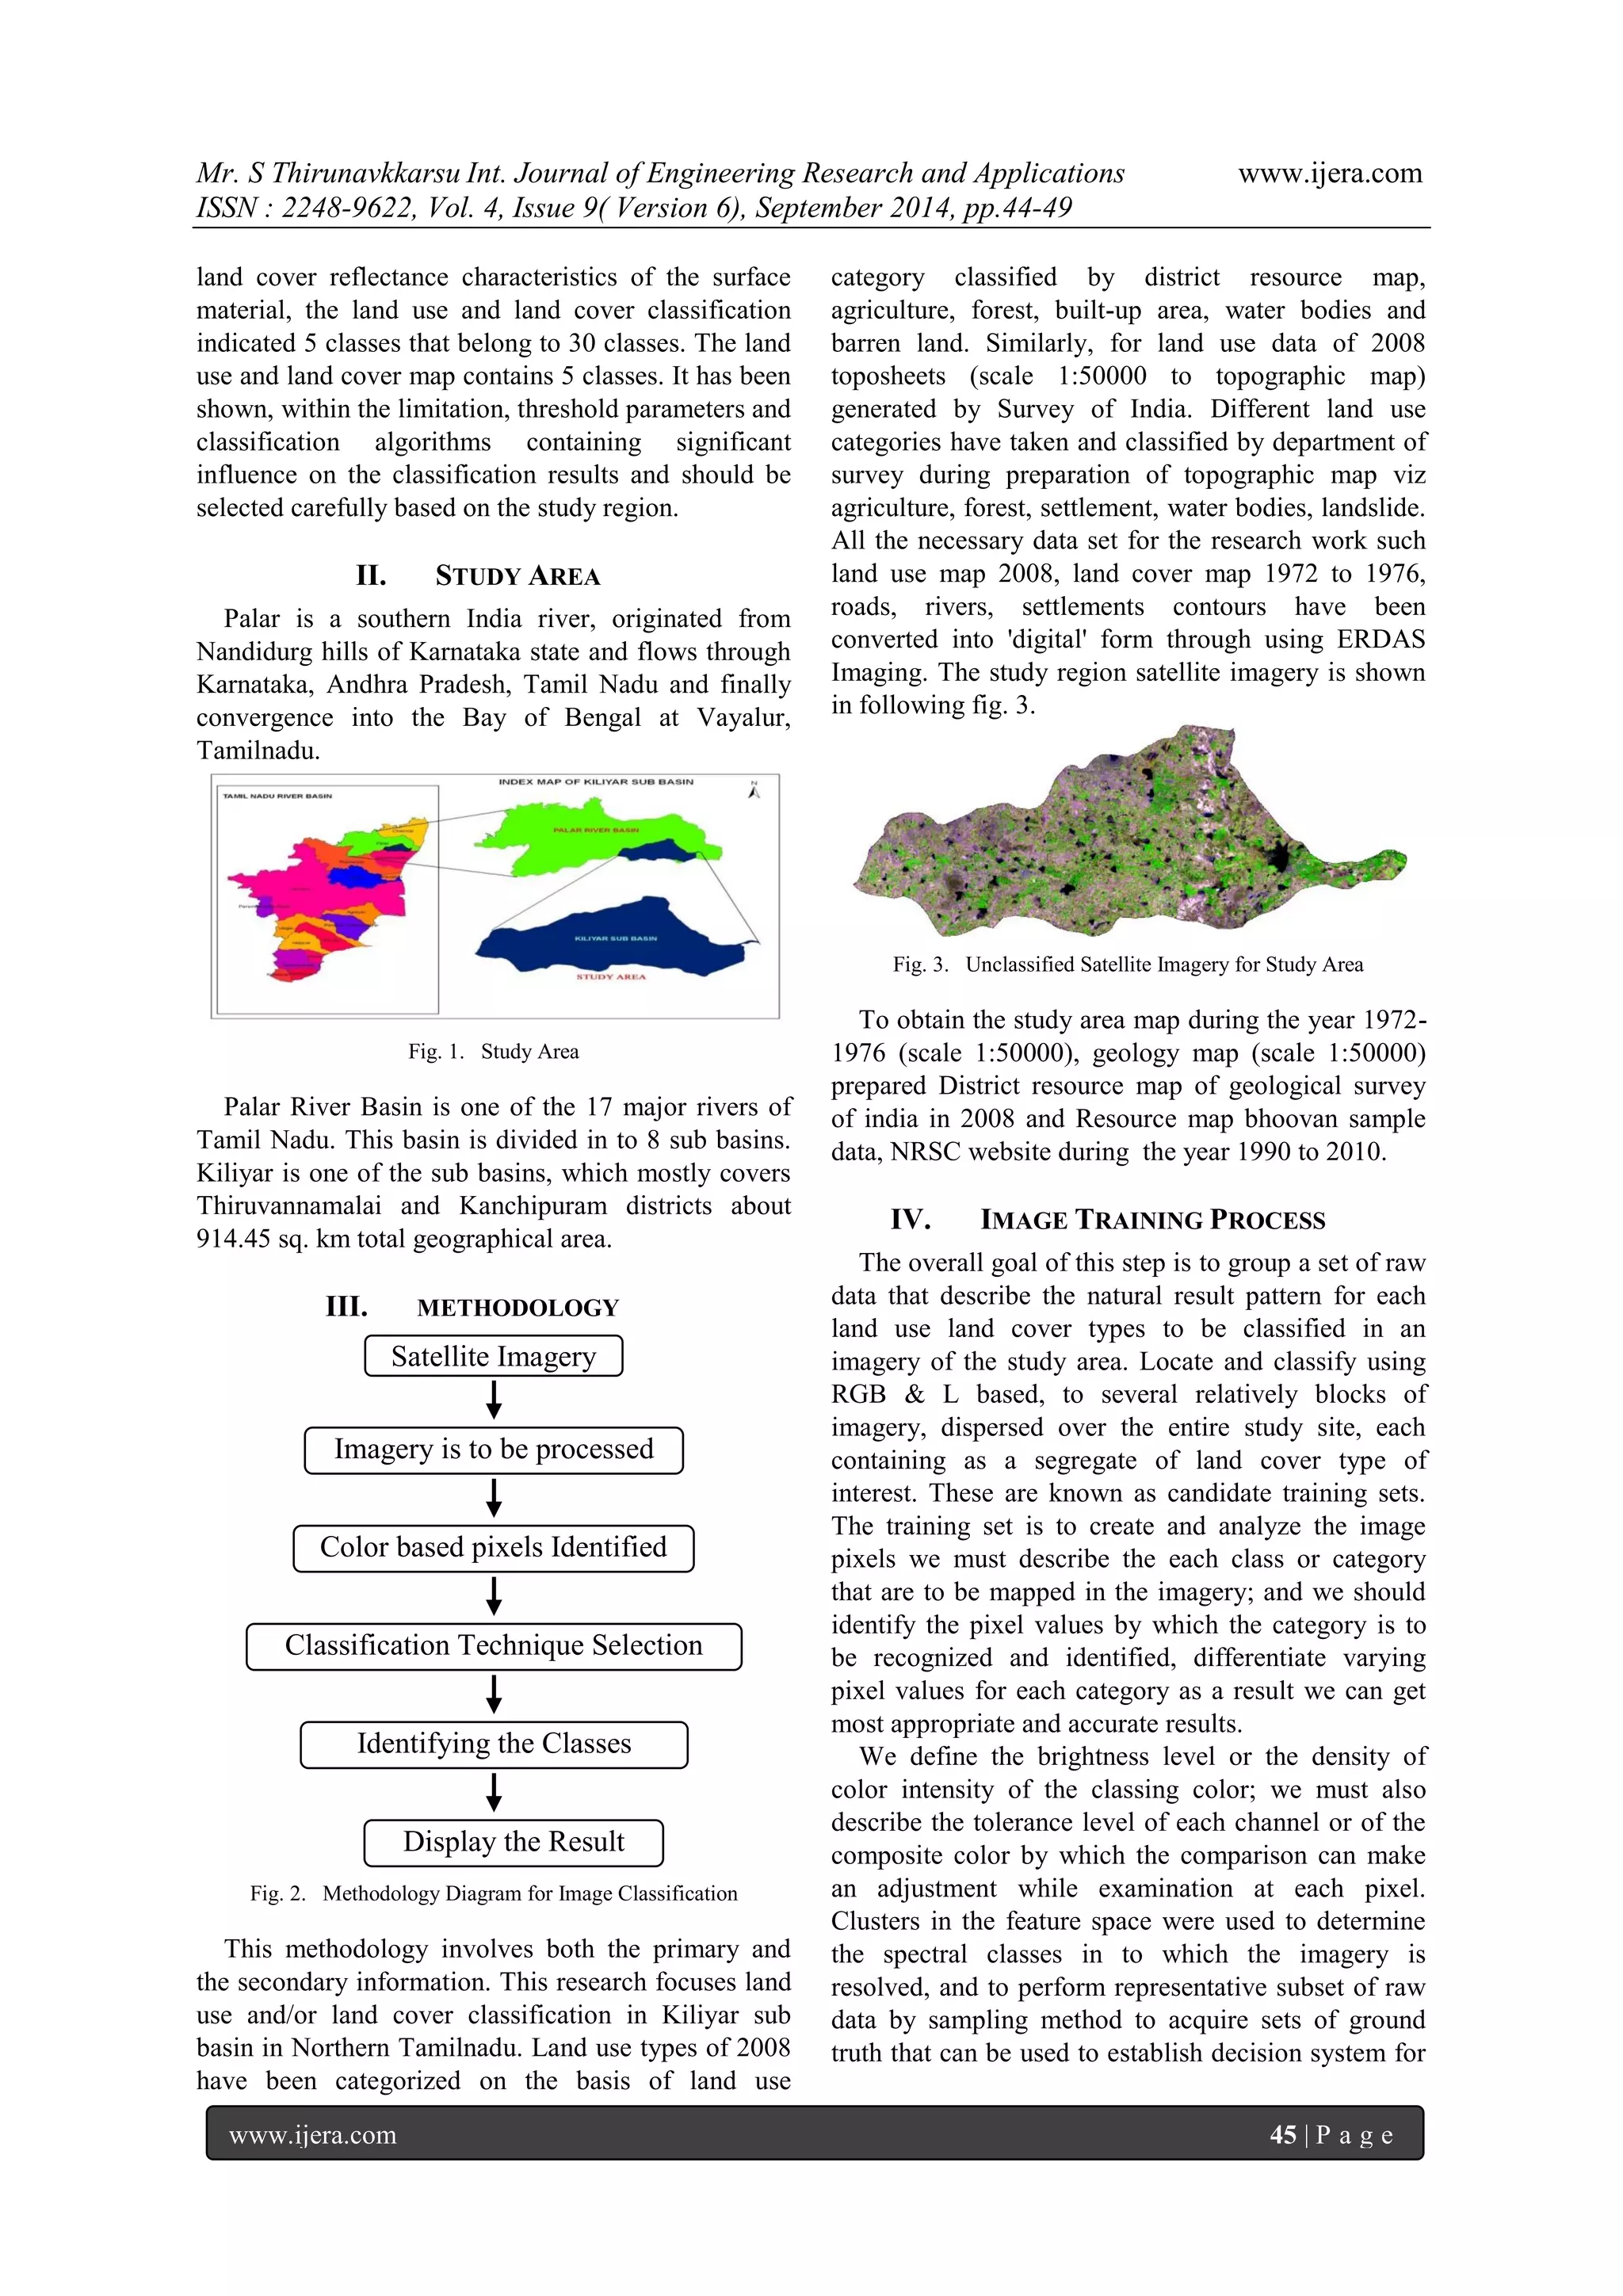
![Mr. S Thirunavkkarsu Int. Journal of Engineering Research and Applications www.ijera.com
ISSN : 2248-9622, Vol. 4, Issue 9( Version 6), September 2014, pp.44-49
www.ijera.com 44 | P a g e
Performance of RGB and L Base Supervised Classification Technique Using Multispectral Satellite Imagery Mr. S Thirunavkkarsu*, Capt. Dr. S Santhosh Baboo** *Research Schollar, P.G. and Research Department of Computer Science, Dwaraka Doss Goverdhan Doss Vaishnav College, Chennai – 600 106. ** Associate Professor, P.G. and Research Department of Computer Science, Dwaraka Doss Goverdhan Doss Vaishnav College, Chennai – 600 106.
ABSTRACT In the present growth of sensor technology is to improve the new chance and applications in GIS. This enhances the technology law a new method that should not focus on real time available products, but it must automatically lead to new ones. The aim of the paper is to make a maximum use of remote sensing data and GIS techniques to access land use and land cover classification in the Kiliyar sub basin sector in palar river of northen part of Tamil Nadu.IRS P6 LISS III is merged data to perform the classification using ERDAS Imaging. The RGB and L base supervised classification was based up on a Multispectral analysis, land use and land cover information‟s (maps and existing reports), which involves advanced technology and complex data processing to find detailed imagery in the study region. Ground surface reflects more radar energy emitted by the sensor from the study region, which makes it easy to distinguish between the water body, hilly, agriculture, settlement and wetland.
Keywords - Multispectral, Classification, RGB&L, SAM, SCM,
I. INTRODUCTION
A procedure that use the satellite imagery data to produce maps and/or tables shows the study region and point of different selected land cover types or ground characteristic is called image classification[2]. This is the next step of the imagery enhancement or post processing. This is the most common ways to use remotely sensed data for generate land cover maps. This technique requires minimal prior knowledge of the area where a map is needed and easily incorporates ancillary data. Remote sensing image classification can be viewed as a joint venture of both image processing and classification techniques. Generally, image classification, in the field of remote sensing is the process of assigning pixels or the basic units of an image to classes. It is likely to assemble groups of identical pixels found in remotely sensed data into classes that match the informational categories of user interest by comparing pixels to one another and to those of known identity. Several technique of image classification exists.
Image classification is an important part of the remote sensing, image analysis and pattern recognition. In some instances, the classification itself may be the object of the analysis. For example, classification of land use from remotely sensed data produces a map like imagery as the final product of the analysis [6]. In other cases, the classification can serve only as an intermediate step in more intricate analyses, such as land degradation studies, process studies, landscape modeling, coastal zone management, resource management and other environment monitoring applications. The image classification therefore forms an important tool for examination of the digital images. Using this classification tool, we can extract our own representation of land use/land cover information. As a result, image classification has emerged as a significant tool for investigating digital images. Moreover, the selection of the appropriate classification technique to be employed can have a considerable upshot on the results of whether the classification is used as an ultimate product or as one of numerous analytical procedures applied for deriving information from an imagery for additional analyses[5].
Multispectral imagery is used for imagery classification based on unsupervised and supervised classification algorithm. In the preprocessing stage, RGB and L based spectral sharpening method is applied to sharpen and resample for achieving pixel size based on high resolution. The performance evaluation metrics proved that spectral sharpening performs better than sharpening the RGB and L between the boundaries. The minimum distance to mean classifier, the maximum likelihood classifier and the box classification were used. According to the
RESEARCH ARTICLE OPEN ACCESS](https://image.slidesharecdn.com/f49064449-141021040827-conversion-gate01/75/Performance-of-RGB-and-L-Base-Supervised-Classification-Technique-Using-Multispectral-Satellite-Imagery-1-2048.jpg)
![Mr. S Thirunavkkarsu Int. Journal of Engineering Research and Applications www.ijera.com
ISSN : 2248-9622, Vol. 4, Issue 9( Version 6), September 2014, pp.44-49
www.ijera.com 46 | P a g e
the classification of every pixel in the satellite imagery data set. Training data set is called signature file creation is shown in the following fig.4.
Fig. 4. Image Pixel Identification for Signature File Creation
In the fig. 4, various category of classes like Hills, Water body, Agriculture Land, Wetland, Settlement were chosen as training area. In this process the block pixels are trained as water body or tank, the dark gray pixels selected as Hills, the ash green pixels are trained as barren land and the red pixels are trained as cropland, continue in this process according to our classification method. Thus under the hole system we will require to provide the following data as training data set.
Name or label of the group
RGB channel values of the color for the group
Tolerance of the color from the described color
4.1. Input the Imagery to Process
Imagery for analysis must be specified as RGB and L base techniques deal with the pixel values, regardless of the type of the imagery or any imagery can be analyzed. In this satellite imagery, details are given below Table 1. Table1: Satellite Imagery Details
Image Type
Pan and Liss III Merged Data
File Format
Geo TIFF
Projection Type
UTM
Spheroid Name
WGS 84
Datum Name
WGS84
UTM Zone
1
North or South
North
4.2. Color Based Pixel Identification
From the top left corner of the input imagery, the pixels are grip and are used for assessment. While grievance the pixel values, we transform the pixels color values into the separate channel values and the brightness level or identify its density level.
4.3. Proposed Classification Method
The remote sensing presents with a number of supervised and unsupervised technique, that have been developed to undertake the multispectral data classification problem. In this paper RGB & L base supervised technique is used. The statistical method in use for the previous studies of land use land cover classification is the maximum likelihood classifier. Nowadays, various studies have applied artificial intelligence techniques as substitutes to remotely sensed image classification applications. In addition, diverse ensemble classification method has been proposed to significantly improve classification accuracy. Scientists and practitioners have made great efforts in developing efficient classification approaches and techniques for improving classification accuracy. The image quality of a supervised classification [3] depends on the quality of the training sites. All the supervised classifications usually have a sequence of operations that must be followed.
Defining of the Training Sites.
Extraction of Signatures.
Classification of the Imagery
The training sites are done with digitized features. Usually two or three training sites are selected. The more training site is selected, the better results can be gained. This procedure assures both the accuracy of classification and the true interpretation of the results. After the training site areas are digitized then the statistical characterizations of the information are created. These are called Signatures. Finally the classification methods are applied. At present, there are different image classifications procedures are used for different purposes by various researchers. These techniques are distinguished in two main ways as supervised and unsupervised classifications. Additionally, supervised classification has different sub classification methods, which are named as parallelepiped, maximum likelihood and minimum distances. These methods are named as Hard Classifier. In this work RGB& L Base method is used for supervised classification methods. Its result and performance given below.
4.4. Identifying the Classes Categories
After picking up pixel and splitting up channels, each channel must be compared with the channels of each groups training data. On examining that the pixel value contains the value of training data, we consider the following constraints.
Hills
Water Body
Settlement
Wetland](https://image.slidesharecdn.com/f49064449-141021040827-conversion-gate01/75/Performance-of-RGB-and-L-Base-Supervised-Classification-Technique-Using-Multispectral-Satellite-Imagery-3-2048.jpg)
![Mr. S Thirunavkkarsu Int. Journal of Engineering Research and Applications www.ijera.com
ISSN : 2248-9622, Vol. 4, Issue 9( Version 6), September 2014, pp.44-49
www.ijera.com 47 | P a g e
If each channel has the accurate values as the
training data, then it must signature file.
If each channel or any of them fails to prove, to
be the exact values in the signature value then
the pixel‟s values must be compared with the
abide color values form the color of the group.
If in, the pixel a value does not matches any of
the above conditions then the pixel is labeled
to be an “unknown” pixel and must start
comparing again with next class.
Assessment of a pixel must run until a category is
found for a pixel or all the class found unmatched for
the pixel.
4.5. Display the Result
After all the pixels were examined, we can display
the result. With the result, we can easily plot
classified map imagery, according to the supervised
classes. All the unknown pixels from this plotting will
be the borders of the category specified in any way
and we can easily draw the borders of each group
without any fail.
V. RESULT AND DISCUSSION
The main aim of the study is to evaluate the
performance of the different classification algorithms
using the multispectral data. This is implemented with
ERDAS Imaging 2014 [14]. In a similar way, the
classification algorithms can be applied for the
multispectral data [15].
There are three existing classification method
classified and tested in unclassified satellite Imagery.
Beginning of the classification, Analysts could not
locate which is water body, hills, crop, fallow and
other classes. The satellite unclassified imagery
shown in above fig.3.
5.1. Proposed Classification Algorithm
Fig. 5. Classified imagery for RGB & L Based Method
5.2. Maximum Likelihood Classification
Algorithm
First the unclassified satellite imagery was tested
with maximum likelihood classification technique.
This Classification uses the training data by means of
estimating means and variances of the classes, which
are used to estimate probabilities and also consider the
variability of brightness values in each class.
Fig. 6. Classified imagery for Maximum Likelihood Method
This classifier is based on Bayesian probability
theory. It is the most powerful classification methods
when accurate training data is provided and one of the
most widely used algorithm. The classified imagery is
shown in above figure 6.
The Maximum Likelihood classification is
calculated as:
ln ( 1) 1
i
t
i i v
y y
d x v
Where di denote as distance between feature vector
(x) and a class mean (mi) based on probabilities, vi
denote as the n x n variance-covariance matrix of
class i, where n is the number of input bands, y denote
as x - mi; is the difference vector between feature
vector x and class mean vector mi and yt denote as the
transposed of y.
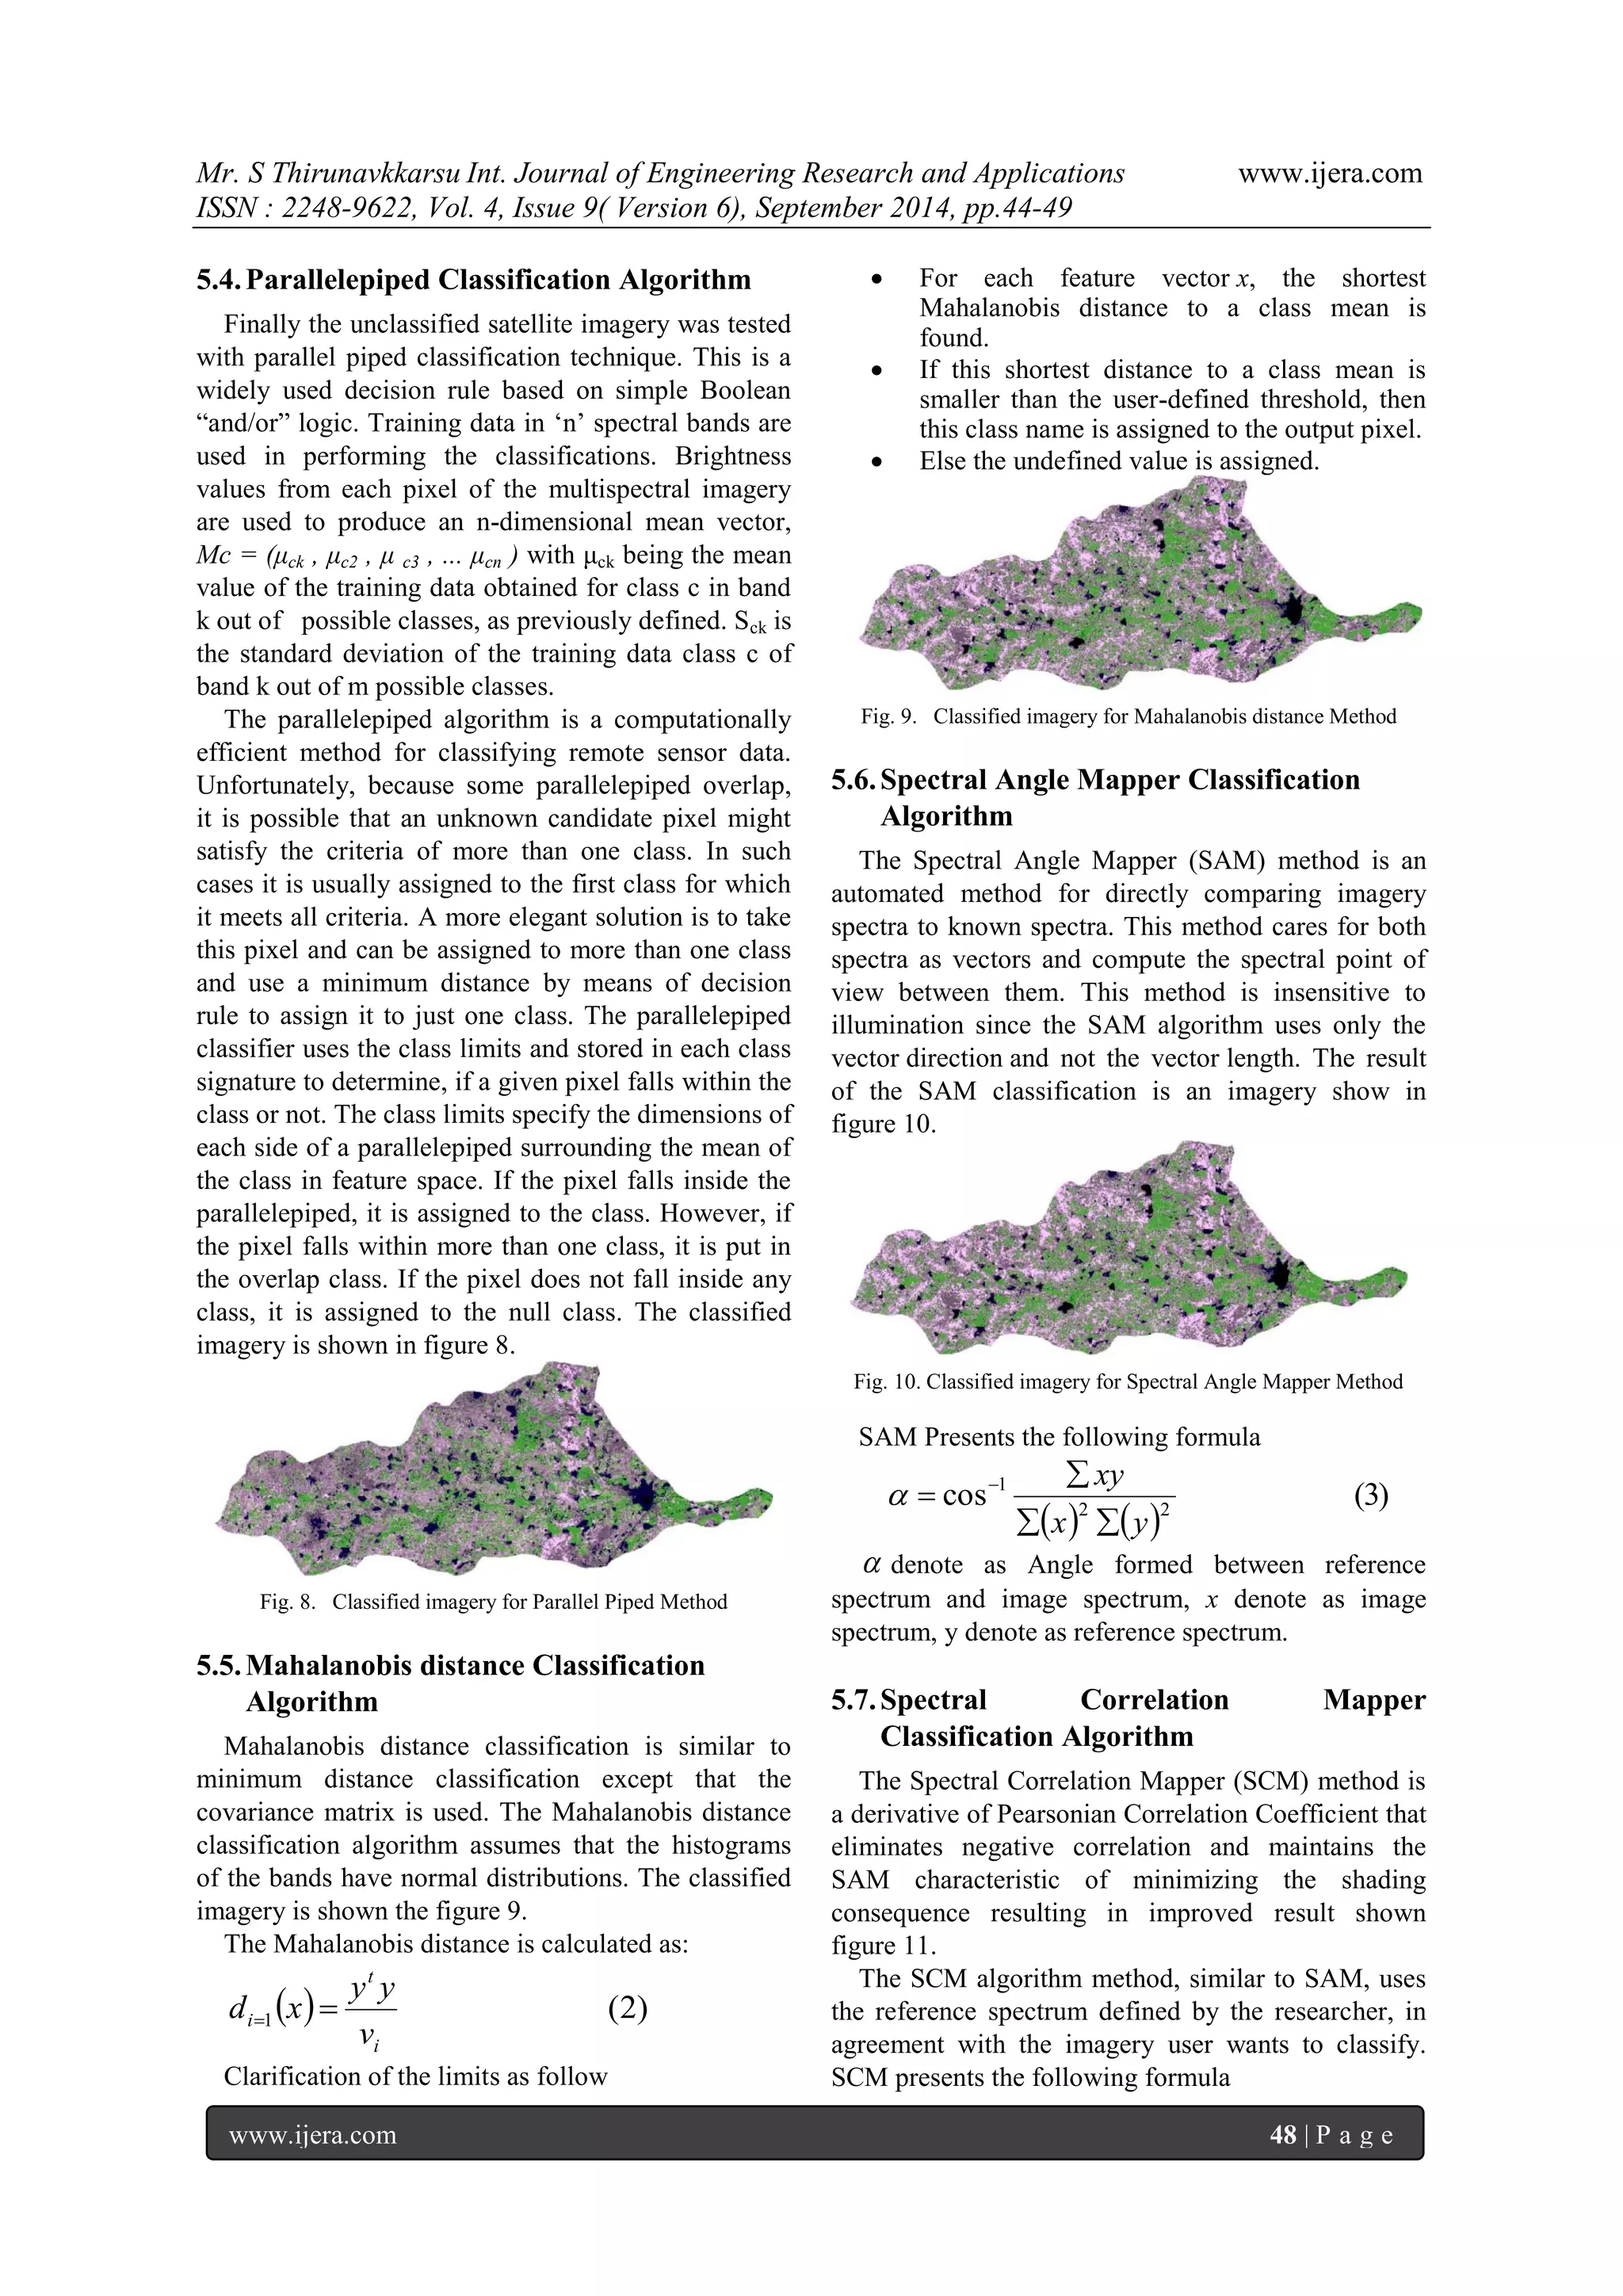
5.3. Minimum Distance Classification
Algorithm
Second the unclassified satellite imagery was tested
with minimum Distance classification technique. It is
based on the minimum distance decision rule that
calculates the spectral distance between the
measurement vector for the imagery pixel and the
mean vector for each sample. Then it assigns the
candidate pixel to the class having the minimum
spectral distance. The classified imagery is shown in
figure 7.
Fig. 7. Classified imagery for Minimum Distance Method
For each feature vector, the distances towards
class means are calculated.
The shortest Euclidian distance to a class
mean is found.
If this shortest distance to a class mean is
smaller than the user-defined threshold, then
this class name is assigned to the output pixel.
Else the undefined value is assigned.](https://image.slidesharecdn.com/f49064449-141021040827-conversion-gate01/75/Performance-of-RGB-and-L-Base-Supervised-Classification-Technique-Using-Multispectral-Satellite-Imagery-4-2048.jpg)
![Mr. S Thirunavkkarsu Int. Journal of Engineering Research and Applications www.ijera.com
ISSN : 2248-9622, Vol. 4, Issue 9( Version 6), September 2014, pp.44-49
www.ijera.com 49 | P a g e
(4)
2
1
2 2 2
1
2 2
N x x N y y
N xy x y
R
The function cos (SAM) is similar to the
Pearsonian Correlation Coefficient above equation.
The big difference is that Pearsonian Correlation
Coefficient standardizes the data, centralizing itself in
the mean of x and y.
Fig. 11. Classified imagery for Spectral Correlation Mapper
Method
VI. CONCLUSION
The proposed supervised classification method
gave better accuracy than the other classification
methods. It is observed that the spectral means of the
classes in all bands was improved. The proposed
method compares with existing method namely
Parallelepiped, Maximum Likelihood, Minimum
Distance, Mahalanobis distance, SAM and SCM. If
the result is better, it indicates that the training
samples were spectrally separable and the
classification works well in the study region. This aids
in the training set refinement process, but indicates
little about classifier performance elsewhere in the
scene.
REFERENCES
[1] Ozesmi, Stacy L., and Marvin E. Bauer. "Satellite
remote sensing of wetlands."Wetlands ecology
and management 10.5 (2002): 381-402.
[2] Fukue, Kiyonari, et al. "Evaluations of
unsupervised methods for land‐cover/use
classifications of landsat TM data." Geocarto
International 3.2 (1988): 37-44.
[3] Lu, D., M. Batistella, and E. Moran. "Land‐cover
classification in the Brazilian Amazon with the
integration of Landsat ETM+ and Radarsat
data." International Journal of Remote
Sensing 28.24 (2007): 5447-5459.
[4] Akgün, Aykut, A. Hüsnü Eronat, and Necdet
Turk. "Comparing Different Satellite Image
Classification Methods: An Application In
Ayvalýk District, Western Turkey." XXth
International Congress for Photogrammetry and
Remote Sensing, Istanbul, Turkey. 2004.
[5] Lillesand, Thomas M., Ralph W. Kiefer, and
Jonathan W. Chipman. Remote sensing and
image interpretation. No. Ed. 5. John Wiley &
Sons Ltd, 2004.
[6] Lu, Dengsheng, and Qihao Weng. "A survey of
image classification methods and techniques for
improving classification
performance." International journal of Remote
sensing 28.5 (2007): 823-870.
[7] Story, Michael, and Russell G. Congalton.
"Accuracy assessment-A user's
perspective." Photogrammetric Engineering and
remote sensing 52.3 (1986): 397-399.
[8] Dean, A. M., and G. M. Smith. "An evaluation of
per-parcel land cover mapping using maximum
likelihood class probabilities." International
Journal of Remote Sensing 24.14 (2003): 2905-
2920.
[9] Jasinski, Michael F. "Estimation of subpixel
vegetation density of natural regions using
satellite multispectral imagery." Geoscience and
Remote Sensing, IEEE Transactions on 34.3
(1996): 804-813.
[10] Palaniswami, C., A. K. Upadhyay, and H. P.
Maheswarappa. "Spectral mixture analysis for
subpixel classification of coconut." CURRENT
SCIENCE-BANGALORE- 91.12 (2006): 1706.
[11] Lu, Dengsheng, and Qihao Weng. "A survey of
image classification methods and techniques for
improving classification
performance." International journal of Remote
sensing 28.5 (2007): 823-870.
[12] Landgrebe, David. "On information extraction
principles for hyperspectral data."Purdue
University, West Lafayette, IN, USA (1997): 34.
[13] Govender, M., et al. "A comparison of satellite
hyperspectral and multispectral remote sensing
imagery for improved classification and mapping
of vegetation."Water SA 34.2 (2008): 147-154.
[14] Richason Jr, Benjamin F. "Introduction to remote
sensing of the environment."Introduction to
remote sensing of the environment. (1978).
[15] Richards, John A., and J. A. Richards. Remote
sensing digital image analysis. Vol. 3. Berlin et
al.: Springer, 1999.
[16] Landgrebe, David. "Hyperspectral image data
analysis." Signal Processing Magazine,
IEEE 19.1 (2002): 17-28.](https://image.slidesharecdn.com/f49064449-141021040827-conversion-gate01/75/Performance-of-RGB-and-L-Base-Supervised-Classification-Technique-Using-Multispectral-Satellite-Imagery-6-2048.jpg)

The paper discusses the performance of RGB and L-based supervised classification techniques using multispectral satellite imagery to assess land use and land cover in the Kiliyar sub-basin of the Palar River in Tamil Nadu. It emphasizes remote sensing data and GIS methods to create accurate classifications of different land cover types, employing various classification algorithms including maximum likelihood, minimum distance, and parallel piped classifications. The study aims to enhance the application of multispectral data for environmental monitoring and management through effective image classification techniques.