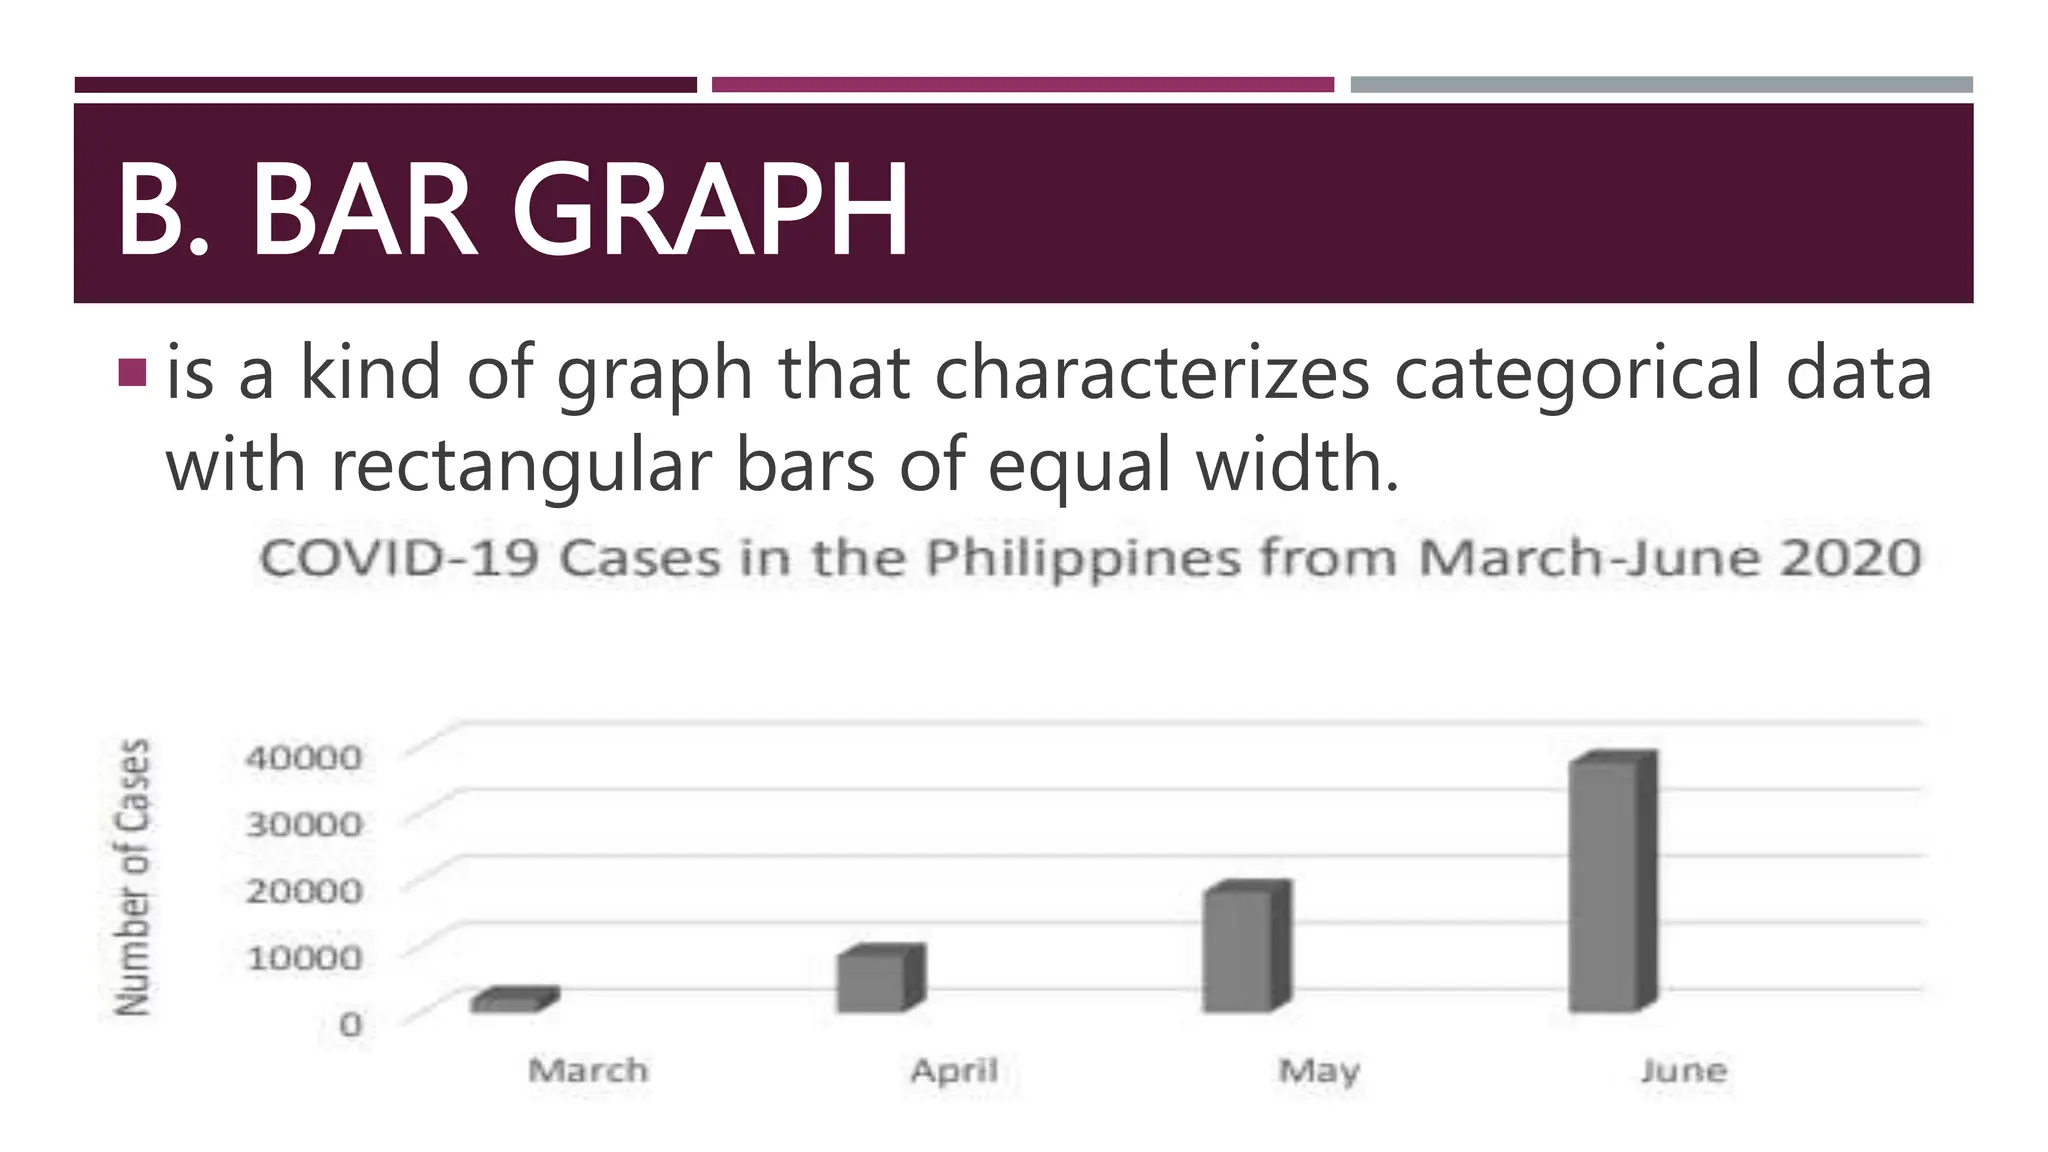
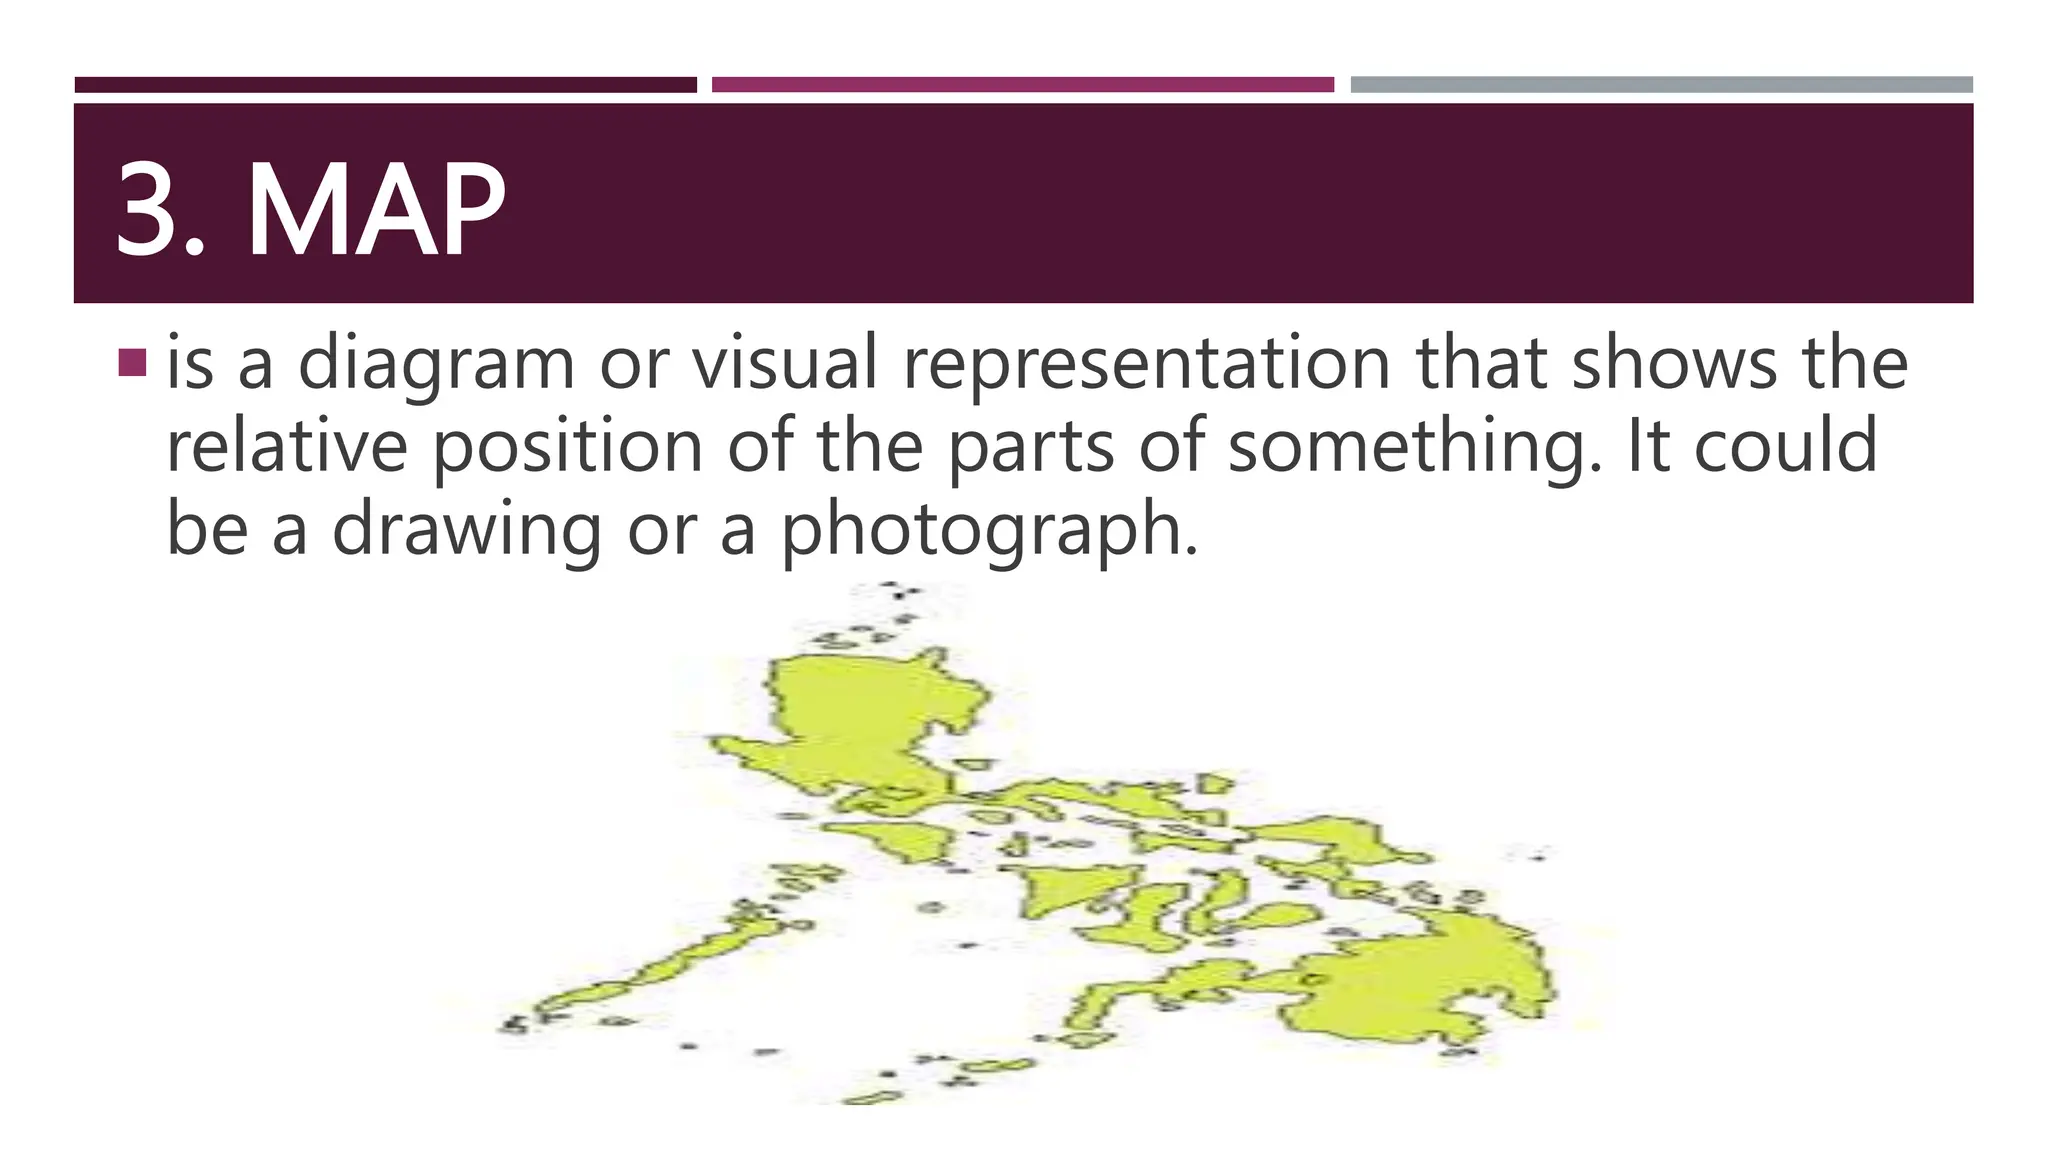
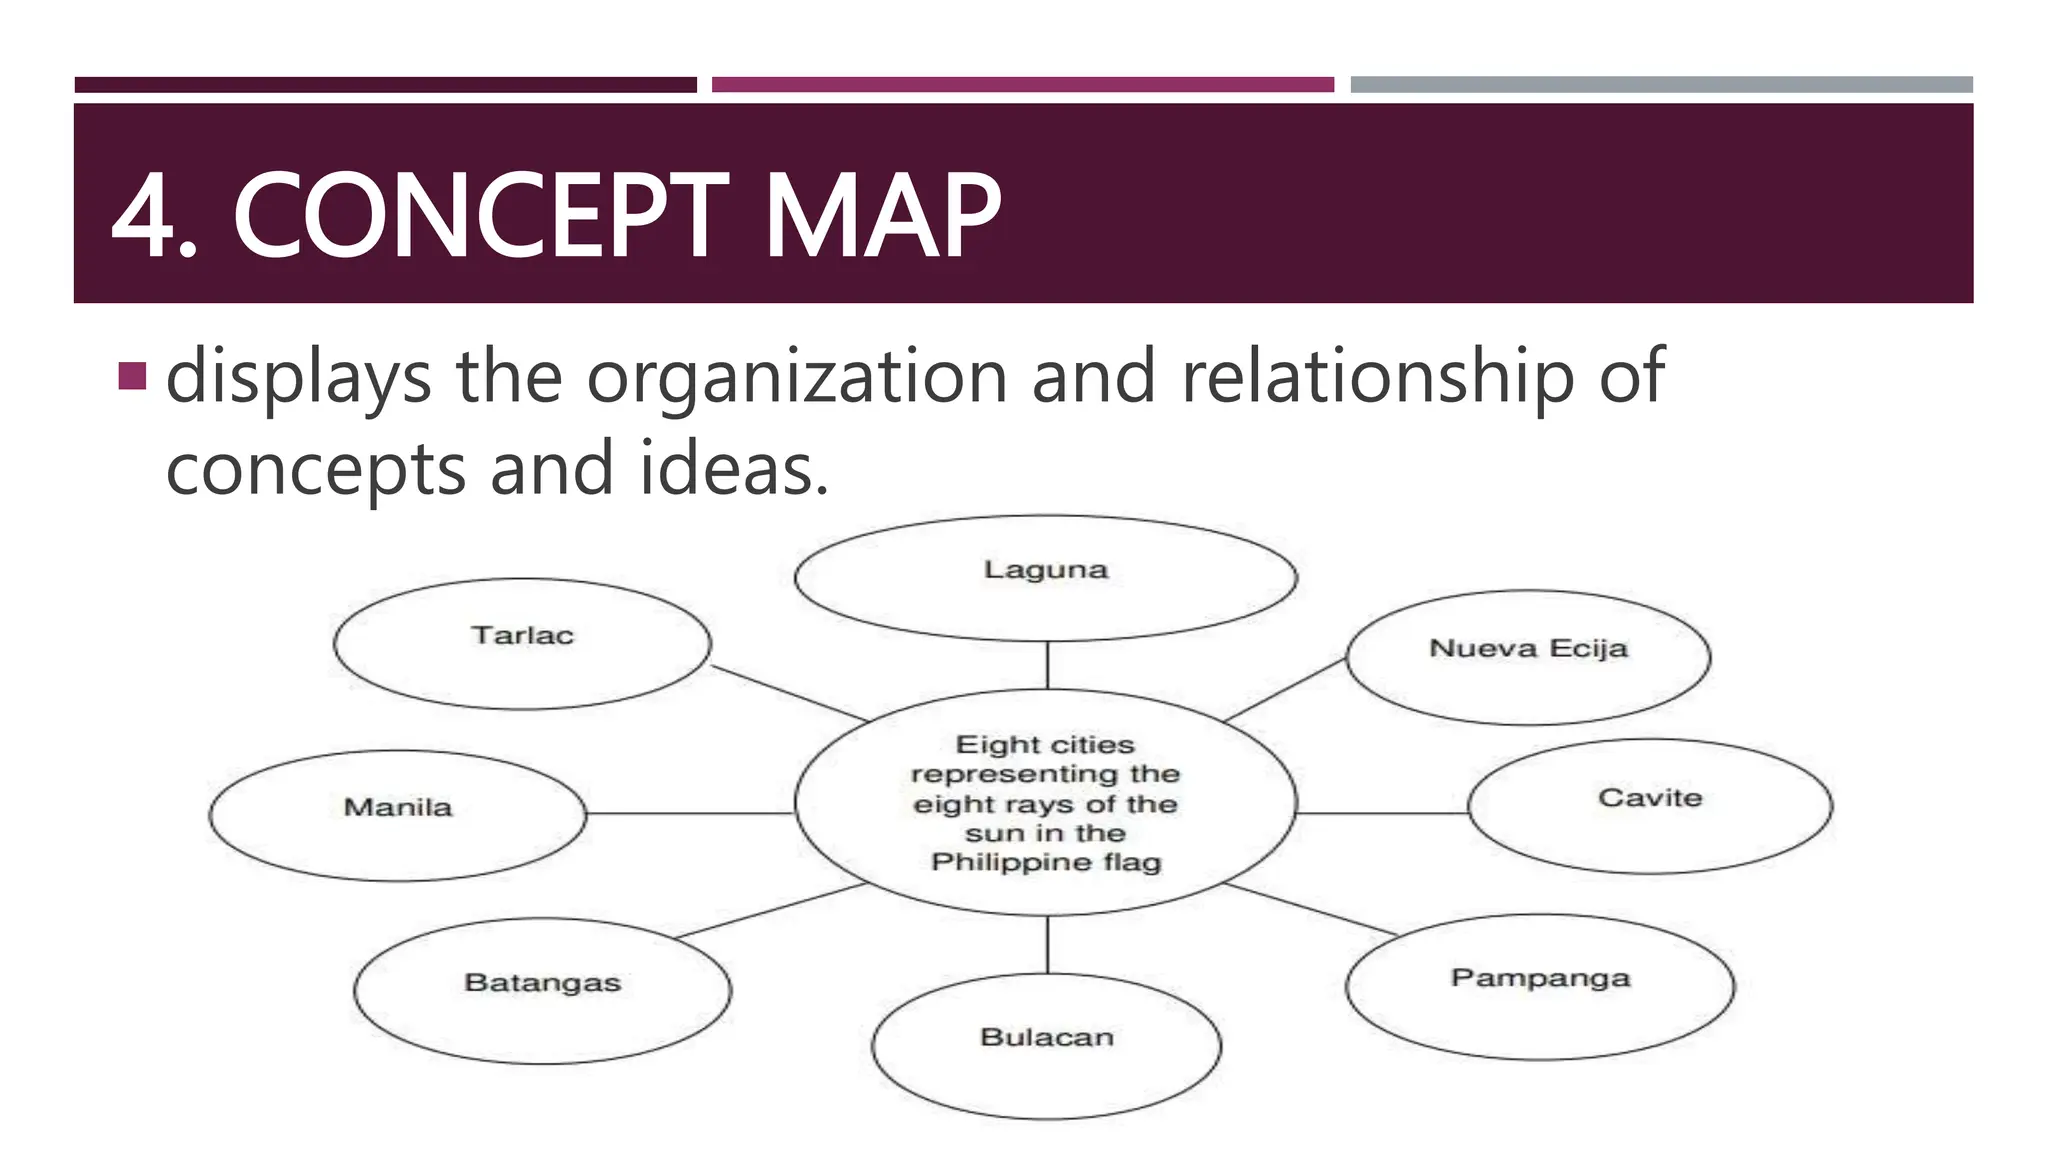
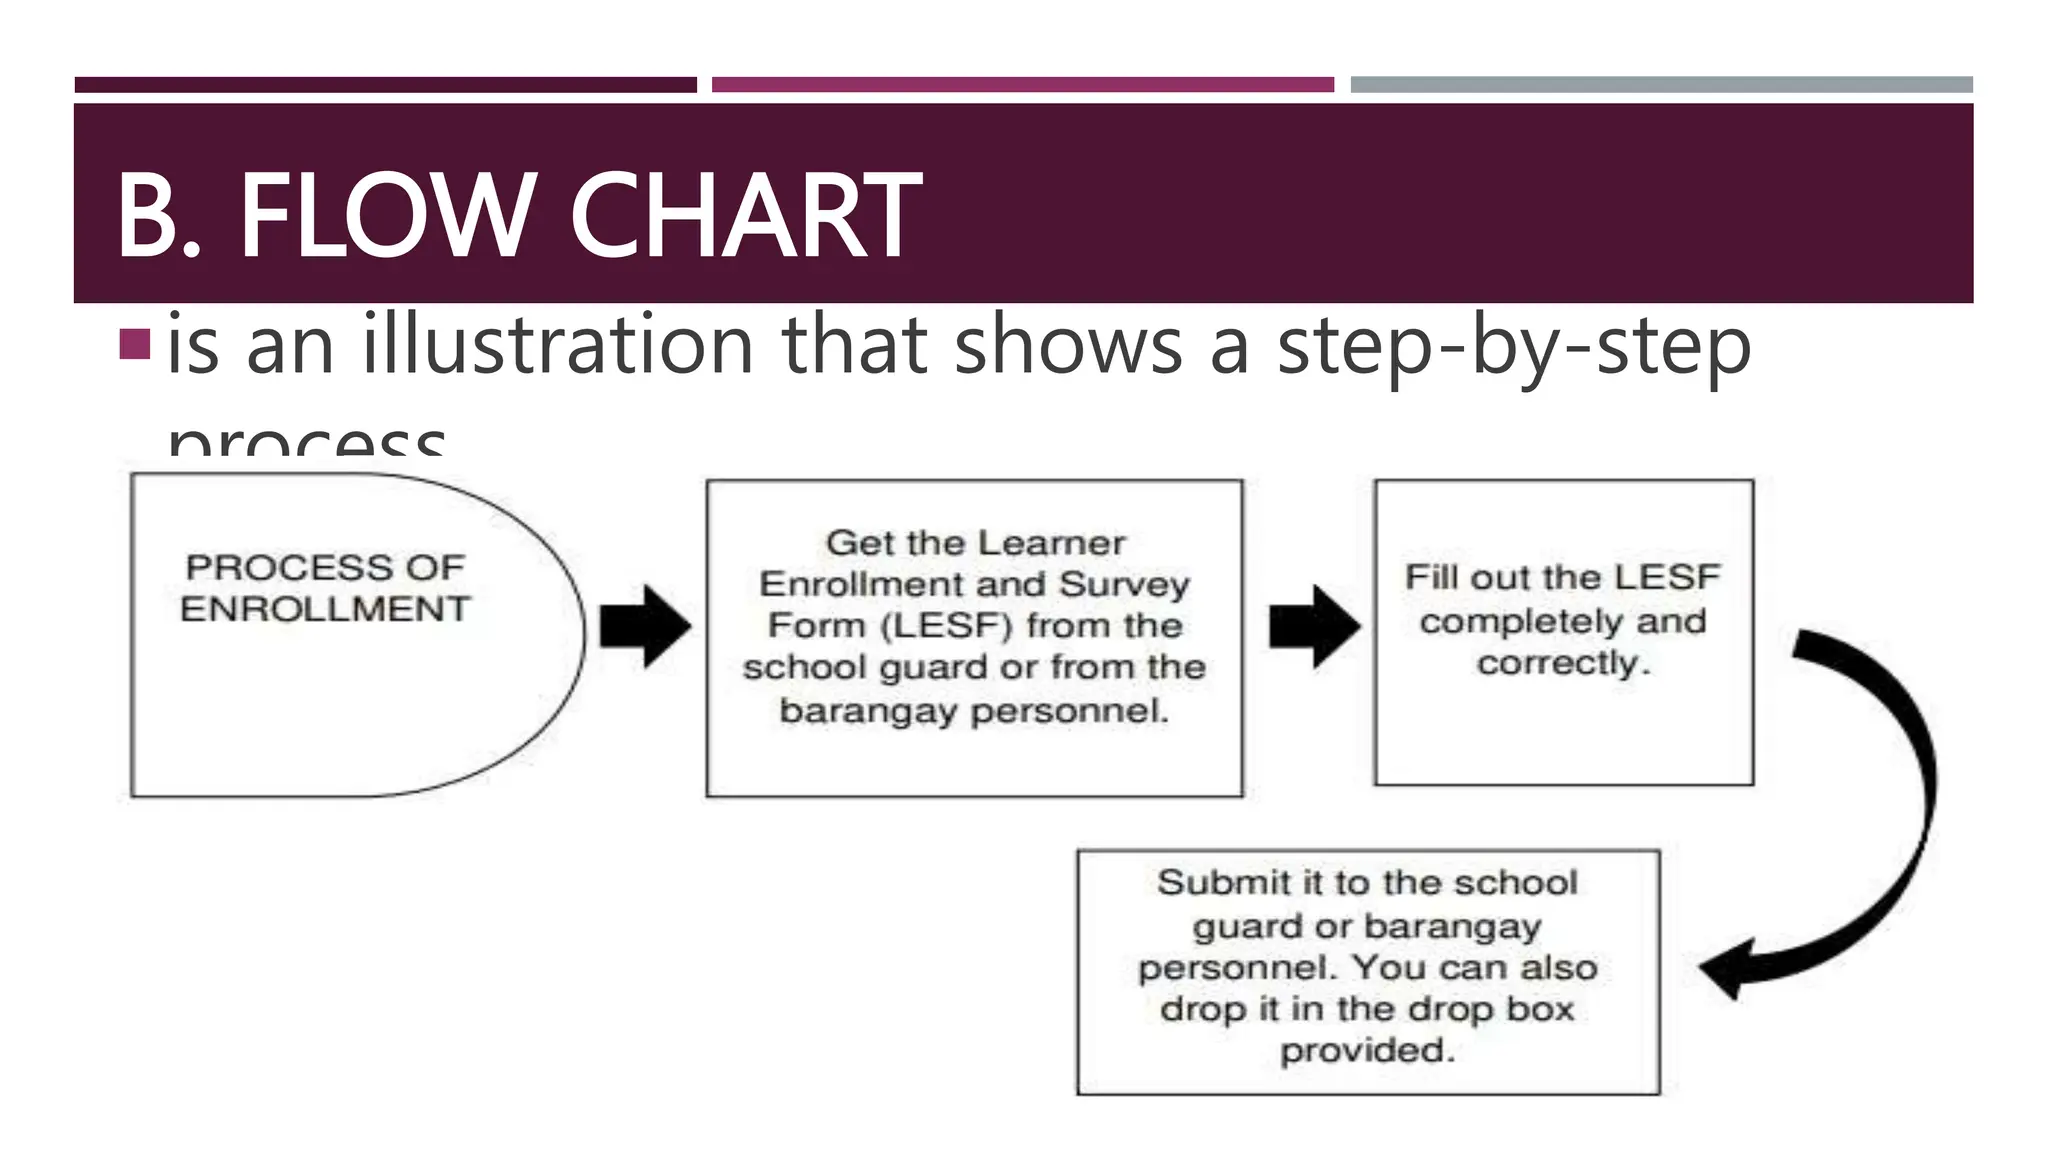
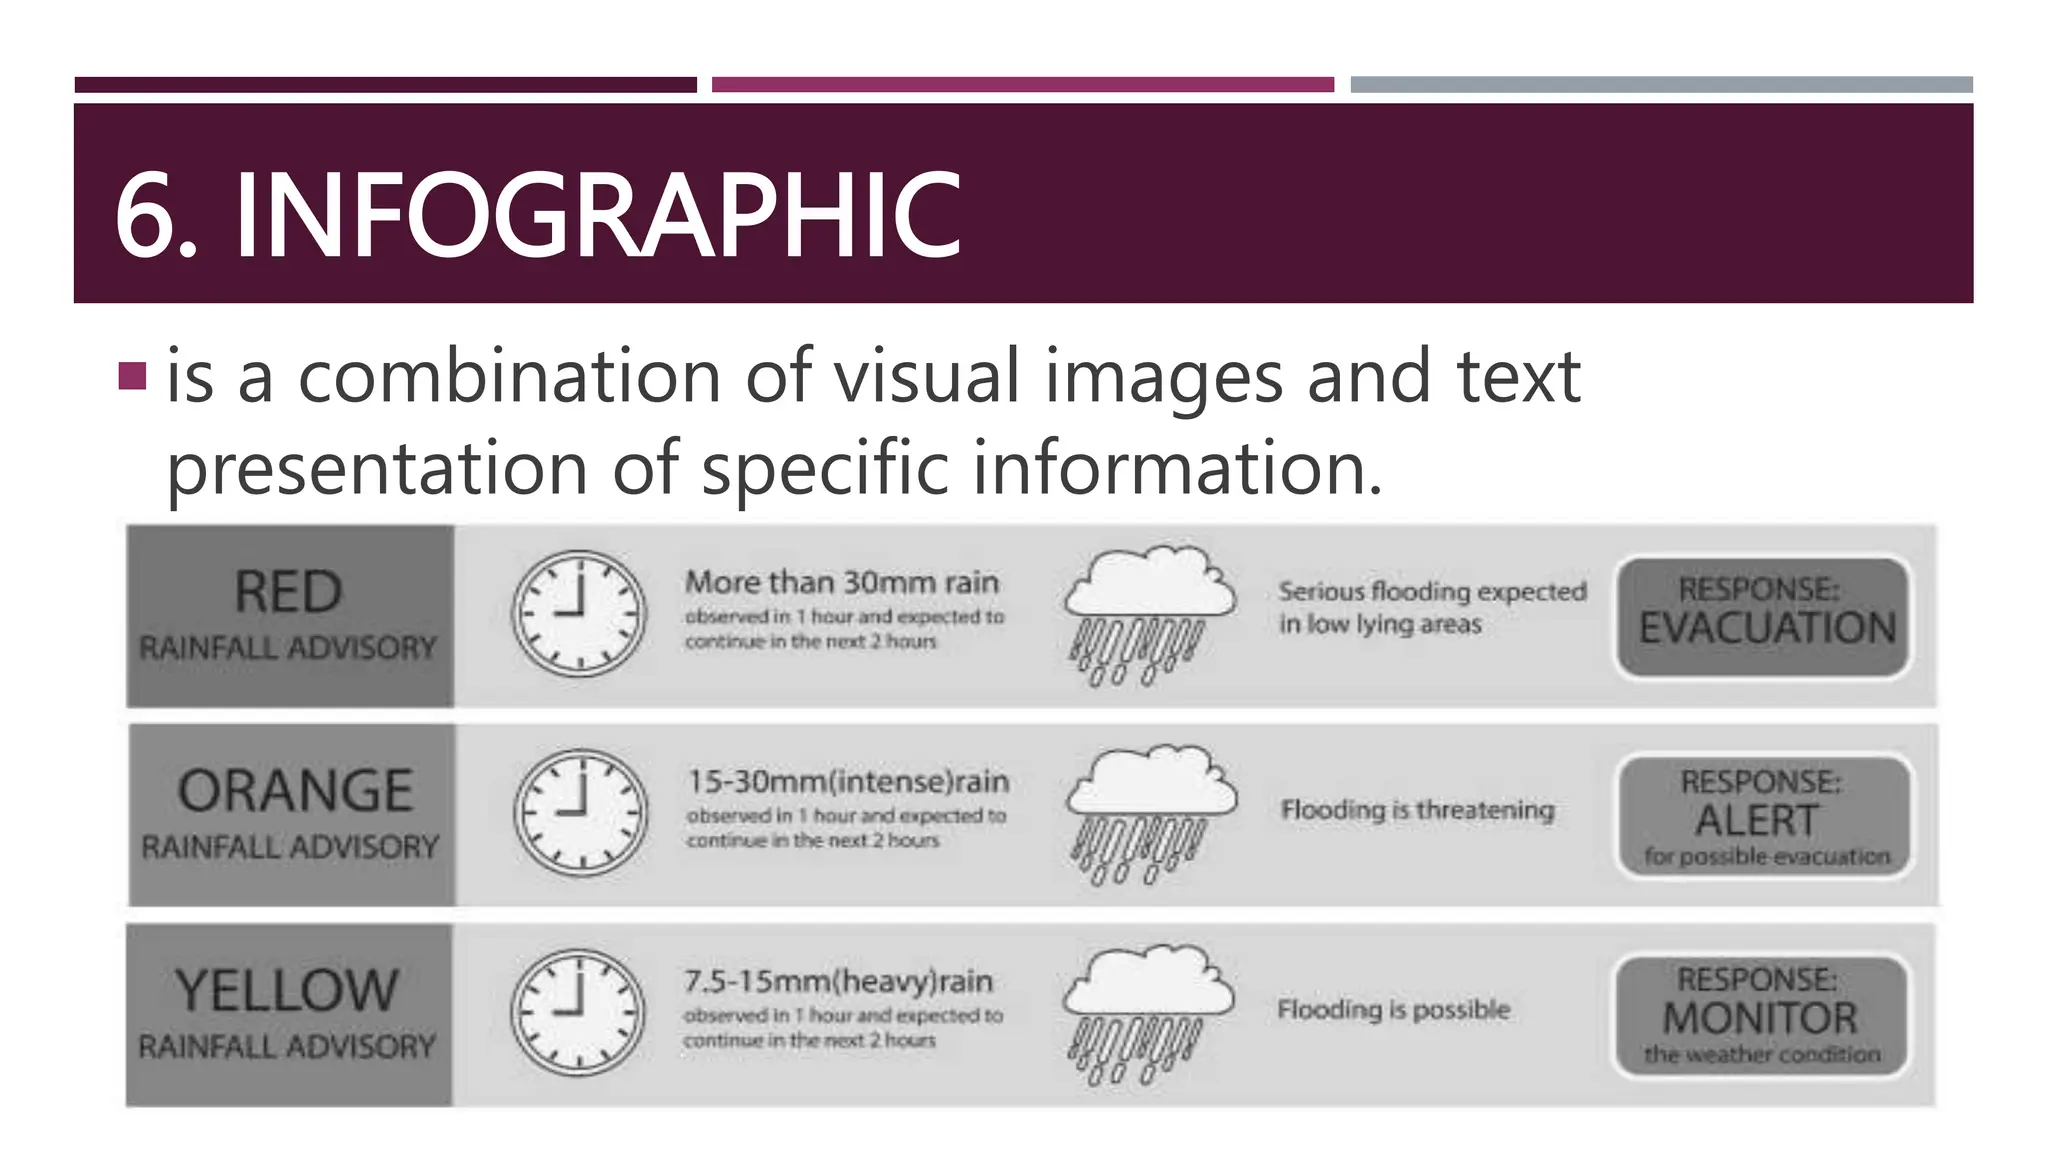
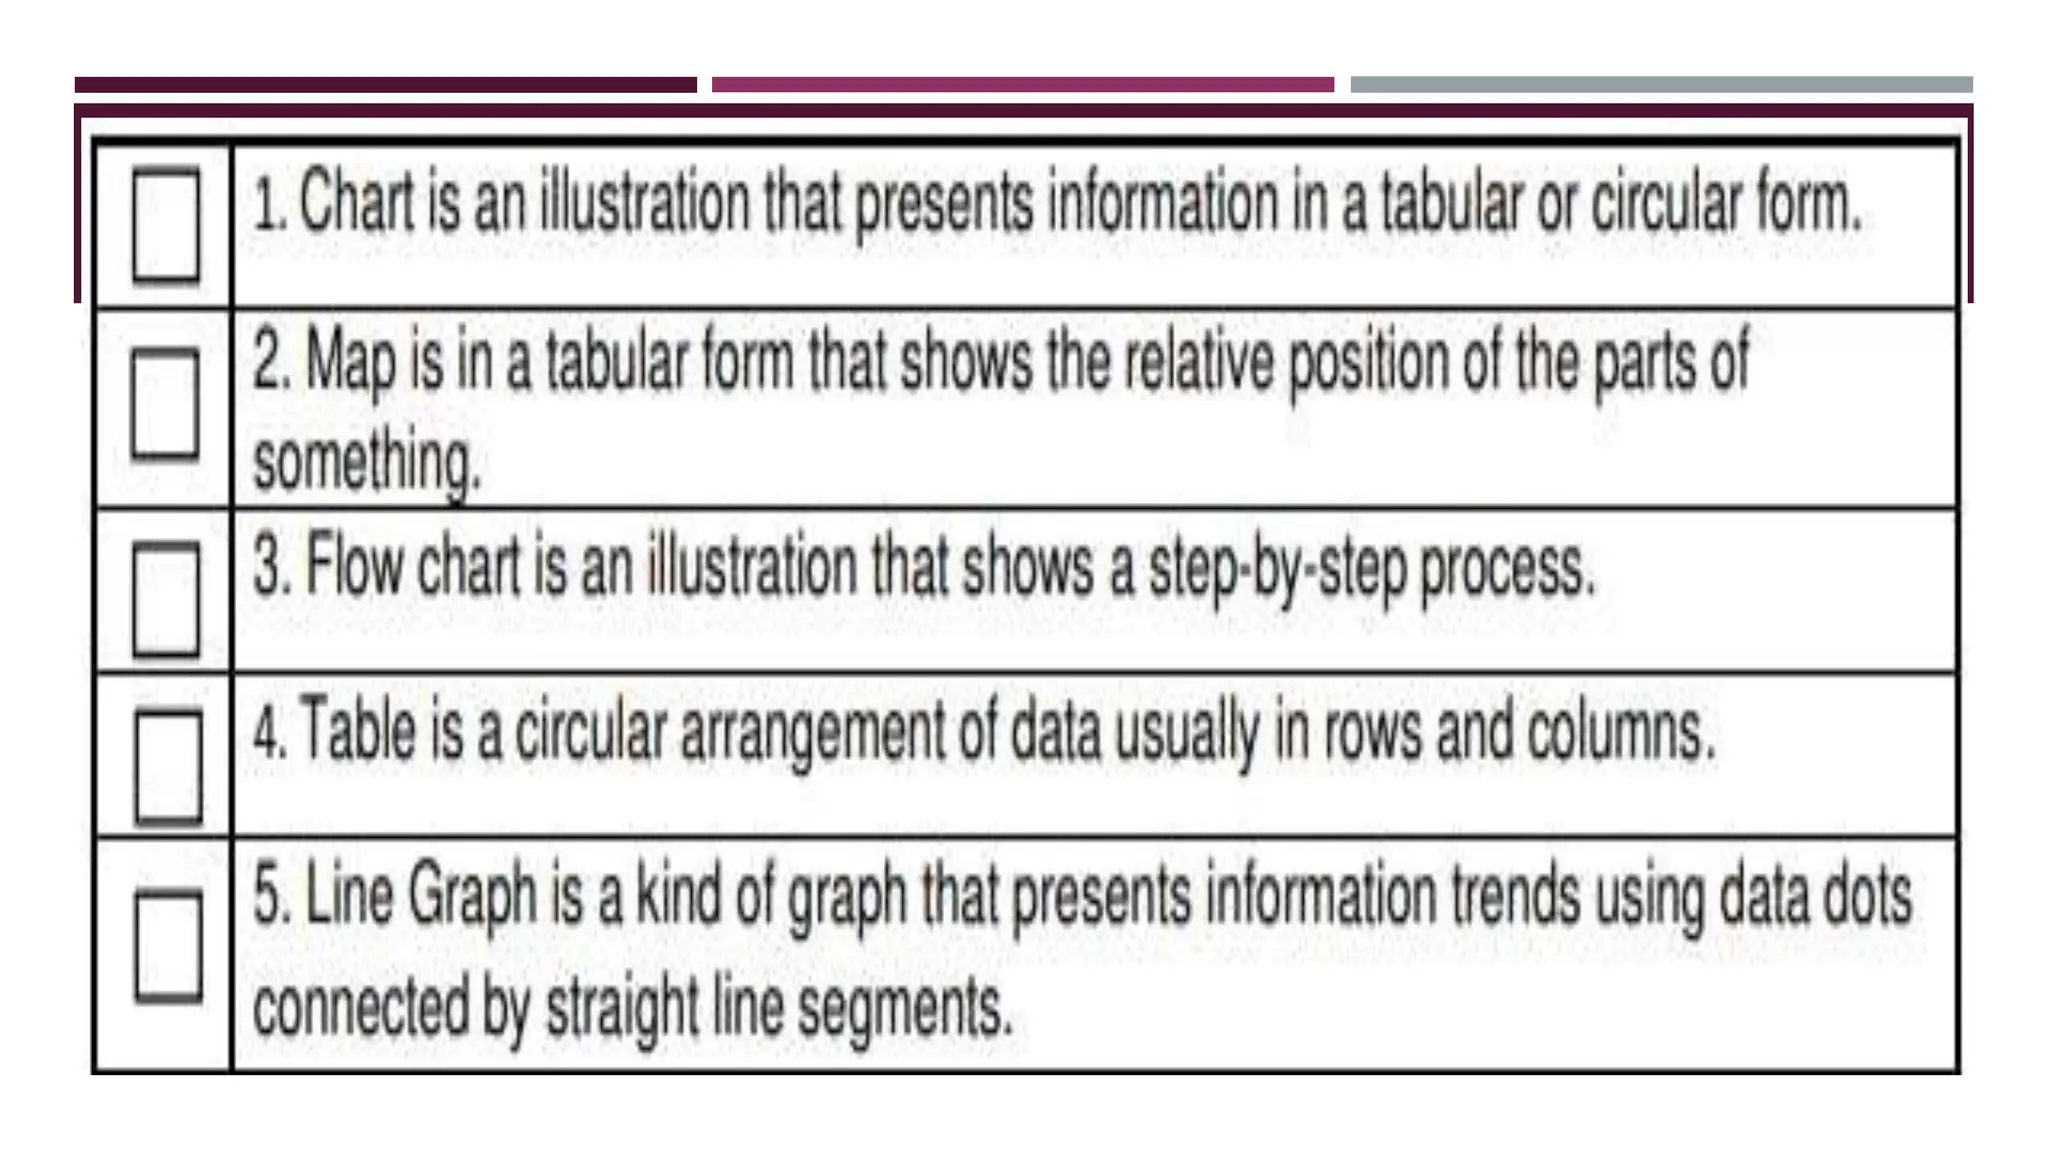
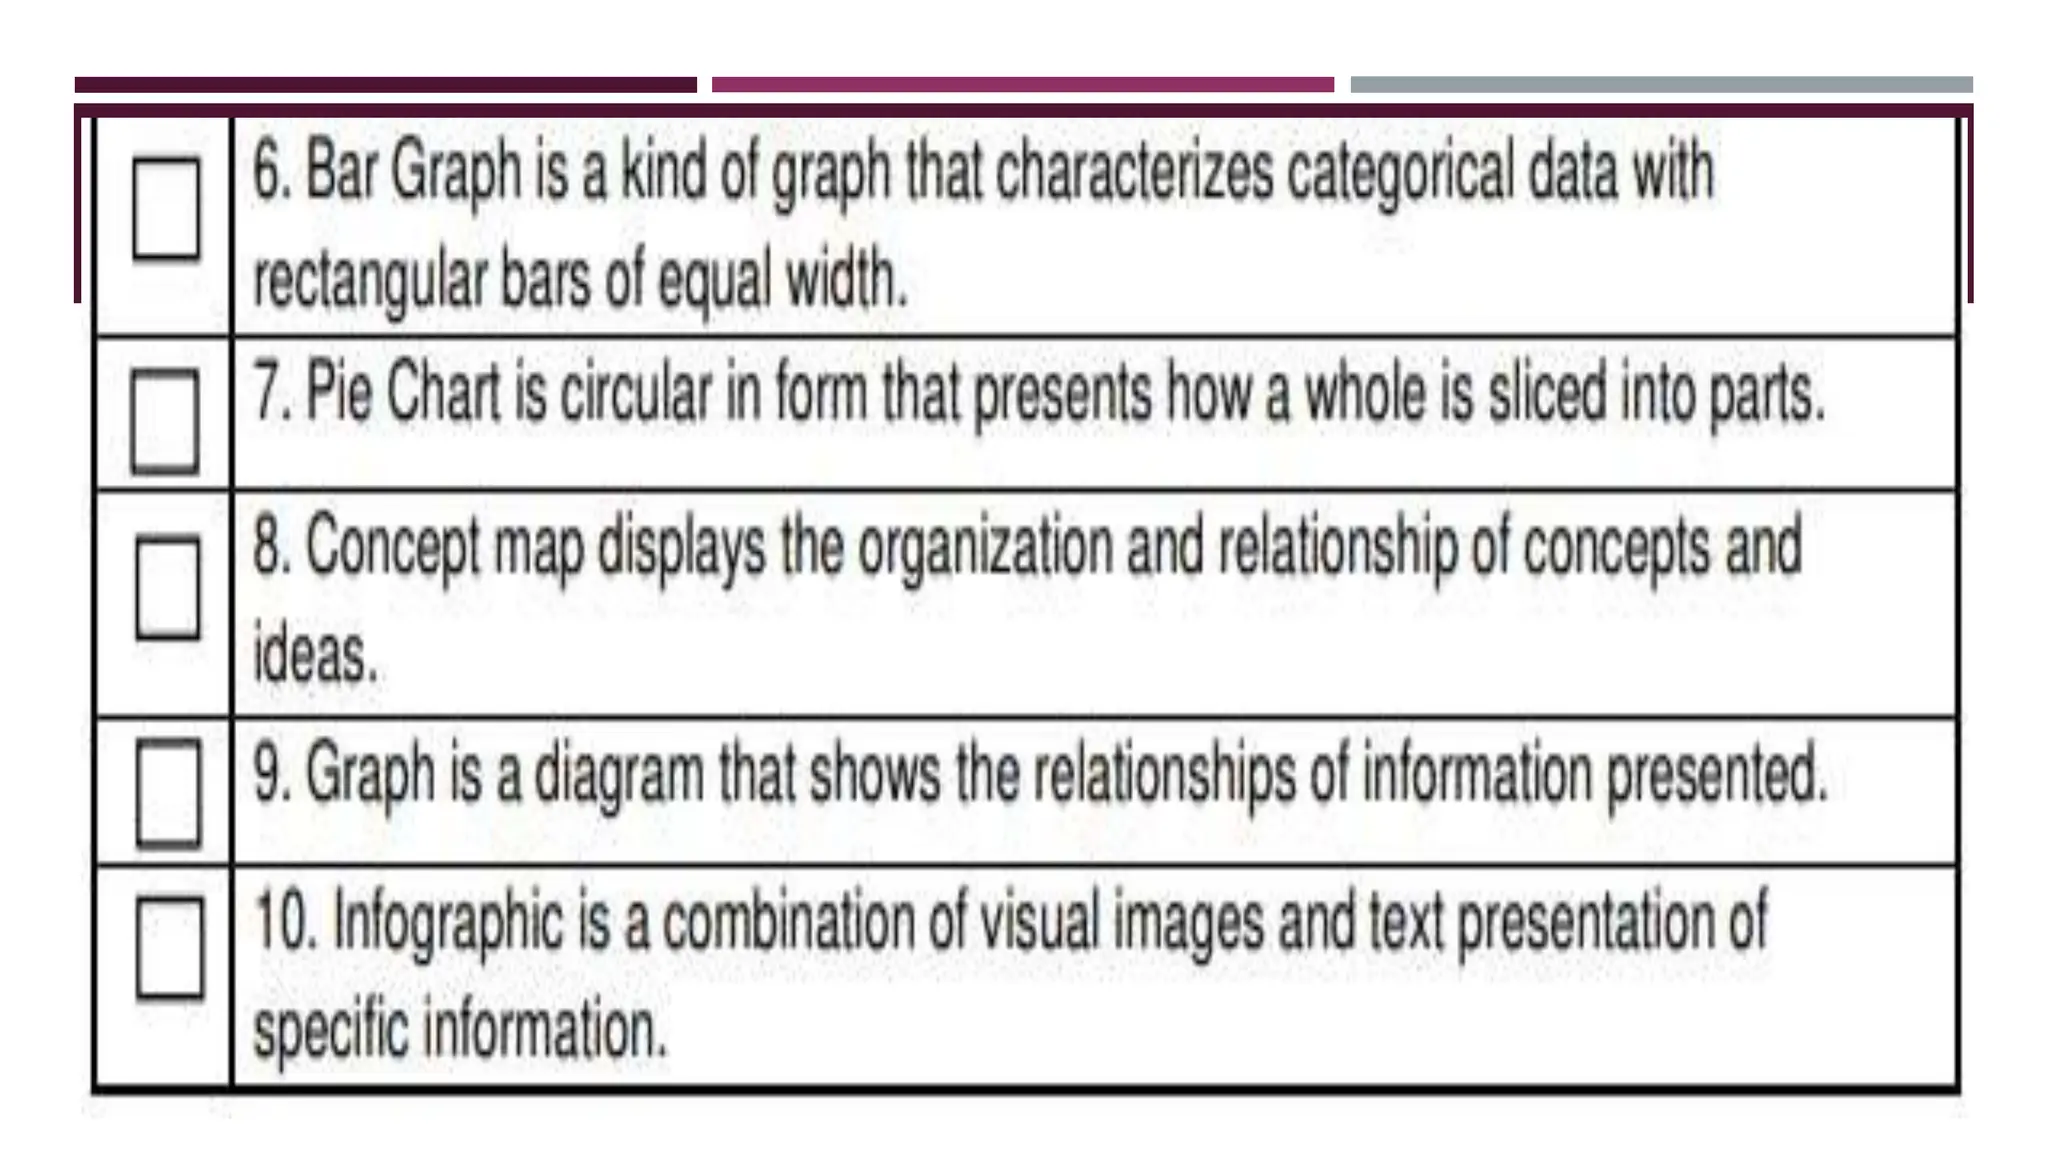
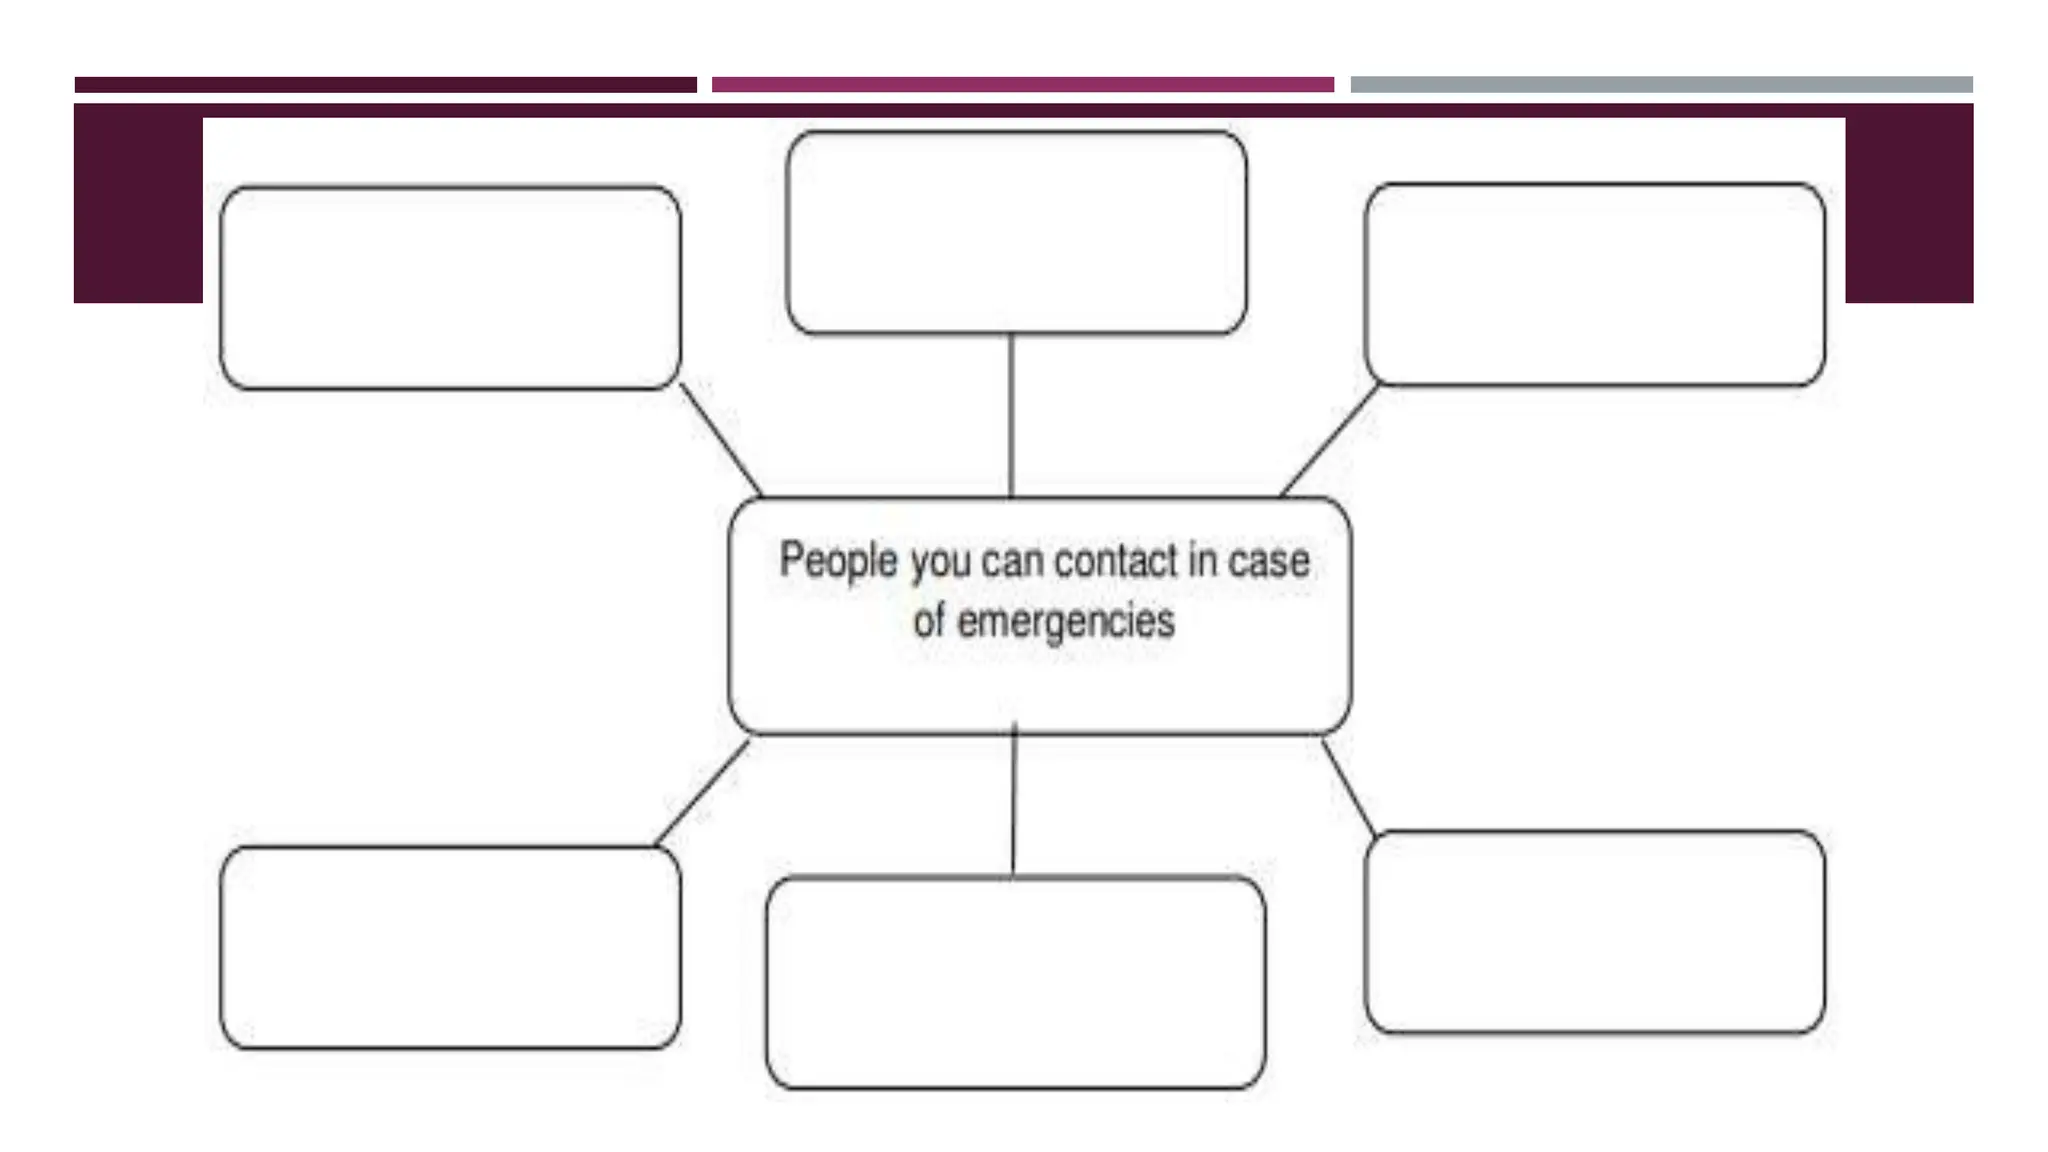
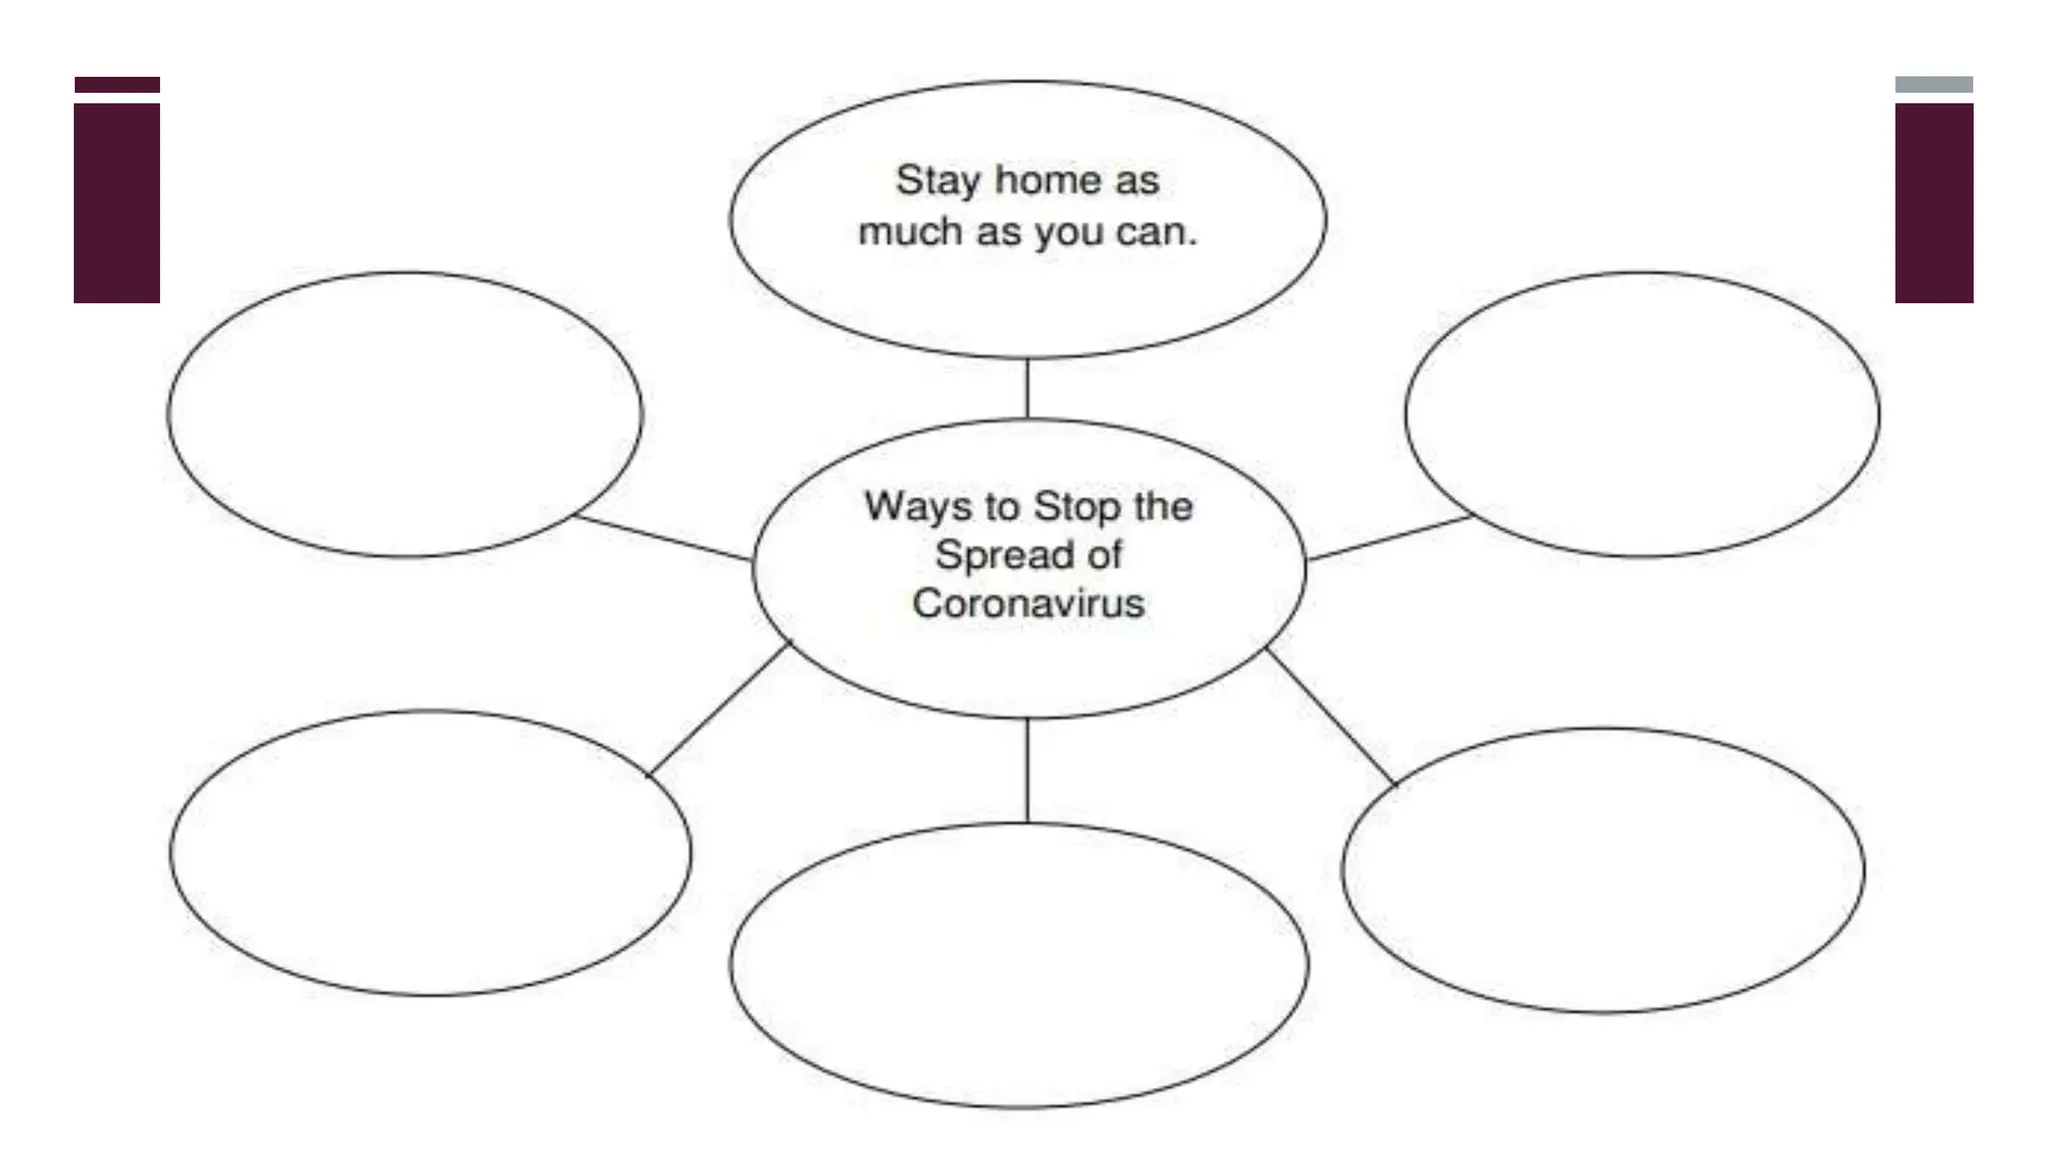
The document provides information about visual-verbal relationships and illustrations through examples of graphs, tables, charts, and concept maps. It explains that visual-verbal illustrations present information simply and engagingly to catch readers' interest. Different types of visual-verbal illustrations are defined, including graphs (line graphs and bar graphs), tables, maps, concept maps, charts (pie charts and flow charts), and infographics. Directions are given to analyze examples by putting checks or X's in boxes to identify true or false statements.