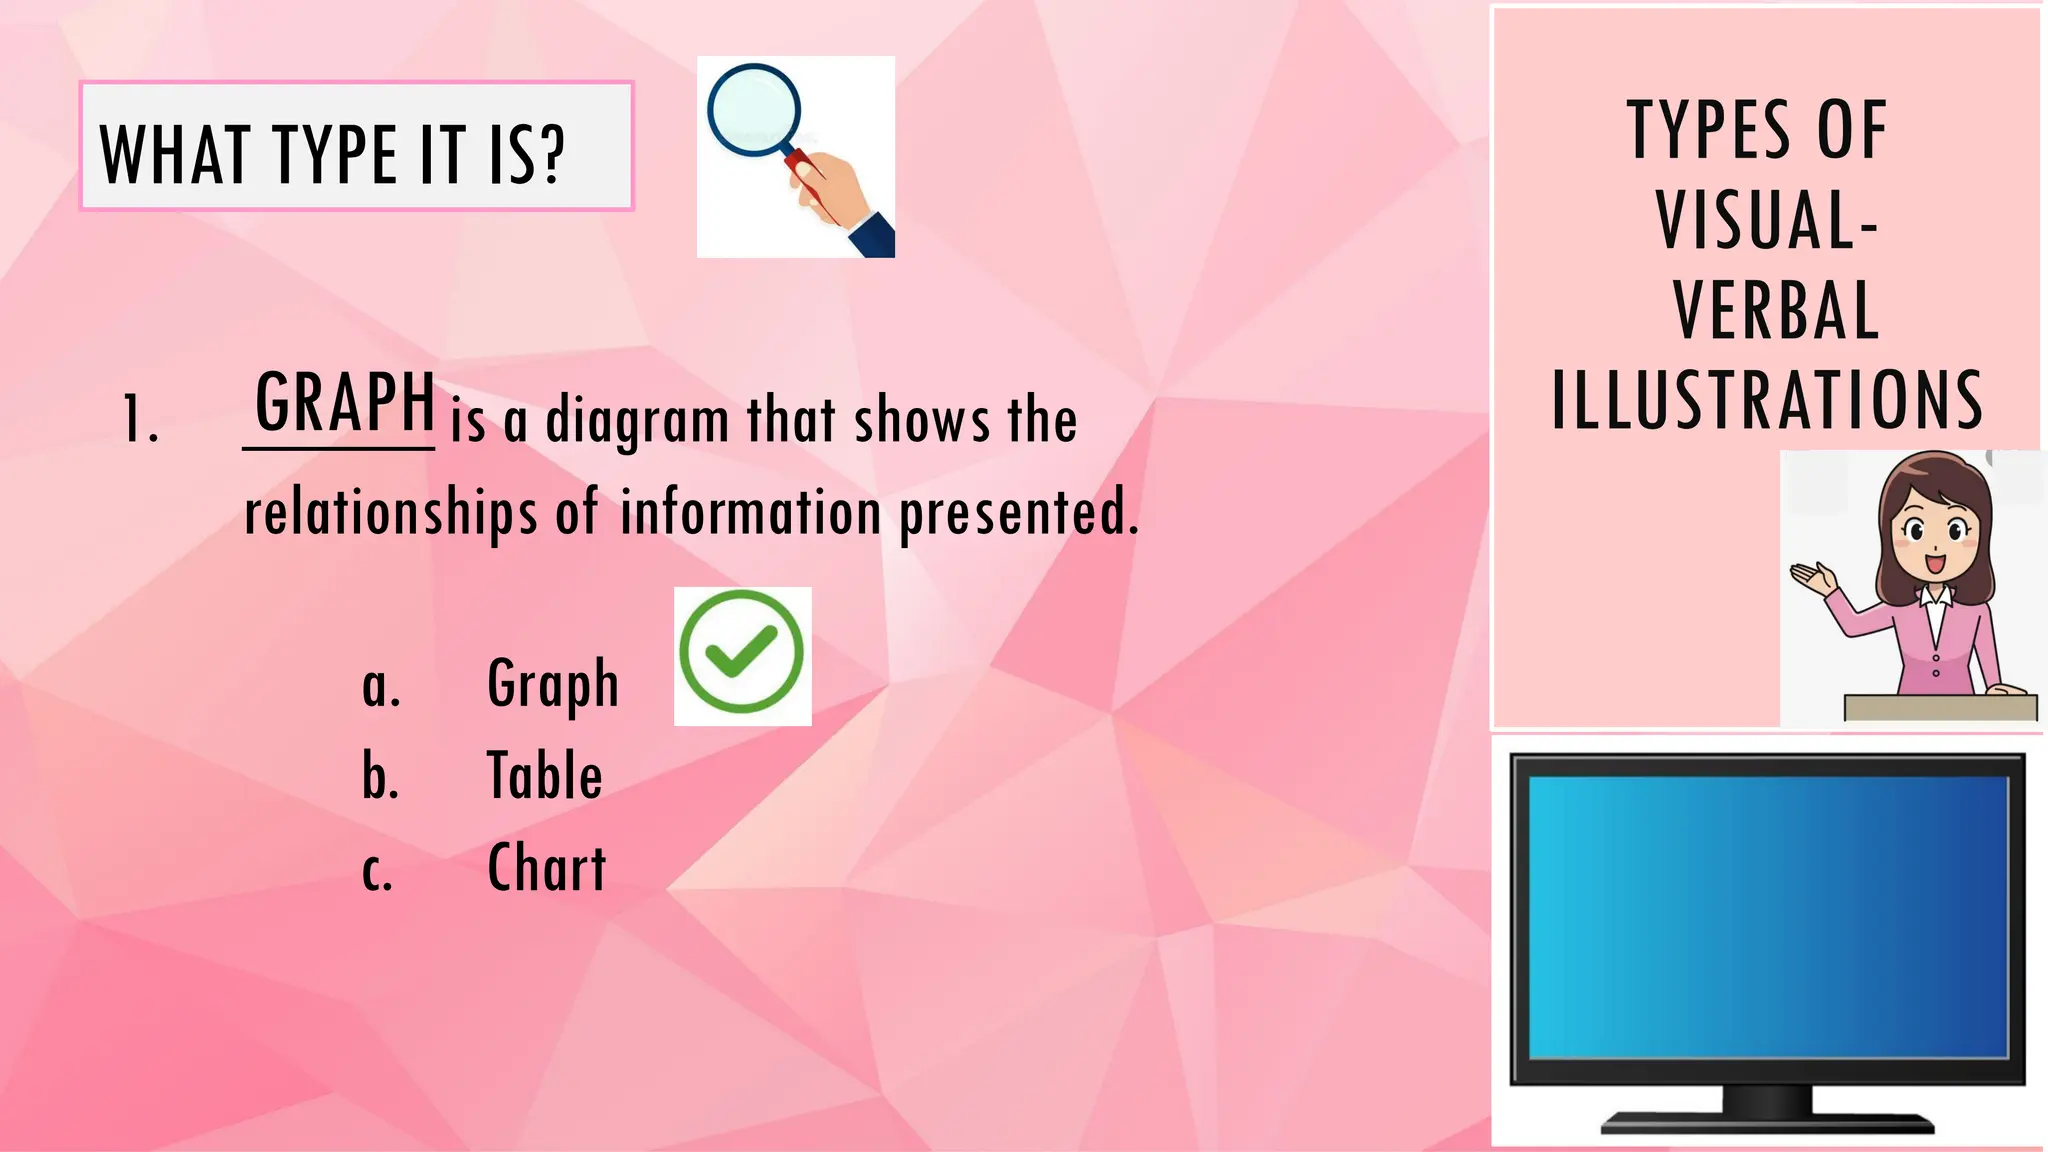
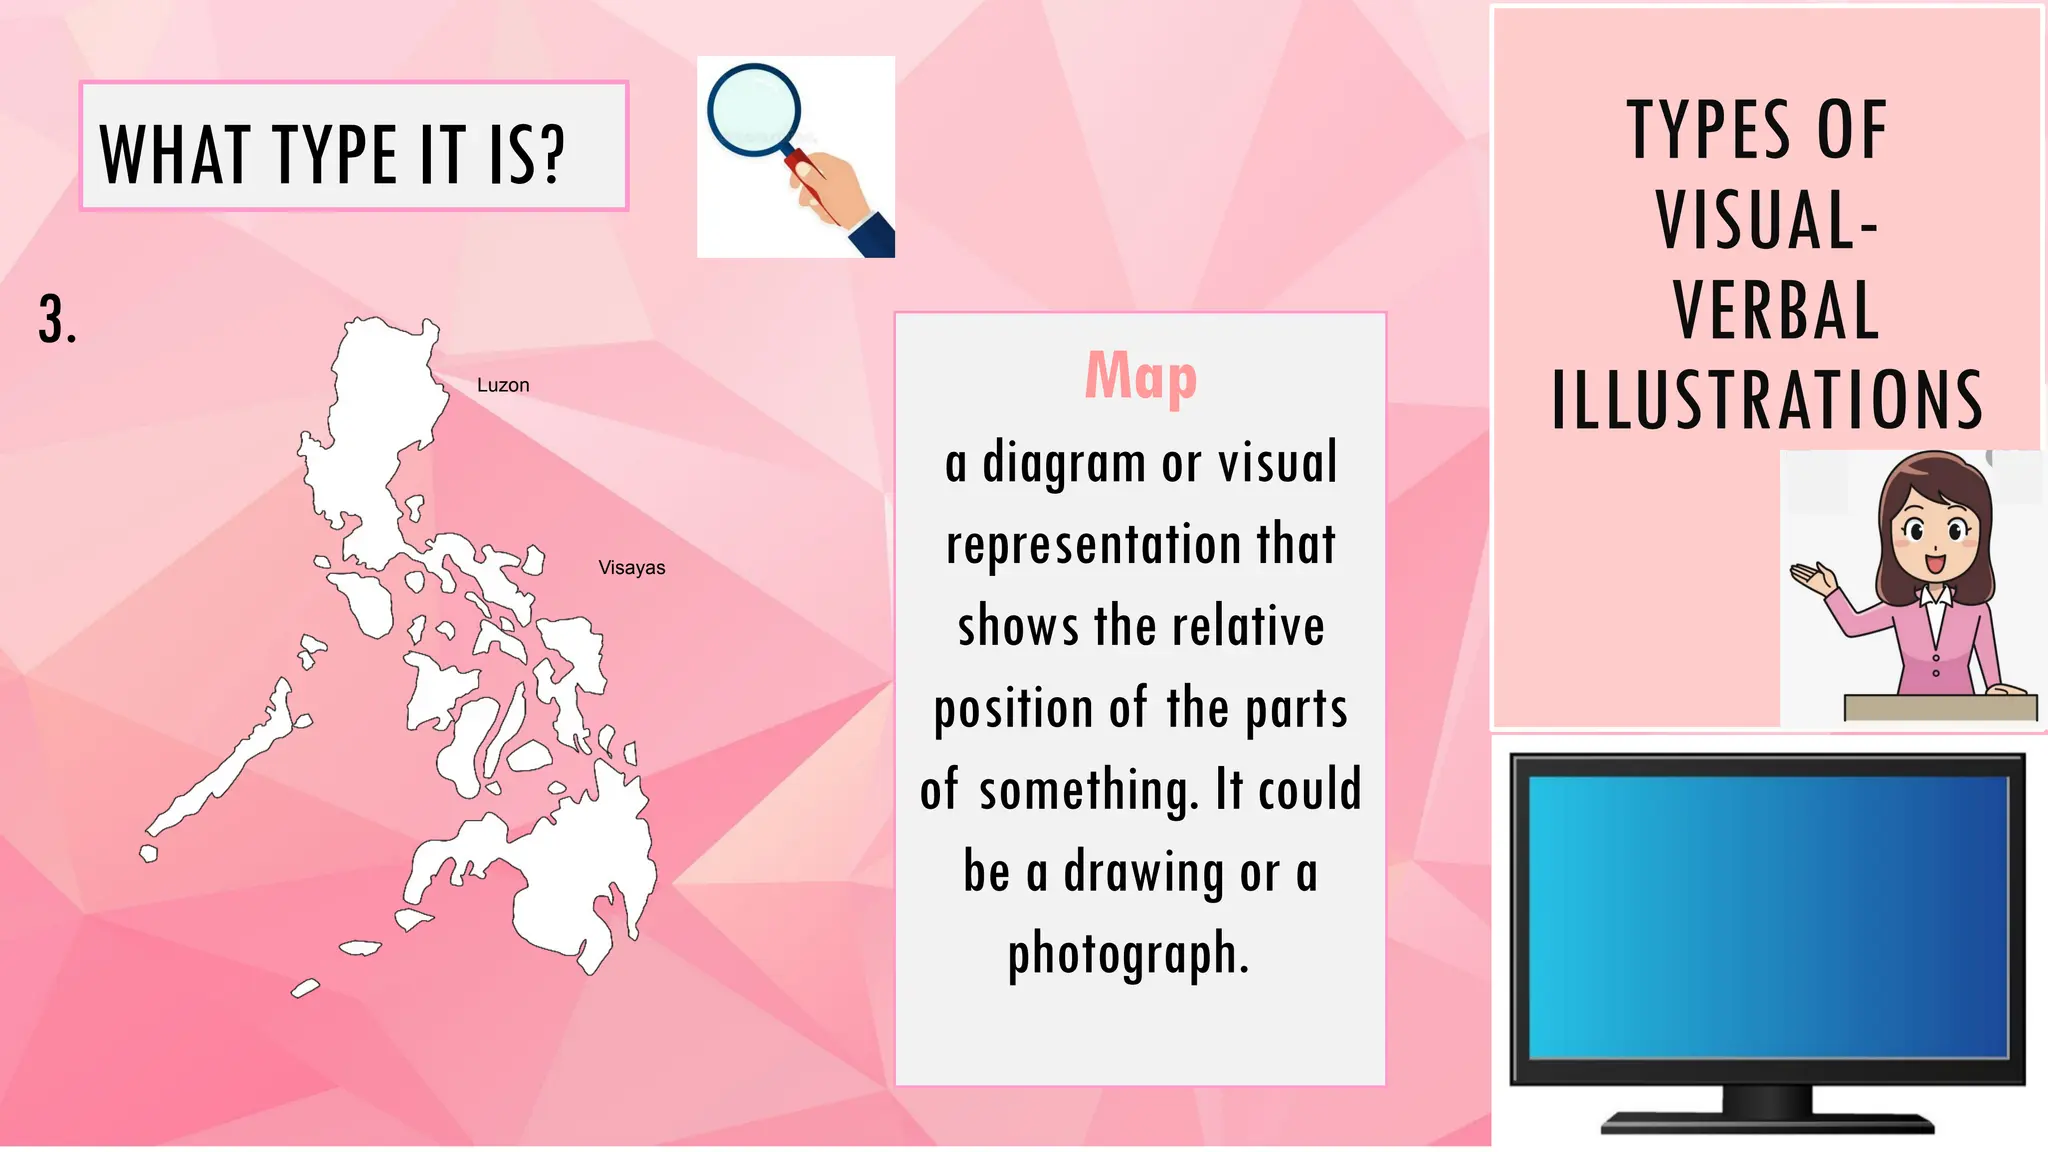
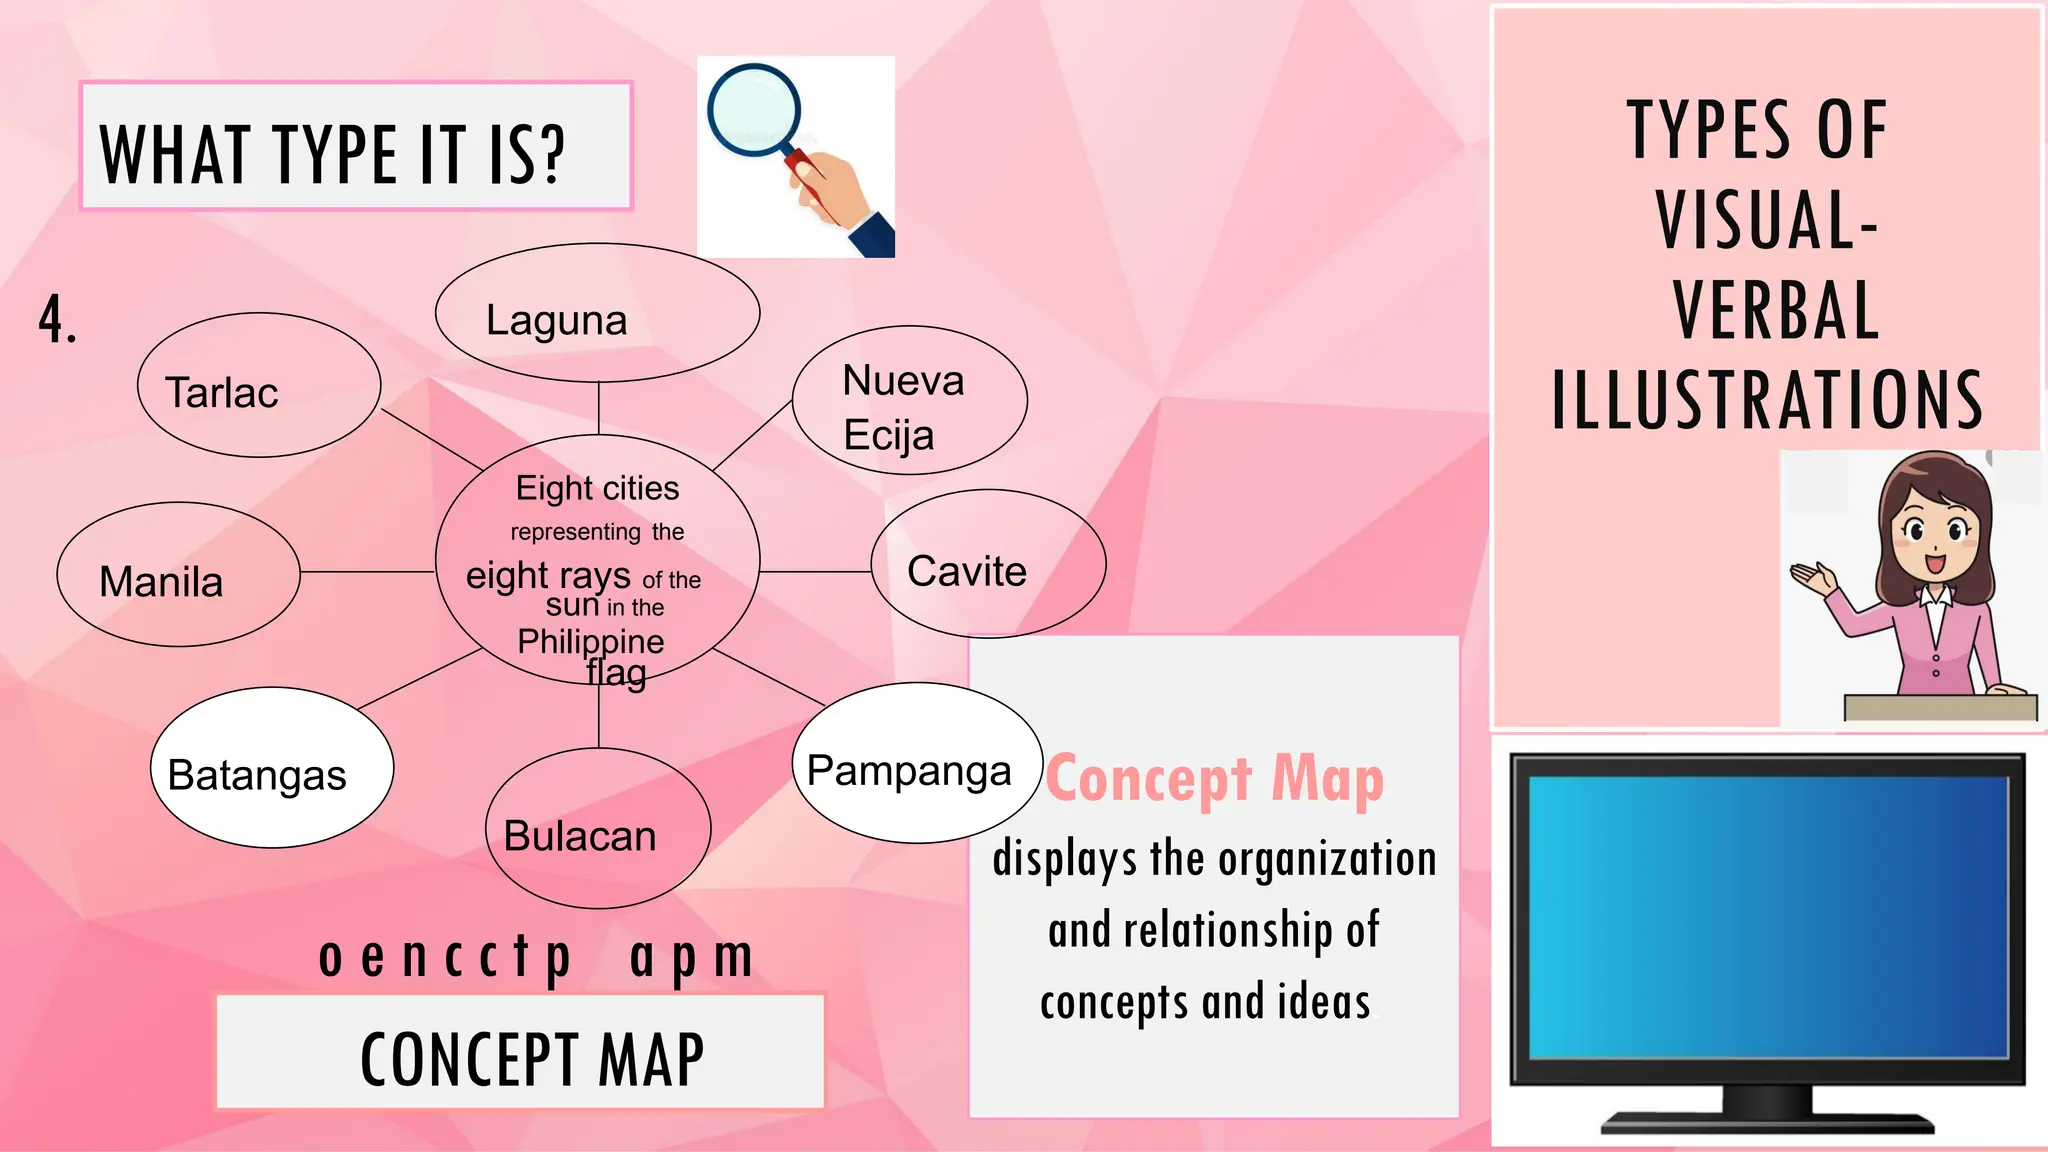
definitely
personally
must
sad
definitely
delighted
delighted
must
The term ‘cultural heritage’ has
changed content considerably in
recent decades, partially owing to the
instruments developed by the United
Nations Educational, Scientific and
Cultural Organization (UNESCO).
Cultural heritage does not end at
monuments and collections of objects.
It also includes traditions or living
expressions inherited from our
ancestors and passed on to our
descendants, such as oral traditions,
performing arts,
social practices, rituals, and festive ev
ents.
The term ‘cultural heritage’ has
changed content considerably in recent
decades, partially owing to the instruments
developed by the United Nations
Educational, Scientific and Cultural
Organization (UNESCO). Cultural heritage
does not end at monuments and collections
of objects. It also includes traditions or
living expressions inherited from our
ancestors and passed on to our descendants,
such as oral traditions, performing arts,
social practices, rituals, and festive events.
Cultural
Heritage
Traditional
skills
Social
Practice
Oral
Tradition
s
Performing
Arts
Festive
Events
Rituals and
Monuments
and collections
of objects
Illustration 1. Illustration 2.
MOST ESSENTIAL LEARNING COMPETENCY (MELC)
Explain visual-verbal relationships illustrated
in tables, graphs, and information maps found
in expository texts
EN8SS – lle - 1.2
WHAT ARE VISUAL-VERBAL ILLUSTRATIONS?
Visual-verbal illustrations
are the ways of
presenting information in
a simple and attractive
manner to catch the
readers’ interest.
These illustrations help
explain concepts easily
using graphs, maps, tables,
infographics, charts and the
like. Below are the
commonly used visual-
verbal illustrations.
TYPES OF
VISUAL-
VERBAL
ILLUSTRATIONS
1. _____ is a diagram that shows the
relationships of information presented.
a. Graph
b. Table
c. Chart
GRAPH
WHAT TYPE IT IS?
TYPES OF
VISUAL-
VERBAL
ILLUSTRATIONS
Different Kinds of Graphs
a. Bar Graph
b. Line Graph
Line Graph is a kind of graph that presents
information trends using data dots
connected by straight line segments.
TYPES OF
VISUAL-
VERBAL
ILLUSTRATIONS
Different Kinds of Graphs
a. Bar Graph
b. Line Graph
Bar Graph is a kind of graph that characterizes
categorical data with rectangular bars of
equal width.
TYPES OF
VISUAL-
VERBAL
ILLUSTRATIONS
2.
a. Concept map
b. Table
c. Chart
WHAT TYPE IT IS?
Grade 8 Section
Enrollment Data
Male Female Total
Gumamela 20 30 50
Rose 25 20 45
Sampaguita 20 28 48
Total 65 78 143
Table
is an organized
arrangement of data
usually in rows and
columns.
The table shows the
enrollment data of the
three Grade 8 sections in
which section Gumamela
has the highest number
of students (50), followed
by section Sampaguita
(48), and lastly, section
Rose (45).
TYPES OF
VISUAL-
VERBAL
ILLUSTRATIONS
3.
WHAT TYPE IT IS?
Map
a diagram or visual
representation that
shows the relative
position of the parts
of something. It could
be a drawing or a
photograph.
Luzon
Visayas
TYPES OF
VISUAL-
VERBAL
ILLUSTRATIONS
4.
o e n c c t p a p m
WHAT TYPE IT IS?
Concept Map
displays the organization
and relationship of
concepts and ideas.
Eight cities
representing the
eight rays of the
sun in the
Philippine
flag
Nueva
Ecija
Laguna
Pampanga
Tarlac
Batangas
Bulacan
Manila Cavite
CONCEPT MAP
TYPES OF
VISUAL-
VERBAL
ILLUSTRATIONS
5. _____ is an illustration that presents information
in a tabular or circular form.
a. Graph
b. Table
c. Chart
CHART
WHAT TYPE IT IS?
TYPES OF
VISUAL-
VERBAL
ILLUSTRATIONS
6.
WHAT TYPE IT IS?
INFOGRAPHIC
is a combination of
visual images and
text presentation
of specific
information.
I n _ _ g r a _ h _ c
The infographic
material contains
rainfall advisory
and people’s
appropriate
response.
f p
TYPES OF
VISUAL-
VERBAL
ILLUSTRATIONS
Pie Chart
Flowchart
March
April
May
June
2020
Submit it to the school
guard or barangay
personnel
. You can also
drop it in thedropbox
provided.
Get the Learner
Enrollment and Survey
Form (LESF) from
the
schoolguard or from the
barangaypersonnel.
Fill out the LESF
completely and
correctly.
PROCESS OF
ENROLLMENT
is circular in form that
presents how a whole
is sliced into parts.
connected by straight
line segments.
The pie chart shows
the increase of the
number of COVID-19
cases from March -
June 2020.
is an illustration that
shows a step-by-step
process
The flow chart shows
the process of
enrollment.
W O L F CHART
COLUMN B
COLUMN A
1. It is
circular in
form that
presents
how a
whole is
sliced into
parts.
0
2
4
6
Category 1 Category 2 Category 3 Category 4
a.
Bar Graph
Pie Chart
3rd Qtr
2nd Qtr
1
st
Q
tr
4th Qtr
b.
c.
Nutritional Status of Grade 8 Gumamela
Name Underweight Normal Overweight
d.
0
2
4
6
Category 1 Category 2 Category 3 Category 4
Series 1 Series 2
e. Line Graph
2. It displays
the
organization
and
relationship
of concepts
and ideas.
3. It is an
organized
arrangemen
t of data
usually in
rows and
columns.
4. It is a
kind of
graph that
presents
information
trends using
dots
connected
by straight
line
segments.
5. It is a
graph that
characterizes
categorical
data with
rectangular
bars of equal
width.
Read and analyze the text to complete the concept map with ways to stop the
spread of coronavirus.
STAY HOME.SAVE LIVES.
1. STAY home as much as you can.
2. KEEP a safe distance from people.
3. WASH hands often for 20 seconds.
4. WEAR face mask when going out and
in public places.
5. COVER your mouth when sneezing or
coughing.
6. CALL for an emergency assistance
when symptoms arise.
Help stop the spread of Coronavirus
.
STAY home as
much as you
can.
Help stop the
spread of
Coronavirus
KEEP a safe
distance from
people.
WASH hands
often for 20
seconds.
WEAR face mask
when going out and
in public places.
COVER your mouth
when sneezing or
coughing.
CALL for an
emergency
assistance when
symptoms arise.
I. Directions: Read and analyze the given expository texts. Choose at least two of
the texts and make the needed appropriate visual illustration suggested
for each.
II. Directions: Read and analyze the questions. Choose only the letter of the
correct answers.

COT ENGLISH 2ndquarter- visual-verbal illustrations.pptx

  • 1.
  • 2.
    The term ‘culturalheritage’ has changed content considerably in recent decades, partially owing to the instruments developed by the United Nations Educational, Scientific and Cultural Organization (UNESCO). Cultural heritage does not end at monuments and collections of objects. It also includes traditions or living expressions inherited from our ancestors and passed on to our descendants, such as oral traditions, performing arts, social practices, rituals, and festive ev ents. The term ‘cultural heritage’ has changed content considerably in recent decades, partially owing to the instruments developed by the United Nations Educational, Scientific and Cultural Organization (UNESCO). Cultural heritage does not end at monuments and collections of objects. It also includes traditions or living expressions inherited from our ancestors and passed on to our descendants, such as oral traditions, performing arts, social practices, rituals, and festive events. Cultural Heritage Traditional skills Social Practice Oral Tradition s Performing Arts Festive Events Rituals and Monuments and collections of objects Illustration 1. Illustration 2.
  • 3.
    MOST ESSENTIAL LEARNINGCOMPETENCY (MELC) Explain visual-verbal relationships illustrated in tables, graphs, and information maps found in expository texts EN8SS – lle - 1.2
  • 4.
    WHAT ARE VISUAL-VERBALILLUSTRATIONS? Visual-verbal illustrations are the ways of presenting information in a simple and attractive manner to catch the readers’ interest. These illustrations help explain concepts easily using graphs, maps, tables, infographics, charts and the like. Below are the commonly used visual- verbal illustrations.
  • 5.
    TYPES OF VISUAL- VERBAL ILLUSTRATIONS 1. _____is a diagram that shows the relationships of information presented. a. Graph b. Table c. Chart GRAPH WHAT TYPE IT IS?
  • 6.
    TYPES OF VISUAL- VERBAL ILLUSTRATIONS Different Kindsof Graphs a. Bar Graph b. Line Graph Line Graph is a kind of graph that presents information trends using data dots connected by straight line segments.
  • 7.
    TYPES OF VISUAL- VERBAL ILLUSTRATIONS Different Kindsof Graphs a. Bar Graph b. Line Graph Bar Graph is a kind of graph that characterizes categorical data with rectangular bars of equal width.
  • 8.
    TYPES OF VISUAL- VERBAL ILLUSTRATIONS 2. a. Conceptmap b. Table c. Chart WHAT TYPE IT IS? Grade 8 Section Enrollment Data Male Female Total Gumamela 20 30 50 Rose 25 20 45 Sampaguita 20 28 48 Total 65 78 143 Table is an organized arrangement of data usually in rows and columns. The table shows the enrollment data of the three Grade 8 sections in which section Gumamela has the highest number of students (50), followed by section Sampaguita (48), and lastly, section Rose (45).
  • 9.
    TYPES OF VISUAL- VERBAL ILLUSTRATIONS 3. WHAT TYPEIT IS? Map a diagram or visual representation that shows the relative position of the parts of something. It could be a drawing or a photograph. Luzon Visayas
  • 10.
    TYPES OF VISUAL- VERBAL ILLUSTRATIONS 4. o en c c t p a p m WHAT TYPE IT IS? Concept Map displays the organization and relationship of concepts and ideas. Eight cities representing the eight rays of the sun in the Philippine flag Nueva Ecija Laguna Pampanga Tarlac Batangas Bulacan Manila Cavite CONCEPT MAP
  • 11.
    TYPES OF VISUAL- VERBAL ILLUSTRATIONS 5. _____is an illustration that presents information in a tabular or circular form. a. Graph b. Table c. Chart CHART WHAT TYPE IT IS?
  • 12.
    TYPES OF VISUAL- VERBAL ILLUSTRATIONS 6. WHAT TYPEIT IS? INFOGRAPHIC is a combination of visual images and text presentation of specific information. I n _ _ g r a _ h _ c The infographic material contains rainfall advisory and people’s appropriate response. f p
  • 13.
    TYPES OF VISUAL- VERBAL ILLUSTRATIONS Pie Chart Flowchart March April May June 2020 Submitit to the school guard or barangay personnel . You can also drop it in thedropbox provided. Get the Learner Enrollment and Survey Form (LESF) from the schoolguard or from the barangaypersonnel. Fill out the LESF completely and correctly. PROCESS OF ENROLLMENT is circular in form that presents how a whole is sliced into parts. connected by straight line segments. The pie chart shows the increase of the number of COVID-19 cases from March - June 2020. is an illustration that shows a step-by-step process The flow chart shows the process of enrollment. W O L F CHART
  • 14.
    COLUMN B COLUMN A 1.It is circular in form that presents how a whole is sliced into parts. 0 2 4 6 Category 1 Category 2 Category 3 Category 4 a. Bar Graph Pie Chart 3rd Qtr 2nd Qtr 1 st Q tr 4th Qtr b. c. Nutritional Status of Grade 8 Gumamela Name Underweight Normal Overweight d. 0 2 4 6 Category 1 Category 2 Category 3 Category 4 Series 1 Series 2 e. Line Graph 2. It displays the organization and relationship of concepts and ideas. 3. It is an organized arrangemen t of data usually in rows and columns. 4. It is a kind of graph that presents information trends using dots connected by straight line segments. 5. It is a graph that characterizes categorical data with rectangular bars of equal width.
  • 15.
    Read and analyzethe text to complete the concept map with ways to stop the spread of coronavirus. STAY HOME.SAVE LIVES. 1. STAY home as much as you can. 2. KEEP a safe distance from people. 3. WASH hands often for 20 seconds. 4. WEAR face mask when going out and in public places. 5. COVER your mouth when sneezing or coughing. 6. CALL for an emergency assistance when symptoms arise. Help stop the spread of Coronavirus . STAY home as much as you can. Help stop the spread of Coronavirus KEEP a safe distance from people. WASH hands often for 20 seconds. WEAR face mask when going out and in public places. COVER your mouth when sneezing or coughing. CALL for an emergency assistance when symptoms arise.
  • 16.
    I. Directions: Readand analyze the given expository texts. Choose at least two of the texts and make the needed appropriate visual illustration suggested for each. II. Directions: Read and analyze the questions. Choose only the letter of the correct answers.