The document describes performing several GIS operations to analyze demographic data around a hospital in New Jersey. These include spatially joining shapefiles, merging census tract data, calculating a new field, clipping data to an area within 5 miles of the hospital, and selecting/exporting census tracts with over 10% Hispanic population. The key steps are:
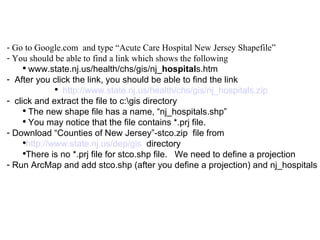
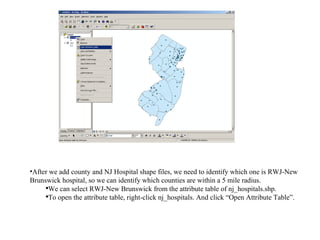
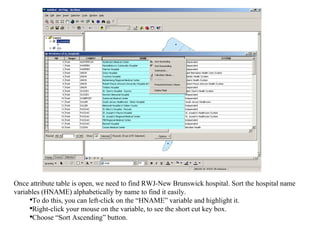
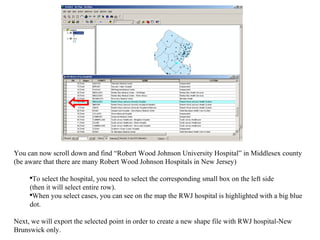
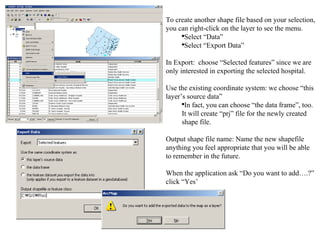
1) Downloading NJ hospital and county shapefiles, spatially joining attributes, and exporting the RWJ New Brunswick hospital.
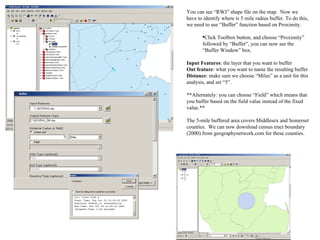
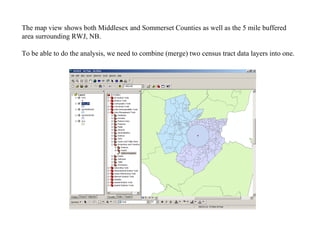
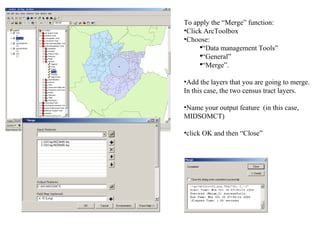
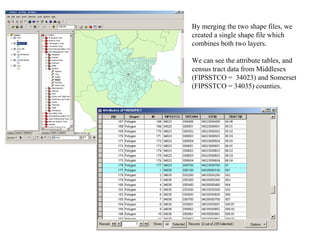
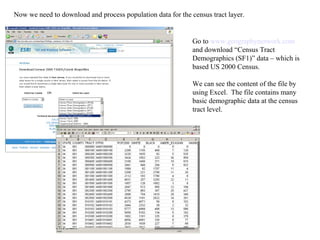
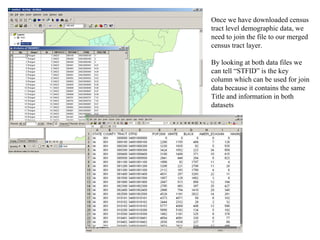
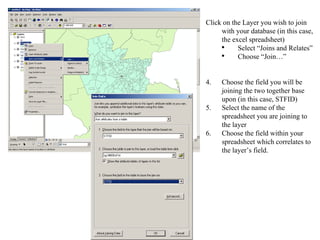
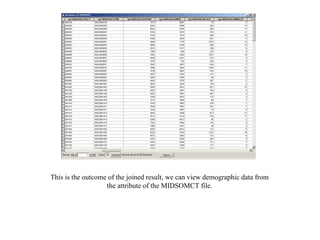
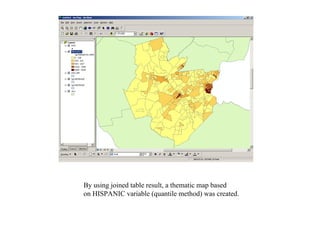
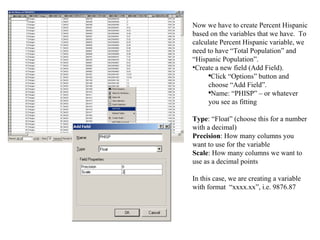
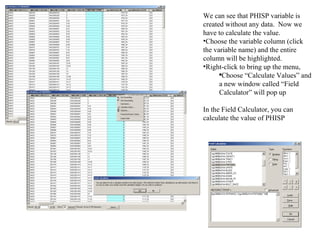
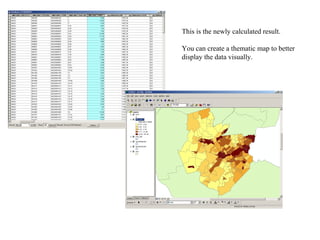
2) Buffering the hospital location, merging census tracts, and joining demographic data to calculate % Hispanic by tract.
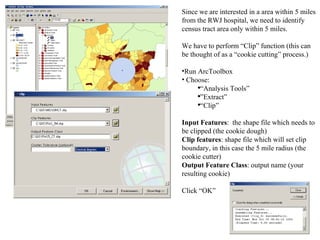
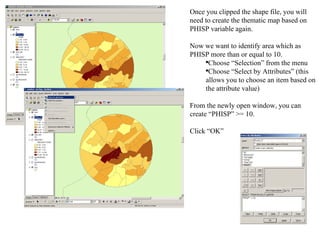
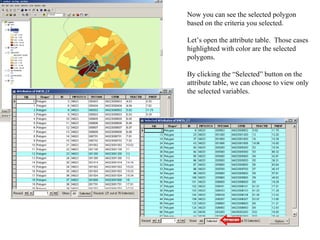
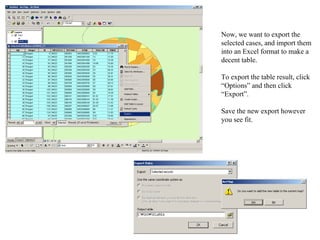
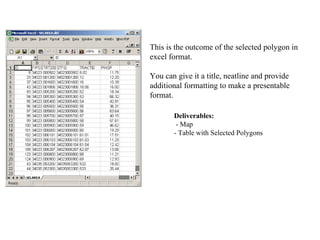
3) Clipping the data to within 5 miles, selecting tracts over 10% Hispanic, and exporting the results.