Downloaded 212 times

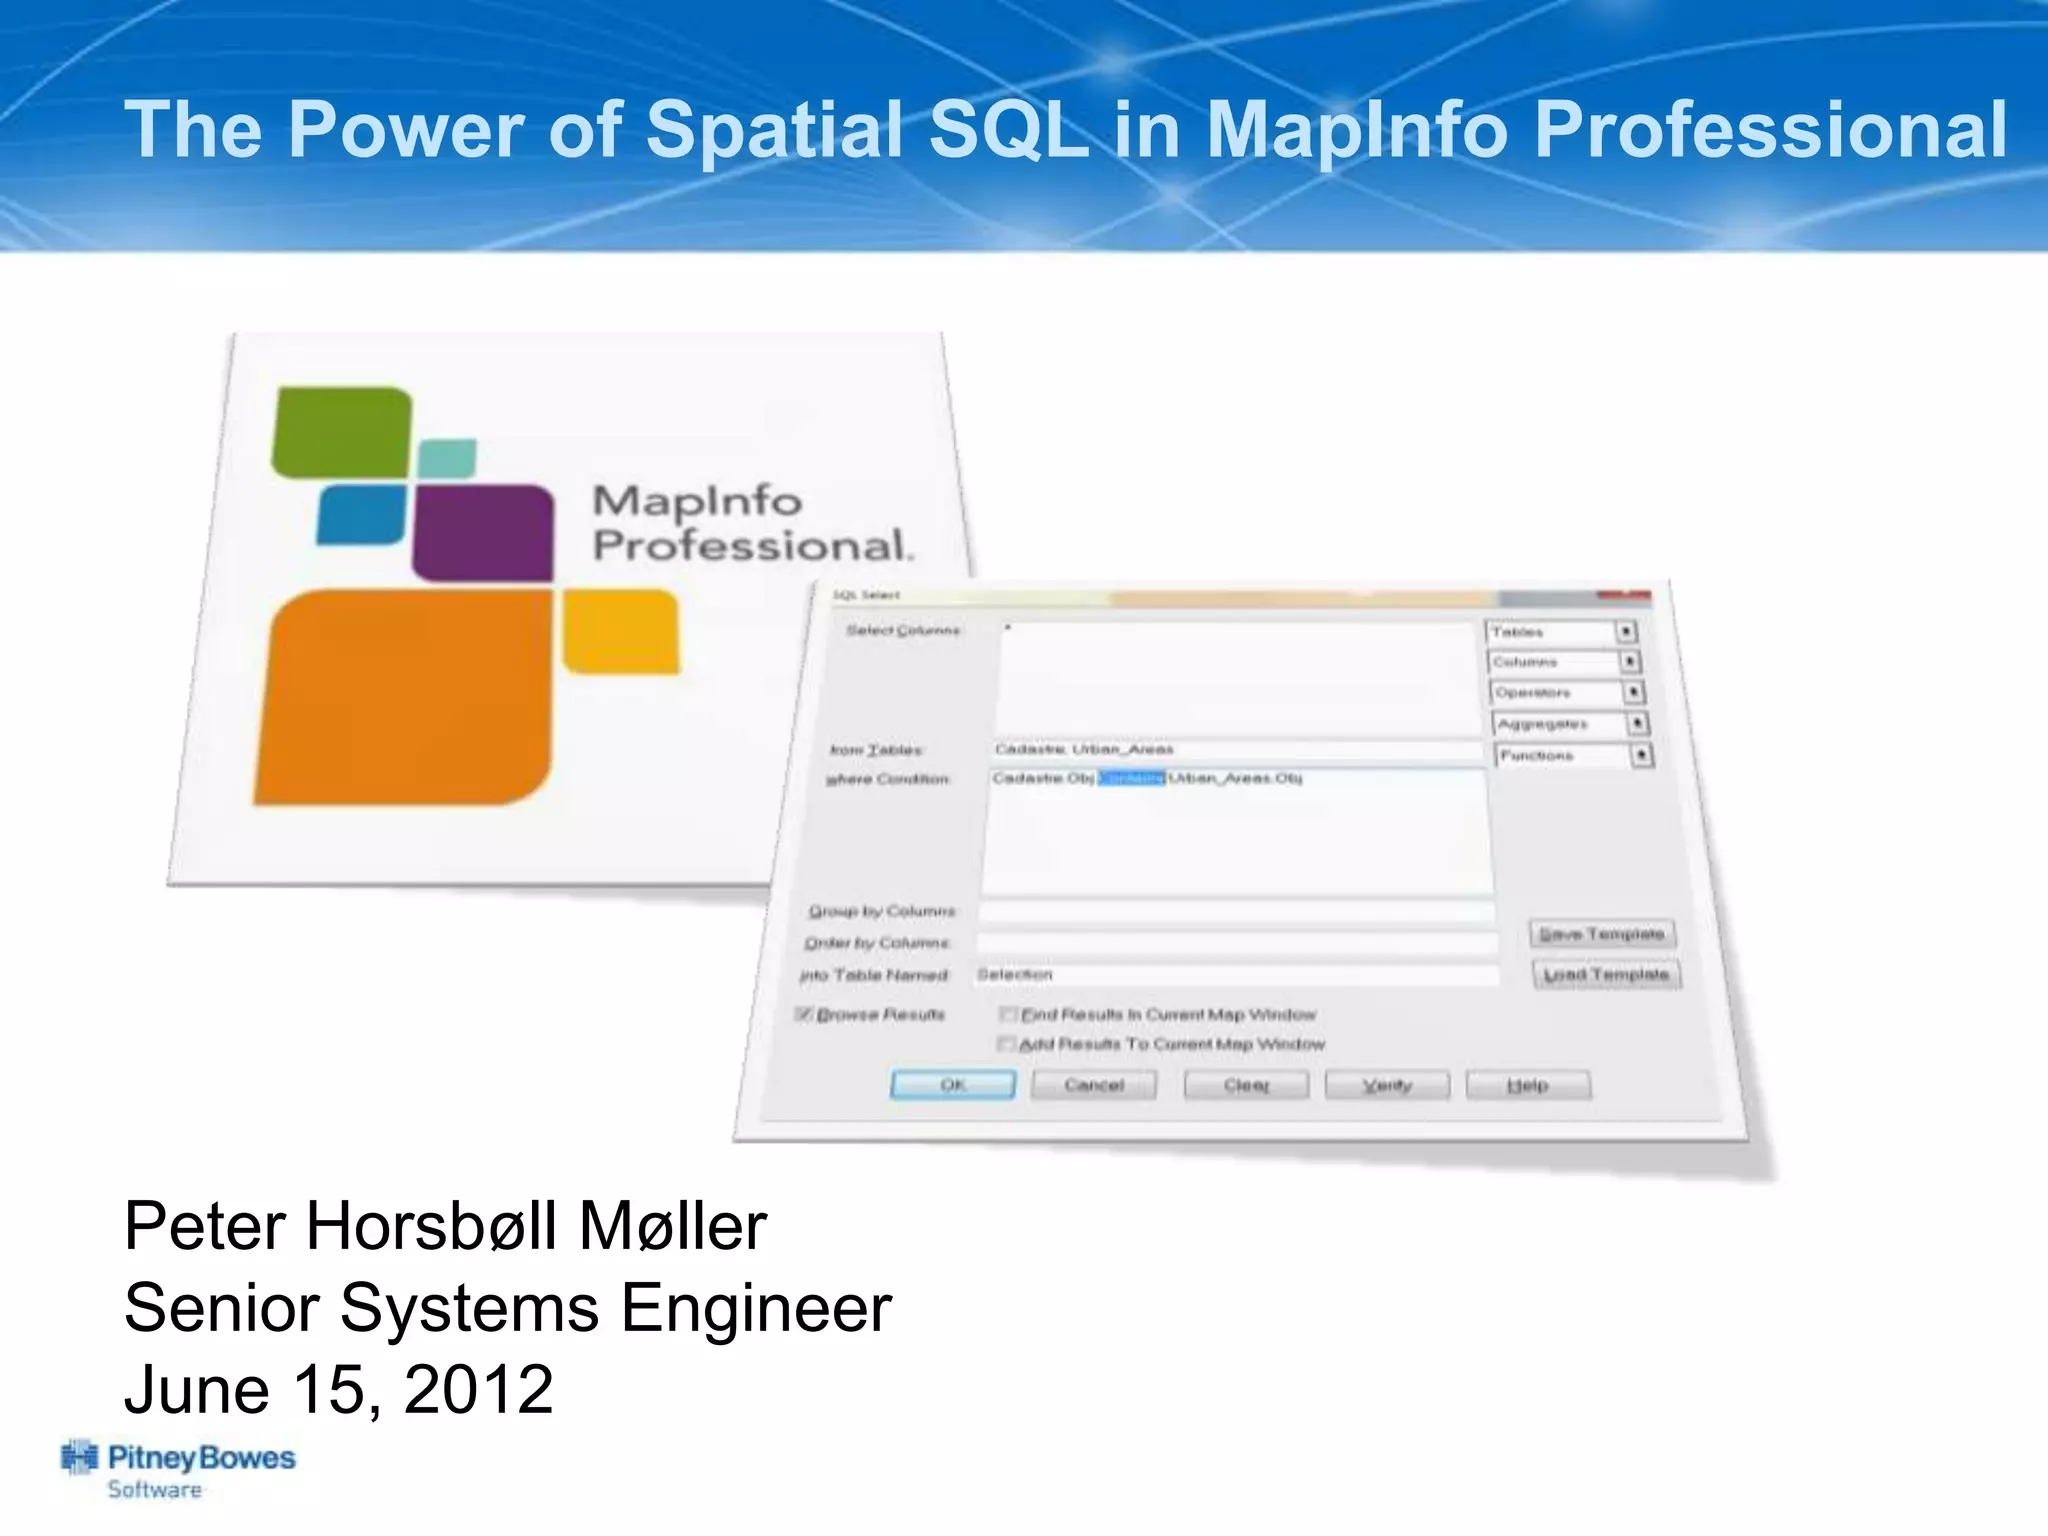


The document outlines a workshop agenda led by Peter Horsbøll Møller on the use of spatial SQL capabilities in MapInfo Professional. It covers techniques for joining tables based on spatial objects, calculating areas, and extracting and inserting spatial data. Various spatial operators and exercises are presented to illustrate practical applications of the concepts discussed.