Download to read offline


![1ST STAGE [ HIGHSTATIONARY]
High birth rate
High death rate
Ppopulation remains stationary
INDIA was in this stage till 1920
4](https://image.slidesharecdn.com/demographictrendsinindia-class-230804064425-7324ad59/85/demographictrendsinindia-class-pptx-4-320.jpg)
![2nd STAGE [EARLYEXPANDING]
- This stage is characterized by :-
Many countries like
SOUTH ASIA AND
AFRICA as in this stage.
5
Birth rate: Unchanged
Death rate: starts to decline](https://image.slidesharecdn.com/demographictrendsinindia-class-230804064425-7324ad59/85/demographictrendsinindia-class-pptx-5-320.jpg)
![3rd STAGE [LATE EXPANDING]
- This stage is characterized by :-
BR: starts to decline BR > DR
DR: Starts to decline INDIA has entered this phase
6](https://image.slidesharecdn.com/demographictrendsinindia-class-230804064425-7324ad59/85/demographictrendsinindia-class-pptx-6-320.jpg)
![4TH STAGE [LOW STATIONARY]
- This stage is characterized by :-
Low birth rate
Low death rate
ZERO POPULATION GROWTH
HAS ALREADY BEEN REPORTED
IN AUSTRIA DURING 1980-1985.
So the population
becomes stationary.
7](https://image.slidesharecdn.com/demographictrendsinindia-class-230804064425-7324ad59/85/demographictrendsinindia-class-pptx-7-320.jpg)
![5TH STAGE [DECLINING]
- This stage is characterized by :-
Low birth rate
Low death rate
SOME EAST EUROPEAN
COUNTRIES – HUNGARY AND
GERMANY ARE EXPERIENCING
THIS STAGE.
LOWER BIRTH
8
RATE THAN THE
DEATH RATE SO
THE POPULATION
BEGINS TO
DECLINE
DR> BR](https://image.slidesharecdn.com/demographictrendsinindia-class-230804064425-7324ad59/85/demographictrendsinindia-class-pptx-8-320.jpg)


![GENERAL FERTILITY RATE[GFR]
The number of live births per 1000 women in the reproductive
age group (15-44 or 49 years) in a given year.
number of live births in an
area during the year
X 1,000
Mid year female population age
15-44(or49)in the same area in
same year](https://image.slidesharecdn.com/demographictrendsinindia-class-230804064425-7324ad59/85/demographictrendsinindia-class-pptx-44-320.jpg)
![GENERAL MARITAL FERTILITY RATE[GMFR]
The number of live births per 1000 married women in the
reproductive age group (15-44 or 49 years) in a given year.
number of live births in a
year
Mid -year married female X 1,000
population age 15-44(or 49)](https://image.slidesharecdn.com/demographictrendsinindia-class-230804064425-7324ad59/85/demographictrendsinindia-class-pptx-45-320.jpg)
![AGE SPECIFIC FERTILITY RATE[ASFR]
The number of live births in a year to 1000 women in any
specified age-group.
number of live births in a
particular age group
Mid -year female X 1,000
population of the same age
group](https://image.slidesharecdn.com/demographictrendsinindia-class-230804064425-7324ad59/85/demographictrendsinindia-class-pptx-46-320.jpg)
![AGE –SPECIFIC MARITAL FERTILITY RATE [ASMFR]
The number of live births in a year to 1000 married women in
any specified age-group.
number of live births in a particular
age group
Mid -year married female X 1000
population of the same age group](https://image.slidesharecdn.com/demographictrendsinindia-class-230804064425-7324ad59/85/demographictrendsinindia-class-pptx-47-320.jpg)
![TOTAL FERTILITYRATE[TFR]
The number of children who would be born per woman (or per 1,000 women) if
she/they were to pass through the childbearing years bearing children according to a
current schedule of age-specific fertility rates.
(45-49)
TFR = 5 × ∑ASFR
(15-19)
1000](https://image.slidesharecdn.com/demographictrendsinindia-class-230804064425-7324ad59/85/demographictrendsinindia-class-pptx-48-320.jpg)
![TOTAL MARITAL FERTILITY RATE [TMFR]
Average number of children that would be born to a married women if
she experiences the current fertility pattern throughout her reproductive
span.
(45-49)
TFR = 5 × ∑ASMFR
(15-19)
1000](https://image.slidesharecdn.com/demographictrendsinindia-class-230804064425-7324ad59/85/demographictrendsinindia-class-pptx-49-320.jpg)
![GROSS REPRODUCTIVE RATE [GRR]
Average number of girls that would be born to a women if she
experiences the current fertility pattern throughout her reproductive
span 9(15-44 OR 49), assuming no mortality.
(45-49)
TFR = 5 × ∑ASMFR for female live births
(15-19)
1000](https://image.slidesharecdn.com/demographictrendsinindia-class-230804064425-7324ad59/85/demographictrendsinindia-class-pptx-50-320.jpg)
![NET REPRODUCTION RATE [NRR]
Number of daughters a newborn girl will bear during her
lifetime assuming fixed age specific fertility and mortality rates](https://image.slidesharecdn.com/demographictrendsinindia-class-230804064425-7324ad59/85/demographictrendsinindia-class-pptx-51-320.jpg)
![[CHILD WOMEN RATIO [CWR]
Number of children 0 – 4 years of age per 1000 women of child
bearing age, usually defined as 15-44 or 49 years age.](https://image.slidesharecdn.com/demographictrendsinindia-class-230804064425-7324ad59/85/demographictrendsinindia-class-pptx-52-320.jpg)


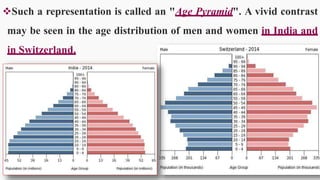
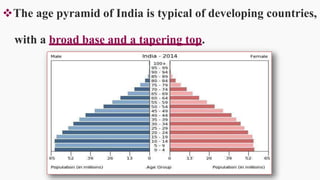
India has experienced steady population growth since 1921. It is currently the second most populous country in the world with over 1.2 billion people. The population is young, with more than 30% under 15 years old. This is reflected in India's demographic pyramid which shows a broad base tapering at the top. Sex ratios are improving but remain unbalanced due to cultural preferences for sons. Most states have ratios below national average of 940 females per 1000 males. Literacy and education levels are increasing but large proportions still lack basic education. Life expectancy is also rising but remains lower than developed nations. The population is projected to surpass China's by 2027 and reach 1.53 billion by 2050.