Downloaded 256 times
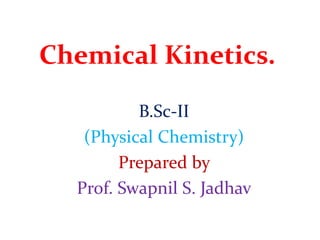
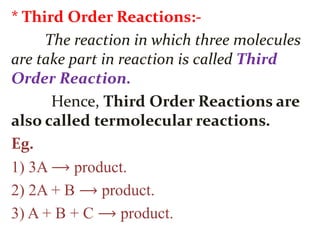
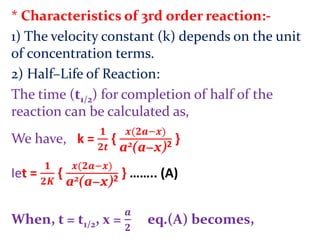
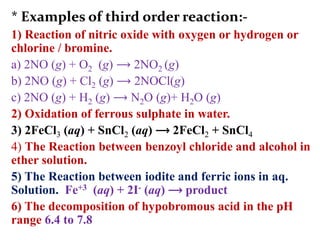
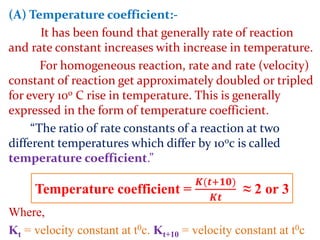
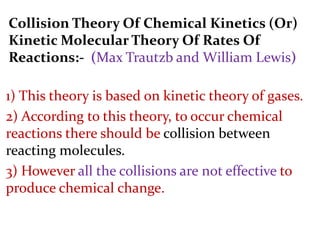
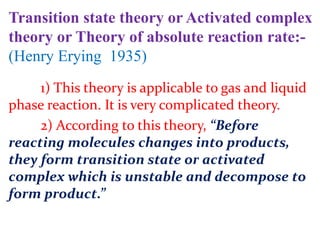
![If, t1& t2 times required for completion of same
fraction of reaction with different initial concna1&
a2respectively. And ‘n’ is order of reaction.
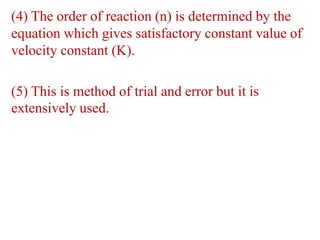
Then,
andie.
Taking log, log10[
𝒕₁
𝒕₂
] = (n–1) log10[
𝒂₂
𝒂₁
]
𝒍𝒐𝒈₁₀
[
𝒕₁
𝒕₂
]
𝒍𝒐𝒈₁₀
[
𝒂₂
𝒂₁
]
= n–1
i.en = 1 +
𝒍𝒐𝒈₁₀
[
𝒕₁
𝒕₂
]
𝒍𝒐𝒈₁₀
[
𝒂₂
𝒂₁
]
…… (A)
[
𝒕₁
𝒕₂
] = [
𝒂₂
𝒂₁
]n–1
t1 α
𝟏
𝒂₁ⁿ⁻¹
t2 α
𝟏
𝒂₂ⁿ⁻¹](https://image.slidesharecdn.com/chemicalkineticsb-170711163205/85/Chemical-Kinetics-19-320.jpg)
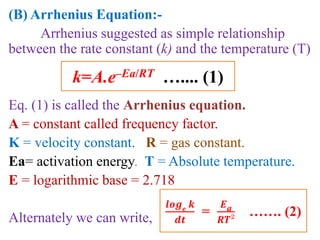
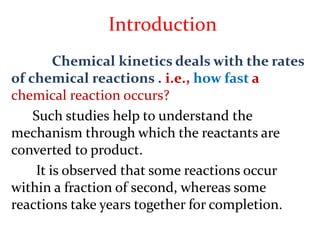
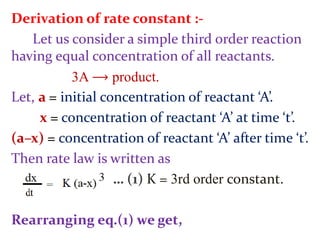
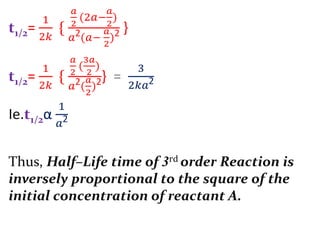
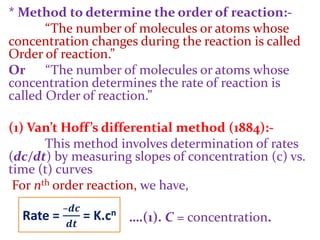
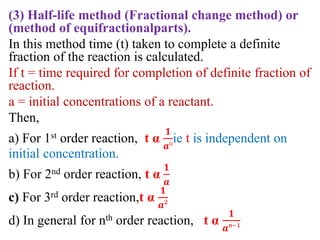
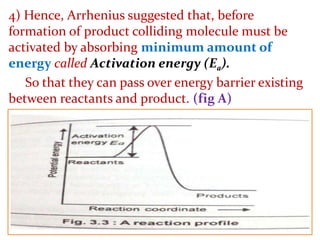
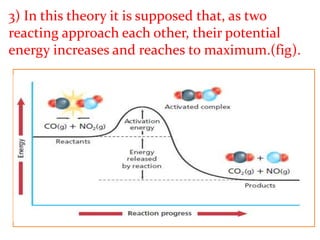
![On integrating eqn (2) between the limit
K = K1 at T = T1 and K = K2 at T = T2
We get,
log10
𝒌₂
𝒌₁
=
𝑬a
𝟐.𝟑𝟎𝟑𝑹
[
𝟏
𝑻₁
–
𝟏
𝑻₂
]
Ie. log10
𝒌₂
𝒌₁
=
𝑬a
𝟐.𝟑𝟎𝟑𝑹
[
𝑻₂– 𝑻₁
𝑻₁. 𝑻₂
]
From this equation, Eacan be calculated.](https://image.slidesharecdn.com/chemicalkineticsb-170711163205/85/Chemical-Kinetics-25-320.jpg)
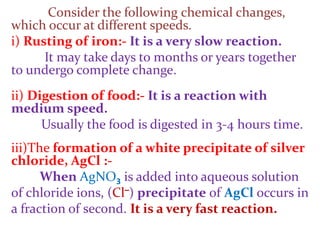
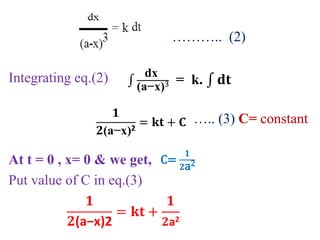
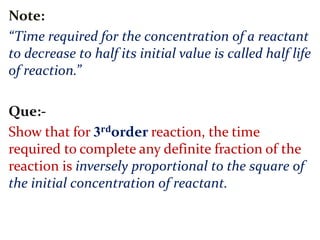
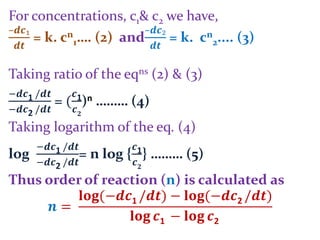
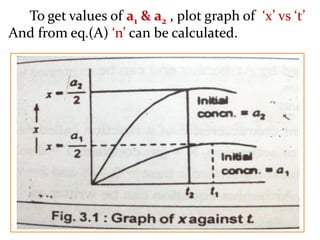
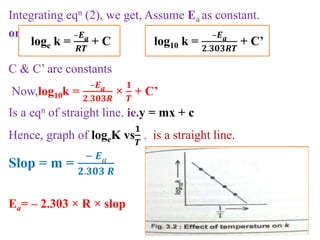
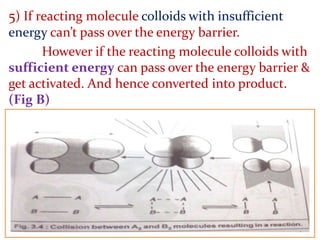
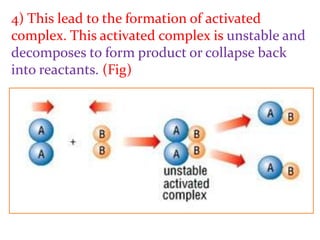
![Energy of activation (Ea) can be calculated by
Arrhenius equation as,
𝒍𝒐𝒈𝓮 𝒌
𝒅𝒕
=
𝑬𝒂
𝑹𝑻²
Orlog10
𝒌₂
𝒌₁
=
𝑬𝒂
𝟐.𝟑𝟎𝟑𝑹
[
𝑻₂– 𝑻₁
𝑻₁. 𝑻₂
]
Energy of activation (Ea) depends on the nature of
reactants.
* Slow reactions have high Ea.
* Fast reactions have low Ea.](https://image.slidesharecdn.com/chemicalkineticsb-170711163205/85/Chemical-Kinetics-27-320.jpg)


This document provides an overview of chemical kinetics and reaction rates. It discusses: 1) Chemical kinetics deals with how fast chemical reactions occur and the factors that affect reaction rates. 2) Reaction rates can vary significantly, from fractions of a second to years, as seen in examples of iron rusting and silver chloride formation. 3) The study of chemical kinetics involves determining rates of reaction, factors affecting rates, and reaction mechanisms. It then provides examples and methods for determining reaction order and the effect of temperature on reaction rates.


