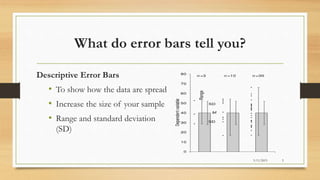
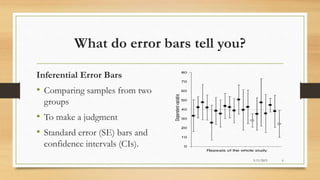
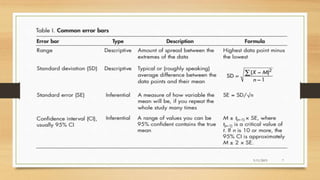
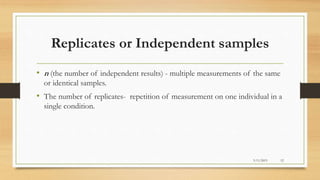
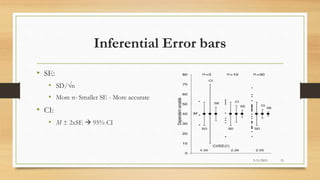
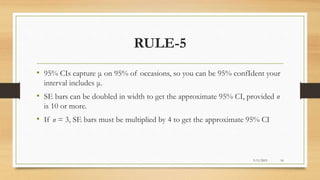
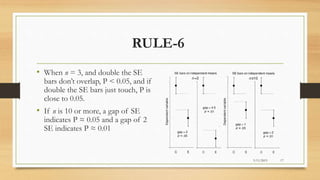
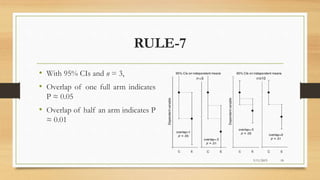
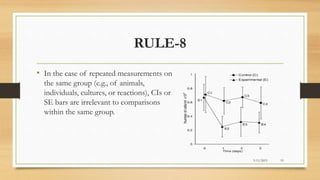
Error bars in experimental
biology
Presented by,
Sahana V
3/11/2015 1
Authors: Geoff Cumming, Fiona Fidler, and David L. Vaux -- Journal : The Journal of Cell Biology -- Impact Factor: 9.786
Background
• Error bars- common in publications
• Experimental biologists - unsure
• To use
• To interpret
• Error bars – shows confidence intervals, standard errors, standard deviations,
or other quantities.
• Different types of error bars - different information
3/11/2015 2
Overall Objective
• To illustrate some basic features of error bars and explain how they can help
communicate data and assist correct interpretation.
• Eight simple rules to assist with effective use and interpretation of error
bars.
3/11/2015 3
What are error bars for?
• Journals that publish science—knowledge gained through repeated
observation or experiment—evidences to verify that the authors’ reasoning
• Error bars can, if used properly (1–6):
• Descriptive statistics
• Inferential statistics
3/11/2015 4
depicted in exactly the same way - fundamentally different
What do error bars tell you?
Descriptive Error Bars
• To show how the data are spread
• Increase the size of your sample
• Range and standard deviation
(SD)
3/11/2015 5
What do error bars tell you?
Inferential Error Bars
• Comparing samples from two
groups
• To make a judgment
• Standard error (SE) bars and
confidence intervals (CIs).
3/11/2015 6
3/11/2015 7
RULE-1
• When showing error bars, always describe in the figure legends what they are.
3/11/2015 8
Statistical significance tests
• Statistical significance test  P value
• P < 0.05 - statistically significant
• P < 0.01 - Highly significant - More
confident
• It may fail- inferential bars hence
used.
• Wide- Large error
• Short- High precision
3/11/2015 9
What is n?
• Wide variation that occurs in nature by measuring
• a number (n) of independently sampled individuals,
• independently conducted experiments
• independent observations
3/11/2015 10
RULE-2
• The value of n (i.e., the sample size, or the number of independently
performed experiments) must be stated in the figure legend
3/11/2015 11
Replicates or Independent samples
• n (the number of independent results) - multiple measurements of the same
or identical samples.
• The number of replicates- repetition of measurement on one individual in a
single condition.
3/11/2015 12
RULE-3
• Error bars and statistics should only be
shown for independently repeated
experiments, and never for replicates.
• If a “representative” experiment is shown,
it should not have error bars or P values,
because in such an experiment, n = 1
3/11/2015 13
RULE-4
• Because experimental biologists are usually trying to compare experimental
results with controls, it is usually appropriate to show inferential error
bars, such as SE or CI, rather than SD. However, if n is very small (for
example n = 3), rather than showing error bars and statistics, it is better to
simply plot the individual data points
3/11/2015 14
Inferential Error bars
• SE:
• SD/√n
• More n- Smaller SE - More accurate
• CI:
• M ± 2xSE  95% CI
3/11/2015 15
RULE-5
• 95% CIs capture μ on 95% of occasions, so you can be 95% confIdent your
interval includes μ.
• SE bars can be doubled in width to get the approximate 95% CI, provided n
is 10 or more.
• If n = 3, SE bars must be multiplied by 4 to get the approximate 95% CI
3/11/2015 16
RULE-6
• When n = 3, and double the SE
bars don’t overlap, P < 0.05, and if
double the SE bars just touch, P is
close to 0.05.
• If n is 10 or more, a gap of SE
indicates P ≈ 0.05 and a gap of 2
SE indicates P ≈ 0.01
3/11/2015 17
RULE-7
• With 95% CIs and n = 3,
• Overlap of one full arm indicates
P ≈ 0.05
• Overlap of half an arm indicates P
≈ 0.01
3/11/2015 18
RULE-8
• In the case of repeated measurements on
the same group (e.g., of animals,
individuals, cultures, or reactions), CIs or
SE bars are irrelevant to comparisons
within the same group.
3/11/2015 19
Thank you!
1. Belia, et al. 2005. Psychol. Methods. 10:389–396.
2. Cumming et al. 2004. Understanding Statistics. 3:299–311.
3. Vaux, D.L. 2004. Error message. Nature. 428:799.
4. Cumming et al. 2007Psychol. Sci. In press.
5. Schenker, N., and J.F. Gentleman. 2001.Am. Stat. 55:182–
186.
6. Cumming, G., and S. Finch. 2005. Am. Psychol. 60:170–180.
7. International Committee of Medical Journal Editors. 1997.
Ann. Intern. Med. 126:36–47.
8. Carroll, L. 1876. Macmillan, London. 83 pp
3/11/2015 20

Error Bars in experimental biology

  • 1.
    Error bars inexperimental biology Presented by, Sahana V 3/11/2015 1 Authors: Geoff Cumming, Fiona Fidler, and David L. Vaux -- Journal : The Journal of Cell Biology -- Impact Factor: 9.786
  • 2.
    Background • Error bars-common in publications • Experimental biologists - unsure • To use • To interpret • Error bars – shows confidence intervals, standard errors, standard deviations, or other quantities. • Different types of error bars - different information 3/11/2015 2
  • 3.
    Overall Objective • Toillustrate some basic features of error bars and explain how they can help communicate data and assist correct interpretation. • Eight simple rules to assist with effective use and interpretation of error bars. 3/11/2015 3
  • 4.
    What are errorbars for? • Journals that publish science—knowledge gained through repeated observation or experiment—evidences to verify that the authors’ reasoning • Error bars can, if used properly (1–6): • Descriptive statistics • Inferential statistics 3/11/2015 4 depicted in exactly the same way - fundamentally different
  • 5.
    What do errorbars tell you? Descriptive Error Bars • To show how the data are spread • Increase the size of your sample • Range and standard deviation (SD) 3/11/2015 5
  • 6.
    What do errorbars tell you? Inferential Error Bars • Comparing samples from two groups • To make a judgment • Standard error (SE) bars and confidence intervals (CIs). 3/11/2015 6
  • 7.
  • 8.
    RULE-1 • When showingerror bars, always describe in the figure legends what they are. 3/11/2015 8
  • 9.
    Statistical significance tests •Statistical significance test  P value • P < 0.05 - statistically significant • P < 0.01 - Highly significant - More confident • It may fail- inferential bars hence used. • Wide- Large error • Short- High precision 3/11/2015 9
  • 10.
    What is n? •Wide variation that occurs in nature by measuring • a number (n) of independently sampled individuals, • independently conducted experiments • independent observations 3/11/2015 10
  • 11.
    RULE-2 • The valueof n (i.e., the sample size, or the number of independently performed experiments) must be stated in the figure legend 3/11/2015 11
  • 12.
    Replicates or Independentsamples • n (the number of independent results) - multiple measurements of the same or identical samples. • The number of replicates- repetition of measurement on one individual in a single condition. 3/11/2015 12
  • 13.
    RULE-3 • Error barsand statistics should only be shown for independently repeated experiments, and never for replicates. • If a “representative” experiment is shown, it should not have error bars or P values, because in such an experiment, n = 1 3/11/2015 13
  • 14.
    RULE-4 • Because experimentalbiologists are usually trying to compare experimental results with controls, it is usually appropriate to show inferential error bars, such as SE or CI, rather than SD. However, if n is very small (for example n = 3), rather than showing error bars and statistics, it is better to simply plot the individual data points 3/11/2015 14
  • 15.
    Inferential Error bars •SE: • SD/√n • More n- Smaller SE - More accurate • CI: • M ± 2xSE  95% CI 3/11/2015 15
  • 16.
    RULE-5 • 95% CIscapture μ on 95% of occasions, so you can be 95% confIdent your interval includes μ. • SE bars can be doubled in width to get the approximate 95% CI, provided n is 10 or more. • If n = 3, SE bars must be multiplied by 4 to get the approximate 95% CI 3/11/2015 16
  • 17.
    RULE-6 • When n= 3, and double the SE bars don’t overlap, P < 0.05, and if double the SE bars just touch, P is close to 0.05. • If n is 10 or more, a gap of SE indicates P ≈ 0.05 and a gap of 2 SE indicates P ≈ 0.01 3/11/2015 17
  • 18.
    RULE-7 • With 95%CIs and n = 3, • Overlap of one full arm indicates P ≈ 0.05 • Overlap of half an arm indicates P ≈ 0.01 3/11/2015 18
  • 19.
    RULE-8 • In thecase of repeated measurements on the same group (e.g., of animals, individuals, cultures, or reactions), CIs or SE bars are irrelevant to comparisons within the same group. 3/11/2015 19
  • 20.
    Thank you! 1. Belia,et al. 2005. Psychol. Methods. 10:389–396. 2. Cumming et al. 2004. Understanding Statistics. 3:299–311. 3. Vaux, D.L. 2004. Error message. Nature. 428:799. 4. Cumming et al. 2007Psychol. Sci. In press. 5. Schenker, N., and J.F. Gentleman. 2001.Am. Stat. 55:182– 186. 6. Cumming, G., and S. Finch. 2005. Am. Psychol. 60:170–180. 7. International Committee of Medical Journal Editors. 1997. Ann. Intern. Med. 126:36–47. 8. Carroll, L. 1876. Macmillan, London. 83 pp 3/11/2015 20