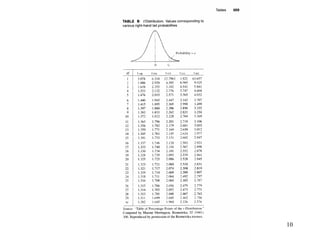
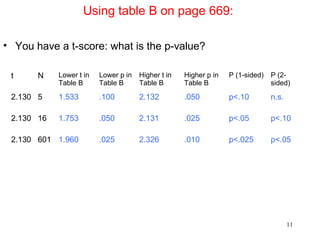
- The document discusses small sample inference and hypothesis testing for means and proportions. For small samples, the t-distribution rather than the z-distribution must be used because the sample standard deviation s is a less precise estimate of the population standard deviation σ.
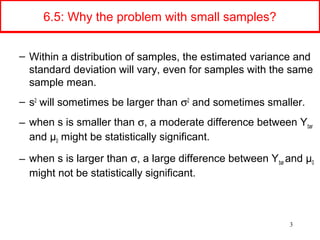
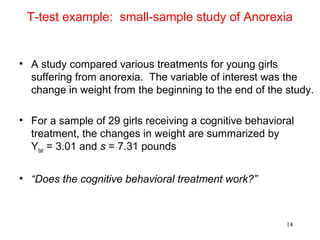
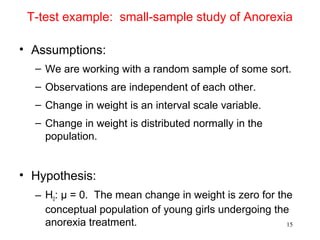
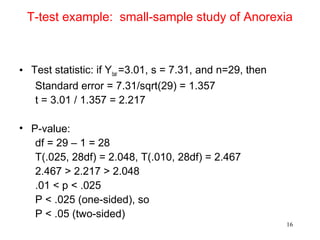
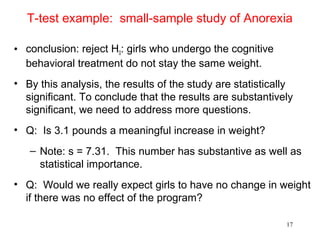
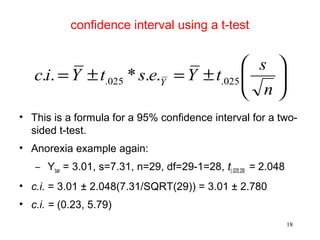
- The t-test corrects for this by using t-scores and the t-distribution table rather than z-scores and the normal distribution table. It demonstrates a t-test example for a small sample study on anorexia treatment.
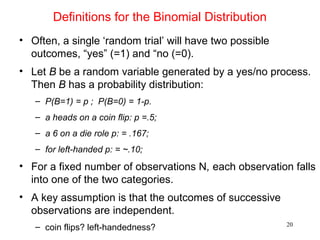
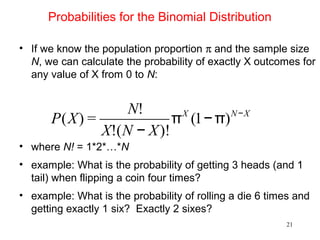
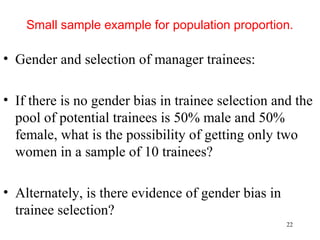
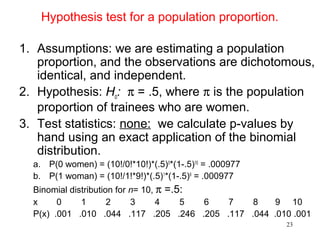
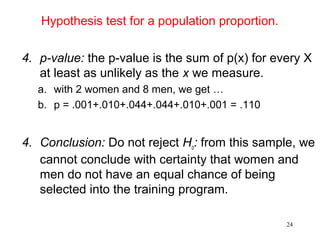
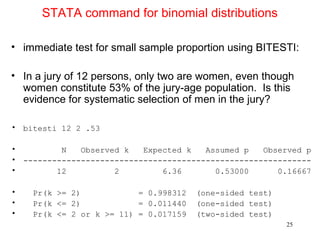
- For small sample inference on proportions, the binomial distribution must be used rather than approximating it as normal. It provides an example hypothesis test on gender bias in manager trainee selection.
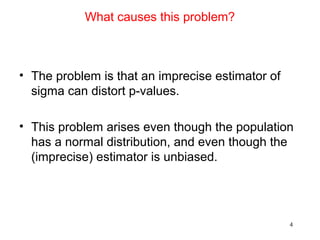
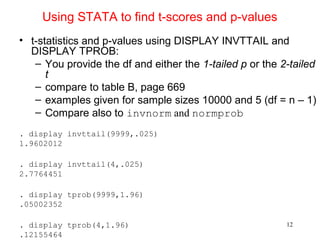
![STATA commands for section 6.5 or 6.2
• immediate test for sample mean using TTESTI:
• (note use of t-score, not z-score)
. * for example, in A&F problem 6.8, n=100 Ybar=508 sd=100 and mu0=500
. ttesti 100 508 100 500, level(95)
One-sample t test
------------------------------------------------------------------------------
| Obs Mean Std. Err. Std. Dev. [95% Conf. Interval]
---------+--------------------------------------------------------------------
x | 100 508 10 100 488.1578 527.8422
------------------------------------------------------------------------------
Degrees of freedom: 99
Ho: mean(x) = 500
Ha: mean < 500 Ha: mean != 500 Ha: mean > 500
t = 0.8000 t = 0.8000 t = 0.8000
P < t = 0.7872 P > |t| = 0.4256 P > t = 0.2128
13](https://image.slidesharecdn.com/601class07-160322094619/85/Sociology-601-class-7-12-320.jpg)
![6.6: Small-sample inference for a population proportion:
the Binomial Distribution
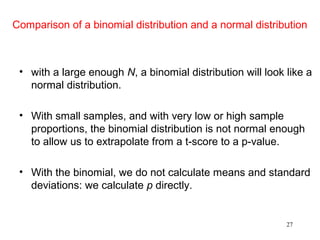
• With large samples, we have been treating population
proportions as a special case of a population mean, but with
slightly different equations.
– z = ( - πo ) /s.e.
– = ( - πo ) / (σ0 / SQRT(N) )
– = ( - πo ) / ( [ SQRT(πo(1- πo)) ] / SQRT(N) )
• With small samples, however, tests for population means
require the specific assumption that the variable has a
normal distribution within the population.
• We need a statistic from which we can draw inferences
when np < 10 or n(1-p) < 10.
ˆπ
ˆπ
ˆπ
19](https://image.slidesharecdn.com/601class07-160322094619/85/Sociology-601-class-7-18-320.jpg)
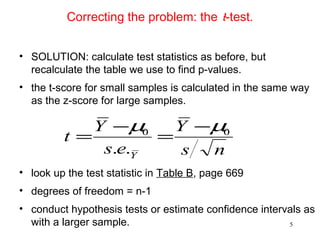
![Alternative STATA command for testing probabilities:
useful for large n
immediate test for sample proportion using PRTESTI:
. * for proportion: in A&F problem 6.12, n=832 p=.53 and p0=.5
. prtesti 832 .53 .50, level(95)
One-sample test of proportion x: Number of obs = 832
------------------------------------------------------------------------------
Variable | Mean Std. Err. [95% Conf. Interval]
-------------+----------------------------------------------------------------
x | .53 .0173032 .4960864 .5639136
------------------------------------------------------------------------------
Ho: proportion(x) = .5
Ha: x < .5 Ha: x != .5 Ha: x > .5
z = 1.731 z = 1.731 z = 1.731
P < z = 0.9582 P > |z| = 0.0835 P > z = 0.0418 26](https://image.slidesharecdn.com/601class07-160322094619/85/Sociology-601-class-7-25-320.jpg)