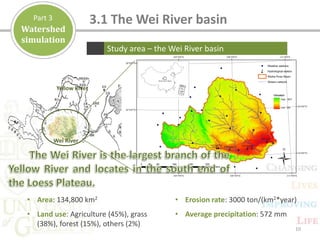
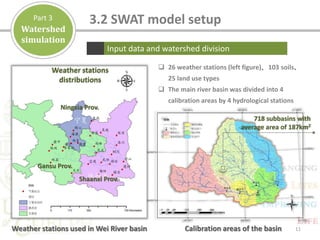
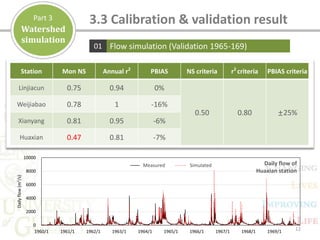
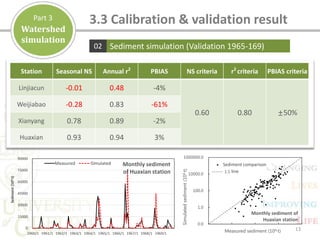
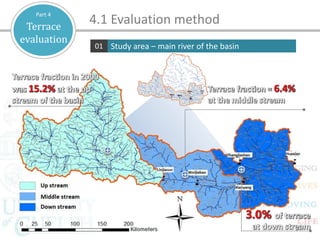
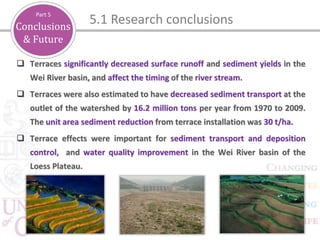
Hui Shao (Shawn) PhD
Dept. of Geography
University of Guelph
JULY 2014
69th SWCS International Annual Conference
MAKING WAVES IN CONSERVATION
Terrace model2
Introduction1
Terrace evaluation4
Watershed simulation3
Content
Conclusions & Future5
2
Introduction
Part 1 1.1 What is terrace?
 Purposes & Benefits
 Increase infiltration and soil moisture
 Reduces soil erosion
 Improves water quality by reducing
sedimentation
 Controls runoff peak flow
 Terrace practices are one of the oldest
and most widely used means of saving
water and controlling erosion all over
the world.
3
Introduction
Part 1
4
1.2 Background
Environmental issues of the Loess Plateau
Yellow river
Bank
River bed 13m
Ground Deposited
volume(108 m3)
Scientific
• Terrace overland
effects
• Watershed impacts
Technical
• Conceptualize
different terrace
type
• Terrace algorithms
• Incorporation to
hydrological model
• Easy to use
Terraces
Check dams
Forestation
1.3 Scientific questions
Weihe river
Yellow reiver
Challenges of evaluate terraces effects
Introduction
Part 1
6
Process-based terrace simulation
2.1 Concept design
Terrace model
Part 2
H. Shao, C. Baffaut, J. E. Gao et al. 2013. Development
and Application of Algorithms for Simulating Terraces
within SWAT. Transaction of ASABE, 56(5): 1715-1730.
Parameter Represent effects
CN2 Adjust rainfall
infiltration in terrace
USLE-P Reduce sediment losses
SLSUBBSN Distance between
terraces
Waidler, D. et al. 2011. Conservation Practice
Modeling Guide for SWAT and APEX. TR-399.
College Station, Texas A&M University System.
Lu
(Undisturbed)
Lterrace
(Terraceunit)
α0
Soil layer 2
……
Soil layer 1
Cut Fill
Cut Fill
Lb
(Bed or
Frontslope)
Lr
(Riser or
Cutslope)
Lr
(Riser or
Cutslope)
Lb
(Bed or
Frontslope)
Lr
(Riser or
Cutslope)
Lr
(Riser or
Cutslope)
Terrace types and segments01
7
2.2 Terrace algorithm
 Runoff: SCS curve number
 Erosion: MUSLE method
 Nutrients: nitrogen & phosphorous
 Plant growth: optimal growth & stress
 More: plant management, lateral flow,
water harvesting etc.
Terrace model
Part 2
8
 Sub-daily simulation
 Sediment and nutrient settlement
 Extra infiltration
 Extra evaporation
 Inside terrace channel erosion
 Terrace output
Terrace storage effects02
2.2 Terrace algorithm
Terrace model
Part 2
9
 Generate standard input files
 Batch modifications
 Read original SWAT parameters
 Modify parameters (e.g. CN2)
based on terrace shapes
Subbasin
list
Terrace
fraction
Inflow
fraction
Read variable values
from original SWAT
input files
Create terrace input files
Write, modify or delete terrace related variable values
Terrace input control and sample files
Control
code
Features of TIA
2.3 Terrace input assist tool (TIA)
Terrace model
Part 2
10
Wei River
Yellow River
Study area – the Wei River basin
3.1 The Wei River basin
Watershed
simulation
Part 3
• Area: 134,800 km2
• Land use: Agriculture (45%), grass
(38%), forest (15%), others (2%)
• Erosion rate: 3000 ton/(km2*year)
• Average precipitation: 572 mm
11
Input data and watershed division
3.2 SWAT model setup
Watershed
simulation
Part 3
 26 weather stations (left figure)、103 soils、
25 land use types
 The main river basin was divided into 4
calibration areas by 4 hydrological stations
Weather stations used in Wei River basin Calibration areas of the basin
718 subbasins with
average area of 187km2
Weather stations
distributions
Shaanxi Prov.
Gansu Prov.
Ningxia Prov.
Flow simulation (Validation 1965-169)01
12
0
2000
4000
6000
8000
10000
1960/1 1961/1 1962/1 1963/1 1964/1 1965/1 1966/1 1967/1 1968/1 1969/1
Dailyflow(m3/s)
实测值 模拟值 Daily flow of
Huaxian station
Station Mon NS Annual r2
PBIAS NS criteria r2
criteria PBIAS criteria
Linjiacun 0.75 0.94 0%
0.50 0.80 ±25%
Weijiabao 0.78 1 -16%
Xianyang 0.81 0.95 -6%
Huaxian 0.47 0.81 -7%
Measured Simulated
3.3 Calibration & validation result
Watershed
simulation
Part 3
Sediment simulation (Validation 1965-169)02
13
Station Seasonal NS Annual r2
PBIAS NS criteria r2
criteria PBIAS criteria
Linjiacun -0.01 0.48 -4%
0.60 0.80 ±50%
Weijiabao -0.28 0.83 -61%
Xianyang 0.78 0.89 -2%
Huaxian 0.93 0.94 3%
0
15000
30000
45000
60000
75000
90000
1960/1 1961/1 1962/1 1963/1 1964/1 1965/1 1966/1 1967/1 1968/1 1969/1
Sediment(104·t)
实测值 模拟值 Monthly sediment
of Huaxian station
0.0
1.0
100.0
10000.0
1000000.0
Simulatedsediment(104·t)
Measured sediment (104·t)
月泥沙对比
1:1 参照线
Monthly sediment of
Huaxian station
Measured Simulated Sediment comparison
line
Watershed
simulation
Part 3 3.3 Calibration & validation result
Terrace
evaluation
Part 4
Study area – main river of the basin01
14
4.1 Evaluation method
15
0
10
20
30
40
50
60
70
80
S1979 S1989 S2000 S2000X1.5 S2000X2 S2000X3 S2000X4 S2000X5
Terracefraction(%)
Terrace scenario
上游
中游
下游
Scenario design:
8 terrace scenarios were designed based
on measured data (bottom figure) with
average distribution.
Terrace parameters:
All terraces were set as bench terrace with
ridge height of 30cm. All in terrace parameters
came from the calibrated HRU values.
Up stream
Mid stream
Down stream
Terrace
evaluation
Part 4
Terrace scenarios02
4.1 Evaluation method
16
Surface runoff Lateral flow Base flow
Terrace
evaluation
Part 4
Flow response01
4.2 Hydrological response to terrace
17
10
15
20
25
30
35
No terrace S1979 S1989 S2000 S2000X1.5 S2000X2 S2000X3 S2000X4 S2000X5
Wateryield(108·m3/a)
Terrace scenarios
Surface Lateral Baseflow
Surface, lateral & base flow:
Surface, lateral and base flow has changed
by -6.7%,+1.0% and +3.4% under S2000
terrace scenario compare to no terrace.
Total water yield:
Total water yield decreased -0.47% under
S2000 terrace scenario, and -2.7% under
S2000X5 terrace scenario.
Terrace
evaluation
Part 4
Analysis of flow response02
4.2 Hydrological response to terrace
18
0
40
80
120
160
200
240
1 2 3 4 5 6 7 8 9 10 11 12
Streamflow(m3/s)
Month
无梯田 No terrace S2000梯田情景 S2000X5梯田情景
Stream flow of different terrace
scenarios at Linjiacun station
Decrease peak
value in flood
season
Increase base flow in dry
season
No terrace S2000 S2000X5
Terrace
evaluation
Part 4
Stream flow response
4.3 River flow response to terrace
19
Terrace
evaluation
Part 4
Erosion response
4.4 Erosion response to terrace
20
Scenario
Annul. Sed.
Load
(106·t)
Change per
terrace
(t/ha)
Scenario
Annul. Sed.
Load
(106·t)
Change per
terrace
(t/ha)
No terrace
153.20
(100%)
- S2000X2
119.20
(77.8%)
-30.0
S1979
148.50
(96.9%)
-21.7 S2000X3
102.70
(67.0%)
-29.7
S1989
144.30
(94.2%)
-26.3 S2000X4
86.75
(56.6%)
-29.3
S2000
137.00
(89.4%)
-28.6 S2000X5
68.39
(44.6%)
-29.9
Terrace
evaluation
Part 4
Sediment load in the stream01
4.5 Sediment load and riverbed deformation
21
Terrace
evaluation
Part 4
Riverbed deformation analysis02
4.5 Sediment load and riverbed deformation
22
 Terraces significantly decreased surface runoff and sediment yields in the
Wei River basin, and affect the timing of the river stream.
 Terraces were also estimated to have decreased sediment transport at the
outlet of the watershed by 16.2 million tons per year from 1970 to 2009.
The unit area sediment reduction from terrace installation was 30 t/ha.
 Terrace effects were important for sediment transport and deposition
control, and water quality improvement in the Wei River basin of the
Loess Plateau.
Conclusions
& Future
Part 5
5.1 Research conclusions
23
Conclusions
& Future
Part 5
5.2 Future research
Information
Part 1
 SWAT input reading
tools, e.g. ArcSWAT,
AVSWAT.
 Input conversion
tools
Watershed evaluation of BMPs in SWAT
Scenario
Part 2
Model
Part 3
Display
Part 4
 BMPs customer list
 Multiple BMPs
 Field level
 Scenarios
comparison
 SWAT model
 Economic model
 Integrated (cost-
effective) model
 Database functions
 SWAT output
 Economic output
 Integrated (cost-
effective) output
 Live view output
24
Hui Shao (or Shawn)
shaoh@uoguelph.ca
University of Guelph

Terrace effects on soil erosion processes

  • 1.
    Hui Shao (Shawn)PhD Dept. of Geography University of Guelph JULY 2014 69th SWCS International Annual Conference MAKING WAVES IN CONSERVATION
  • 2.
    Terrace model2 Introduction1 Terrace evaluation4 Watershedsimulation3 Content Conclusions & Future5 2
  • 3.
    Introduction Part 1 1.1What is terrace?  Purposes & Benefits  Increase infiltration and soil moisture  Reduces soil erosion  Improves water quality by reducing sedimentation  Controls runoff peak flow  Terrace practices are one of the oldest and most widely used means of saving water and controlling erosion all over the world. 3
  • 4.
    Introduction Part 1 4 1.2 Background Environmentalissues of the Loess Plateau Yellow river Bank River bed 13m Ground Deposited volume(108 m3)
  • 5.
    Scientific • Terrace overland effects •Watershed impacts Technical • Conceptualize different terrace type • Terrace algorithms • Incorporation to hydrological model • Easy to use Terraces Check dams Forestation 1.3 Scientific questions Weihe river Yellow reiver Challenges of evaluate terraces effects Introduction Part 1
  • 6.
    6 Process-based terrace simulation 2.1Concept design Terrace model Part 2 H. Shao, C. Baffaut, J. E. Gao et al. 2013. Development and Application of Algorithms for Simulating Terraces within SWAT. Transaction of ASABE, 56(5): 1715-1730. Parameter Represent effects CN2 Adjust rainfall infiltration in terrace USLE-P Reduce sediment losses SLSUBBSN Distance between terraces Waidler, D. et al. 2011. Conservation Practice Modeling Guide for SWAT and APEX. TR-399. College Station, Texas A&M University System.
  • 7.
    Lu (Undisturbed) Lterrace (Terraceunit) α0 Soil layer 2 …… Soillayer 1 Cut Fill Cut Fill Lb (Bed or Frontslope) Lr (Riser or Cutslope) Lr (Riser or Cutslope) Lb (Bed or Frontslope) Lr (Riser or Cutslope) Lr (Riser or Cutslope) Terrace types and segments01 7 2.2 Terrace algorithm  Runoff: SCS curve number  Erosion: MUSLE method  Nutrients: nitrogen & phosphorous  Plant growth: optimal growth & stress  More: plant management, lateral flow, water harvesting etc. Terrace model Part 2
  • 8.
    8  Sub-daily simulation Sediment and nutrient settlement  Extra infiltration  Extra evaporation  Inside terrace channel erosion  Terrace output Terrace storage effects02 2.2 Terrace algorithm Terrace model Part 2
  • 9.
    9  Generate standardinput files  Batch modifications  Read original SWAT parameters  Modify parameters (e.g. CN2) based on terrace shapes Subbasin list Terrace fraction Inflow fraction Read variable values from original SWAT input files Create terrace input files Write, modify or delete terrace related variable values Terrace input control and sample files Control code Features of TIA 2.3 Terrace input assist tool (TIA) Terrace model Part 2
  • 10.
    10 Wei River Yellow River Studyarea – the Wei River basin 3.1 The Wei River basin Watershed simulation Part 3 • Area: 134,800 km2 • Land use: Agriculture (45%), grass (38%), forest (15%), others (2%) • Erosion rate: 3000 ton/(km2*year) • Average precipitation: 572 mm
  • 11.
    11 Input data andwatershed division 3.2 SWAT model setup Watershed simulation Part 3  26 weather stations (left figure)、103 soils、 25 land use types  The main river basin was divided into 4 calibration areas by 4 hydrological stations Weather stations used in Wei River basin Calibration areas of the basin 718 subbasins with average area of 187km2 Weather stations distributions Shaanxi Prov. Gansu Prov. Ningxia Prov.
  • 12.
    Flow simulation (Validation1965-169)01 12 0 2000 4000 6000 8000 10000 1960/1 1961/1 1962/1 1963/1 1964/1 1965/1 1966/1 1967/1 1968/1 1969/1 Dailyflow(m3/s) 实测值 模拟值 Daily flow of Huaxian station Station Mon NS Annual r2 PBIAS NS criteria r2 criteria PBIAS criteria Linjiacun 0.75 0.94 0% 0.50 0.80 ±25% Weijiabao 0.78 1 -16% Xianyang 0.81 0.95 -6% Huaxian 0.47 0.81 -7% Measured Simulated 3.3 Calibration & validation result Watershed simulation Part 3
  • 13.
    Sediment simulation (Validation1965-169)02 13 Station Seasonal NS Annual r2 PBIAS NS criteria r2 criteria PBIAS criteria Linjiacun -0.01 0.48 -4% 0.60 0.80 ±50% Weijiabao -0.28 0.83 -61% Xianyang 0.78 0.89 -2% Huaxian 0.93 0.94 3% 0 15000 30000 45000 60000 75000 90000 1960/1 1961/1 1962/1 1963/1 1964/1 1965/1 1966/1 1967/1 1968/1 1969/1 Sediment(104·t) 实测值 模拟值 Monthly sediment of Huaxian station 0.0 1.0 100.0 10000.0 1000000.0 Simulatedsediment(104·t) Measured sediment (104·t) 月泥沙对比 1:1 参照线 Monthly sediment of Huaxian station Measured Simulated Sediment comparison line Watershed simulation Part 3 3.3 Calibration & validation result
  • 14.
    Terrace evaluation Part 4 Study area– main river of the basin01 14 4.1 Evaluation method
  • 15.
    15 0 10 20 30 40 50 60 70 80 S1979 S1989 S2000S2000X1.5 S2000X2 S2000X3 S2000X4 S2000X5 Terracefraction(%) Terrace scenario 上游 中游 下游 Scenario design: 8 terrace scenarios were designed based on measured data (bottom figure) with average distribution. Terrace parameters: All terraces were set as bench terrace with ridge height of 30cm. All in terrace parameters came from the calibrated HRU values. Up stream Mid stream Down stream Terrace evaluation Part 4 Terrace scenarios02 4.1 Evaluation method
  • 16.
    16 Surface runoff Lateralflow Base flow Terrace evaluation Part 4 Flow response01 4.2 Hydrological response to terrace
  • 17.
    17 10 15 20 25 30 35 No terrace S1979S1989 S2000 S2000X1.5 S2000X2 S2000X3 S2000X4 S2000X5 Wateryield(108·m3/a) Terrace scenarios Surface Lateral Baseflow Surface, lateral & base flow: Surface, lateral and base flow has changed by -6.7%,+1.0% and +3.4% under S2000 terrace scenario compare to no terrace. Total water yield: Total water yield decreased -0.47% under S2000 terrace scenario, and -2.7% under S2000X5 terrace scenario. Terrace evaluation Part 4 Analysis of flow response02 4.2 Hydrological response to terrace
  • 18.
    18 0 40 80 120 160 200 240 1 2 34 5 6 7 8 9 10 11 12 Streamflow(m3/s) Month 无梯田 No terrace S2000梯田情景 S2000X5梯田情景 Stream flow of different terrace scenarios at Linjiacun station Decrease peak value in flood season Increase base flow in dry season No terrace S2000 S2000X5 Terrace evaluation Part 4 Stream flow response 4.3 River flow response to terrace
  • 19.
  • 20.
    20 Scenario Annul. Sed. Load (106·t) Change per terrace (t/ha) Scenario Annul.Sed. Load (106·t) Change per terrace (t/ha) No terrace 153.20 (100%) - S2000X2 119.20 (77.8%) -30.0 S1979 148.50 (96.9%) -21.7 S2000X3 102.70 (67.0%) -29.7 S1989 144.30 (94.2%) -26.3 S2000X4 86.75 (56.6%) -29.3 S2000 137.00 (89.4%) -28.6 S2000X5 68.39 (44.6%) -29.9 Terrace evaluation Part 4 Sediment load in the stream01 4.5 Sediment load and riverbed deformation
  • 21.
    21 Terrace evaluation Part 4 Riverbed deformationanalysis02 4.5 Sediment load and riverbed deformation
  • 22.
    22  Terraces significantlydecreased surface runoff and sediment yields in the Wei River basin, and affect the timing of the river stream.  Terraces were also estimated to have decreased sediment transport at the outlet of the watershed by 16.2 million tons per year from 1970 to 2009. The unit area sediment reduction from terrace installation was 30 t/ha.  Terrace effects were important for sediment transport and deposition control, and water quality improvement in the Wei River basin of the Loess Plateau. Conclusions & Future Part 5 5.1 Research conclusions
  • 23.
    23 Conclusions & Future Part 5 5.2Future research Information Part 1  SWAT input reading tools, e.g. ArcSWAT, AVSWAT.  Input conversion tools Watershed evaluation of BMPs in SWAT Scenario Part 2 Model Part 3 Display Part 4  BMPs customer list  Multiple BMPs  Field level  Scenarios comparison  SWAT model  Economic model  Integrated (cost- effective) model  Database functions  SWAT output  Economic output  Integrated (cost- effective) output  Live view output
  • 24.
    24 Hui Shao (orShawn) shaoh@uoguelph.ca University of Guelph