
Recommended
More Related Content
What's hot
What's hot (20)
Similar to Equity bazaar 15.09.2016
Similar to Equity bazaar 15.09.2016 (14)
Recently uploaded
Recently uploaded (20)
Equity bazaar 15.09.2016
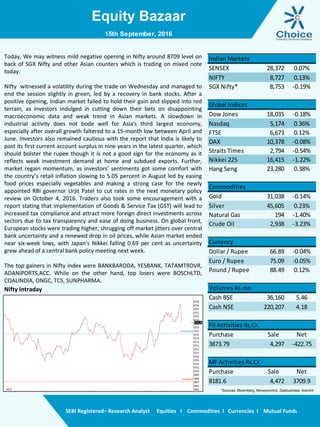
- 1. Equity Bazaar SEBI Registered– Research Analyst Equities I Commodities I Currencies I Mutual Funds Nifty Intraday Today, We may witness mild negative opening in Nifty around 8709 level on back of SGX Nifty and other Asian counters which is trading on mixed note today. Nifty witnessed a volatility during the trade on Wednesday and managed to end the session slightly in green, led by a recovery in bank stocks. After a positive opening, Indian market failed to hold their gain and slipped into red terrain, as investors indulged in cutting down their bets on disappointing macroeconomic data and weak trend in Asian markets. A slowdown in industrial activity does not bode well for Asia's third largest economy, especially after overall growth faltered to a 15-month low between April and June. Investors also remained cautious with the report that India is likely to post its first current account surplus in nine years in the latest quarter, which should bolster the rupee though it is not a good sign for the economy as it reflects weak investment demand at home and subdued exports. Further, market regain momentum, as investors’ sentiments got some comfort with the country’s retail inflation slowing to 5.05 percent in August led by easing food prices especially vegetables and making a strong case for the newly appointed RBI governor Urjit Patel to cut rates in the next monetary policy review on October 4, 2016. Traders also took some encouragement with a report stating that implementation of Goods & Service Tax (GST) will lead to increased tax compliance and attract more foreign direct investments across sectors due to tax transparency and ease of doing business. On global front, European stocks were trading higher, shrugging off market jitters over central bank uncertainty and a renewed drop in oil prices, while Asian market ended near six-week lows, with Japan's Nikkei falling 0.69 per cent as uncertainty grew ahead of a central bank policy meeting next week. The top gainers in Nifty index were BANKBARODA, YESBANK, TATAMTRDVR, ADANIPORTS,ACC. While on the other hand, top losers were BOSCHLTD, COALINDIA, ONGC, TCS, SUNPHARMA. 15th September, 2016 SENSEX 28,372 0.07% NIFTY 8,727 0.13% SGX Nifty* 8,753 -0.19% Global Indices Dow Jones 18,035 -0.18% Nasdaq 5,174 0.36% FTSE 6,673 0.12% DAX 10,378 -0.08% Straits Times 2,794 -0.54% Nikkei 225 16,415 -1.22% Hang Seng 23,280 0.38% Commodities Gold 31,038 -0.14% Silver 45,605 0.23% Natural Gas 194 -1.40% Crude Oil 2,938 -3.23% Currency Dollar / Rupee 66.89 -0.04% Euro / Rupee 75.09 -0.05% Pound / Rupee 88.49 0.12% Volumes Rs.mn Cash BSE 36,160 5.46 Cash NSE 220,207 4.18 FII Activities Rs.Cr. Purchase Sale Net 3873.79 4,297 -422.75 MF Activities Rs.Cr. Purchase Sale Net 8181.6 4,472 3709.9 Indian Markets *Sources- Bloomberg, Moneycontrol, Zeebusiness, livemint
- 2. Equity Bazaar SEBI Registered– Research Analyst Equities I Commodities I Currencies I Mutual Funds Nifty Outlook Bank Nifty Outlook 15th September, 2016 L1 L2 L3 R 8748 8769 8799 S 8697 8668 8646 21 DEMA 8739 50 DEMA 8594 100 DEMA 8375 Moving Averages L1 L2 L3 R 19998 20086 20219 S 19777 19644 19556 21 DEMA 19663 50 DEMA 19069 100 DEMA 18316 Moving Averages Index has started week on turmoil note and on next day its spillover effect has been observed. With two day fall stock has retraced to its rising channel which is acting as support since February month. Recent low is also coinciding with previous upper band of consolidation phase, which can act as good support. Going forward, Nifty is hovering around key level. There can be make or break situation. Immediate resistance for market can be around 8770 and support lies at 8680 to 8660 range. After 4 days steep fall Bank Nifty managed to close on green side. Banking stock has outperformed broader index as well. From candle stick perspective Index has formed bullish engulfing pattern which is reversal pattern but due confirmation required to validate its implication. Index is trading above its 21 day short term moving average and public sector bank again back in action after brief pause. Going forward, mild positive bias can be maintain with upside potential of 20100 and immediate support lies at 19700 level.
- 3. Equity Bazaar SEBI Registered– Research Analyst Equities I Commodities I Currencies I Mutual Funds Derivative Front: The India VIX contraction by 3.13% and reached 14.76. The Nifty was up by 11 points or 0.13% to settle at 8,726.60. From the most active contracts, State Bank of India September 2016 futures traded at a premium of 0.45 points at 254.10 compared with spot closing of 253.65. ICICI Bank September 2016 futures traded at a premium of 1.00 points at 272.85 compared with spot closing of 271.85. Vedanta Industries September 2016 futures traded at a premium of 0.80 points at 166.45 compared with spot closing of 165.65. Axis Bank September 2016 futures traded at a premium of 1.20 points at 604.85 compared with spot closing of 603.65. Tata Motors September 2016 futures traded at a discount of 0.80 points at 563.40 compared with spot closing of 564.20. The Nifty Put Call Ratio (PCR) finally stood at 1.18 for September month contract. The top five scrips with highest PCR on OI were MRF (2.67), CASTROLIND (1.16), MARUTI (1.15), GODREJCP (1.14) and BHARTIARTL (1.01). 15th September, 2016 Long Built Up Symbol Close Price Chng % OI Chng % Buy Above PCJEWELLER 517.60 8.08 33.06 535.86 APOLLOTYRE 214.55 4.84 16.53 219.31 UPL 700.00 7.81 11.54 720.38 KSCL 354.9 4.86 10.47 363.97 Short Covering Symbol Close Price Chng % OI Chng % Buy Above IOC 567.15 2.40 -8.21 573.09 YESBANK 1256.60 3.85 -7.24 1276.90 HDIL 91.30 1.16 -6.83 92.58 HINDZINC 221.2 3.83 -5.56 224.75 Short Built Up Symbol Close Price Chng % OI Chng % Sell Below CASTROLIND 444.95 -4.31 15.91 454.79 BATAINDIA 525.00 -0.45 8.76 532.24 TORNTPHARM 1637.40 -1.28 8.56 1658.79 BEML 1029.35 -1.71 7.50 1044.23 Long Liquidation Symbol Close Price Chng % OI Chng % Sell Below DLF 145.00 -0.45 -6.45 147.18 HINDPETRO 401.20 -66.58 -5.83 406.09 WIPRO 479.00 -0.45 -1.25 481.77 ONGC 248.50 -1.07 -1.05 251.37 INFOSYS CALL RATIO SPREAD View - Moderate Bullish Max. Profit of 32.86 (Rs. 16430), Approx. Loss of 7.14 (Rs. 3570) at SL level 1120 Expiry Date - 29th September, 2016 BUY / SELL QTY STRIKE PRICE SERIES OPTION TYPE Premium BUY 500 1040 SEP CE 31.35 SELL 500 1080 SEP CE 12.10 SELL 500 1080 SEP CE 12.10
- 4. Equity Bazaar SEBI Registered– Research Analyst Equities I Commodities I Currencies I Mutual Funds 15th September, 2016 Symbols CLOSE R3 R2 R1 P S1 S2 S3 Trend Action ACC 1621 1619 1590 1595 1610 1594 1566 1522 Up Buy ADANIPORTS 267 223 216 217 264 260 253 242 Up Buy AMBUJACEM 264 263 259 260 263 261 257 251 Up Buy ASIANPAINT 1165 1045 1025 1030 1165 1150 1136 1107 Up Buy AUROPHARMA 782 765 747 751 783 776 770 757 Down Sell AXISBANK 604 577 569 570 600 595 585 571 Up Buy BAJAJ-AUTO 2965 2763 2706 2755 2966 2938 2911 2857 Down Sell BANKBARODA 169 167 158 159 166 164 159 152 Up Buy BHARTIARTL 320 380 361 363 320 317 314 308 Down Sell BHEL 146 145 139 140 147 144 142 137 Down Sell BOSCHLTD 23005 24177 23800 24100 23185 22771 22536 21887 Down Sell BPCL 575 563 552 554 573 568 561 549 Up Buy CIPLA 579 517 505 507 578 571 564 550 Up Buy COALINDIA 325 324 319 321 325 322 319 313 Up Buy DRREDDY 3166 3610 3544 3561 3157 3144 3122 3087 Up Buy EICHERMOT 22540 19999 19800 19907 22601 22289 22037 21473 Down Sell GAIL 387 399 386 387 387 384 382 376 Down Sell GRASIM 4721 4849 4772 4786 4696 4655 4588 4481 Up Buy HCLTECH 779 725 715 724 783 771 763 743 Down Sell HDFC 1395 1386 1338 1345 1390 1383 1371 1352 Up Buy HDFCBANK 1272 1239 1223 1225 1271 1266 1260 1248 Up Buy HEROMOTOCO 3590 3295 3240 3252 3575 3541 3492 3409 Up Buy HINDALCO 143 141 136 137 142 140 137 132 Up Buy HINDUNILVR 912 947 910 911 914 903 894 875 Down Sell ICICIBANK 272 271 263 263 271 268 263 256 Up Buy IDEA 84 113 103 105 84 83 82 81 Up Buy INDUSINDBK 1192 1145 1127 1130 1192 1182 1173 1154 Up Buy INFRATEL 344 359 351 357 344 340 336 327 Down Sell INFY 1045 1085 1055 1081 1048 1038 1031 1014 Down Sell ITC 253 250 248 249 252 251 248 245 Up Buy KOTAKBANK 806 783 769 780 810 799 793 776 Down Sell LT 1474 1604 1565 1575 1471 1459 1445 1419 Up Buy LUPIN 1532 1690 1660 1665 1535 1520 1508 1482 Down Sell M&M 1414 1482 1464 1468 1418 1403 1391 1364 Down Sell MARUTI 5356 4564 4432 4456 5357 5329 5302 5248 Down Sell NTPC 156 157 155 155 155 153 150 146 Up Buy ONGC 248 229 217 218 249 245 241 234 Down Sell POWERGRID 180 166 163 163 180 179 177 175 Up Buy RELIANCE 1043 1039 1002 1003 1048 1036 1030 1011 Down Sell SBIN 258 234 228 229 256 254 251 246 Up Buy SUNPHARMA 779 781 771 778 783 770 761 740 Down Sell TATAMOTORS 564 505 490 491 558 550 537 515 Up Buy TATAMTRDVR 361 322 313 313 356 351 340 325 Up Buy TATAPOWER 75 72 70 71 75 74 72 70 Up Buy TATASTEEL 374 379 364 365 372 366 357 342 Up Buy TCS 2332 2469 2431 2431 2340 2302 2272 2205 Down Sell TECHM 467 510 503 505 468 463 459 450 Down Sell ULTRACEMCO 3955 3548 3483 3500 3918 3871 3786 3655 Up Buy WIPRO 478 554 545 551 480 474 471 461 Down Sell YESBANK 1254 1184 1170 1174 1238 1219 1184 1130 Up Buy ZEEL 519 475 460 462 516 511 502 489 Up Buy
- 5. Equity Bazaar SEBI Registered– Research Analyst Equities I Commodities I Currencies I Mutual Funds Contact Us www.choicebroking.in Kkunal Parar Sr. Research Associate kkunal.parar@choiceindia.com Vikas Chaudhari Research Associate vikas.chaudhari@choiceindia.com www.choicebroking.incustomercare@choiceindia.com Disclaimer This is solely for information of clients of Choice Broking and does not construe to be an investment advice. It is also not intended as an offer or solicitation for the purchase and sale of any financial instruments. Any action taken by you on the basis of the information contained herein is your responsibility alone and Choice Broking its subsidiaries or its employees or associates will not be liable in any manner for the consequences of such action taken by you. We have exercised due diligence in checking the correctness and authenticity of the information contained in this recommendation, but Choice Broking or any of its subsidiaries or associates or employees shall not be in any way responsible for any loss or damage that may arise to any person from any inadvertent error in the information contained in this recommendation or any action taken on basis of this information. Technical analysis studies market psychology, price patterns and volume levels. It is used to forecast future price and market movements. Technical analysis is complementary to fundamental analysis and news sources. The recommendations issued herewith might be contrary to recommendations issued by Choice Broking in the company research undertaken as the recommendations stated in this report is derived purely from technical analysis. Choice Broking has based this document on information obtained from sources it believes to be reliable but which it has not independently verified; Choice Broking makes no guarantee, representation or warranty and accepts no responsibility or liability as to its accuracy or completeness. The opinions contained within the report are based upon publicly available information at the time of publication and are subject to change without notice. The information and any disclosures provided herein are in summary form and have been prepared for informational purposes. The recommendations and suggested price levels are intended purely for trading purposes. The recommendations are valid for the day of the report however trading trends and volumes might vary substantially on an intraday basis and the recommendations may be subject to change. The information and any disclosures provided herein may be considered confidential. Any use, distribution, modification, copying, forwarding or disclosure by any person is strictly prohibited. The information and any disclosures provided herein do not constitute a solicitation or offer to purchase or sell any security or other financial product or instrument. The current performance may be unaudited. Past performance does not guarantee future returns. There can be no assurance that investments will achieve any targeted rates of return, and there is no guarantee against the loss of your entire investment. POTENTIAL CONFLICT OF INTEREST DISCLOSURE (as on date of report) Disclosure of interest statement – • Analyst interest of the stock /Instrument(s): - No. • Firm interest of the stock / Instrument (s): - No. Amit Pathania Research Associate amit.pathania@choiceindia.com 15th September, 2016 Kapil Shah Research Associate kapil.shah@choiceindia.com Kapil Shah Digitally signed by Kapil Shah DN: cn=Kapil Shah, o=Choice Equity Pvt Ltd, ou=Research Team, email=kapil.shah@choiceindia.com, c=US Date: 2016.09.15 08:42:58 +05'30'