Download to read offline
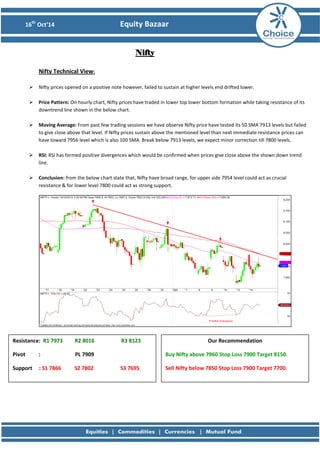
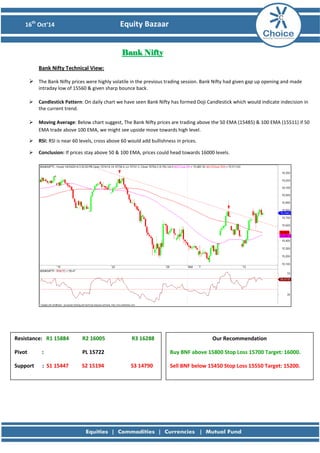
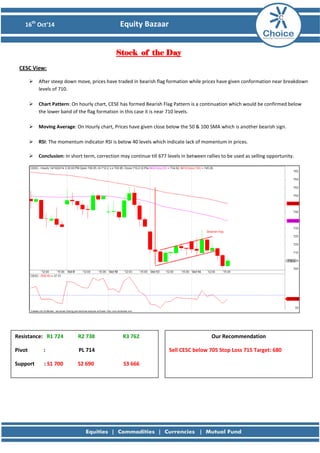
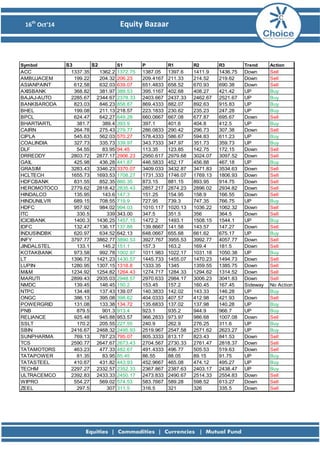

The document provides a technical analysis of the Nifty, Bank Nifty, and CESC stocks. For Nifty, it notes the index opened positively but fell, and provides resistance and support levels. For Bank Nifty, it analyzes the candlestick pattern and moving averages, and gives levels. For CESC, it describes a bearish flag pattern and recommends selling below 705.


