Downloaded 654 times

![Metalorgenic Chemical Vapor Deposition (MOCVD)
[Metalorganic Vapor Phase Epitaxy (MOVPE),
OMCVD, OMVPE]
One of the premier techniques for epitaxial growth of thin layer
structures (semiconductors, oxides, superconductors)
Introduced around 25 years ago as the most versatile technique for
growing semiconductor films.
Wide application for devices such Lasers, LEDs, solar cells,
photodetectors, HBTs, FETs.
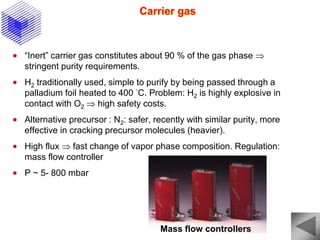
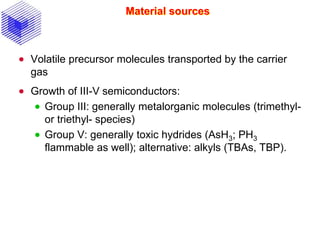
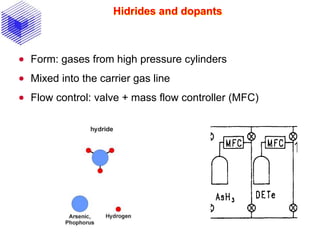
Principle of operation: transport of precursor molecules (group-III
metalorganics + group-V hydrides or alkyls) by a carrier gas (H2, N2)
onto a heated substrate; surface chemical reactions.
Complex transport phenomena and reactions, complicated models to
determine reactor designs,growth modes and rates.
In-situ diagnostics less common than in MBE.](https://image.slidesharecdn.com/epitaxy3-150526144756-lva1-app6892/85/Part-III-Metal-Organic-Chemical-Vapor-Deposition-2-320.jpg)
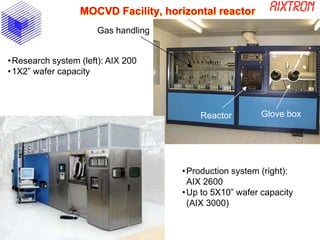
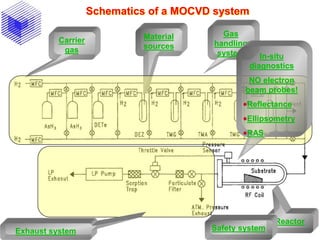

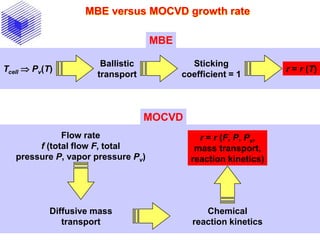
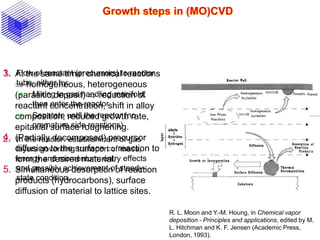
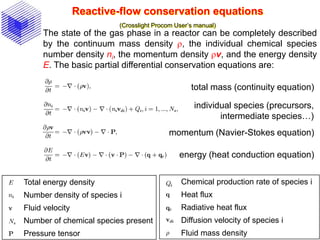

MOCVD is a technique used to deposit thin films through chemical vapor deposition using metalorganic precursors. Key aspects of MOCVD include: - Metalorganic precursors are transported by a carrier gas into a heated reactor where surface reactions occur to deposit the desired material on a substrate. - MOCVD systems include gas delivery components, horizontal or vertical reactors, and exhaust/safety systems. In-situ diagnostics like reflectance anisotropy spectroscopy are used. - The MOCVD growth process involves transport of precursors to the reactor, chemical reactions in the gas and at the surface, diffusion of reactants to the surface, and deposition through surface reactions and product desorption. Conservation equations model the


![Thin_Film_Technology_introduction[1]](https://cdn.slidesharecdn.com/ss_thumbnails/1b4496c8-2102-411b-8465-a3dd3f398327-150205034538-conversion-gate02-thumbnail.jpg?width=640&height=640&fit=bounds)


![Getting Started with Apache Spark: Big Data Made Simple [Free Meetup]](https://cdn.slidesharecdn.com/ss_thumbnails/apachesparkgettingstarted-260203175547-8361bcc3-thumbnail.jpg?width=640&height=640&fit=bounds)


