Downloaded 13 times
![IJRET: International Journal of Research in Engineering and Technology eISSN: 2319-1163 | pISSN: 2321-7308
_______________________________________________________________________________________
Volume: 05 Issue: 03 | Mar-2016, Available @ http://www.ijret.org 390
ENGINEERING ECONOMICS AND LIFE CYCLE COST ANALYSIS
Dhruv J. Desai1
, Tejas H. Jain2
, Atul A. Dwivedi3
, Anjum D. Attar4
1
M.H.SabooSiddik College of Engineering, Maharashtra, India
2
M.H.SabooSiddik College of Engineering, Maharashtra, India
3
M.H.SabooSiddik College of Engineering, Maharashtra, India
4
M.H.SabooSiddik College of Engineering, Maharashtra, India
Abstract
Life-cycle cost analysis (LCCA) is anevaluating tool to valuate the total financial/resource requirements for total ownership of a
building. LCCA is effective when project options that fulfill the same task demands, having different initial costs and operational
costs, needs to be examined in order to undertake the option that optimizes financial requirements.
Building-related expenses can be furthercategorized into the following:
Initial Costs
Operation, Maintenance, and Repair Costs
Replacement Costs
Residual Values
Finance Charges
Non-Monetary Costs
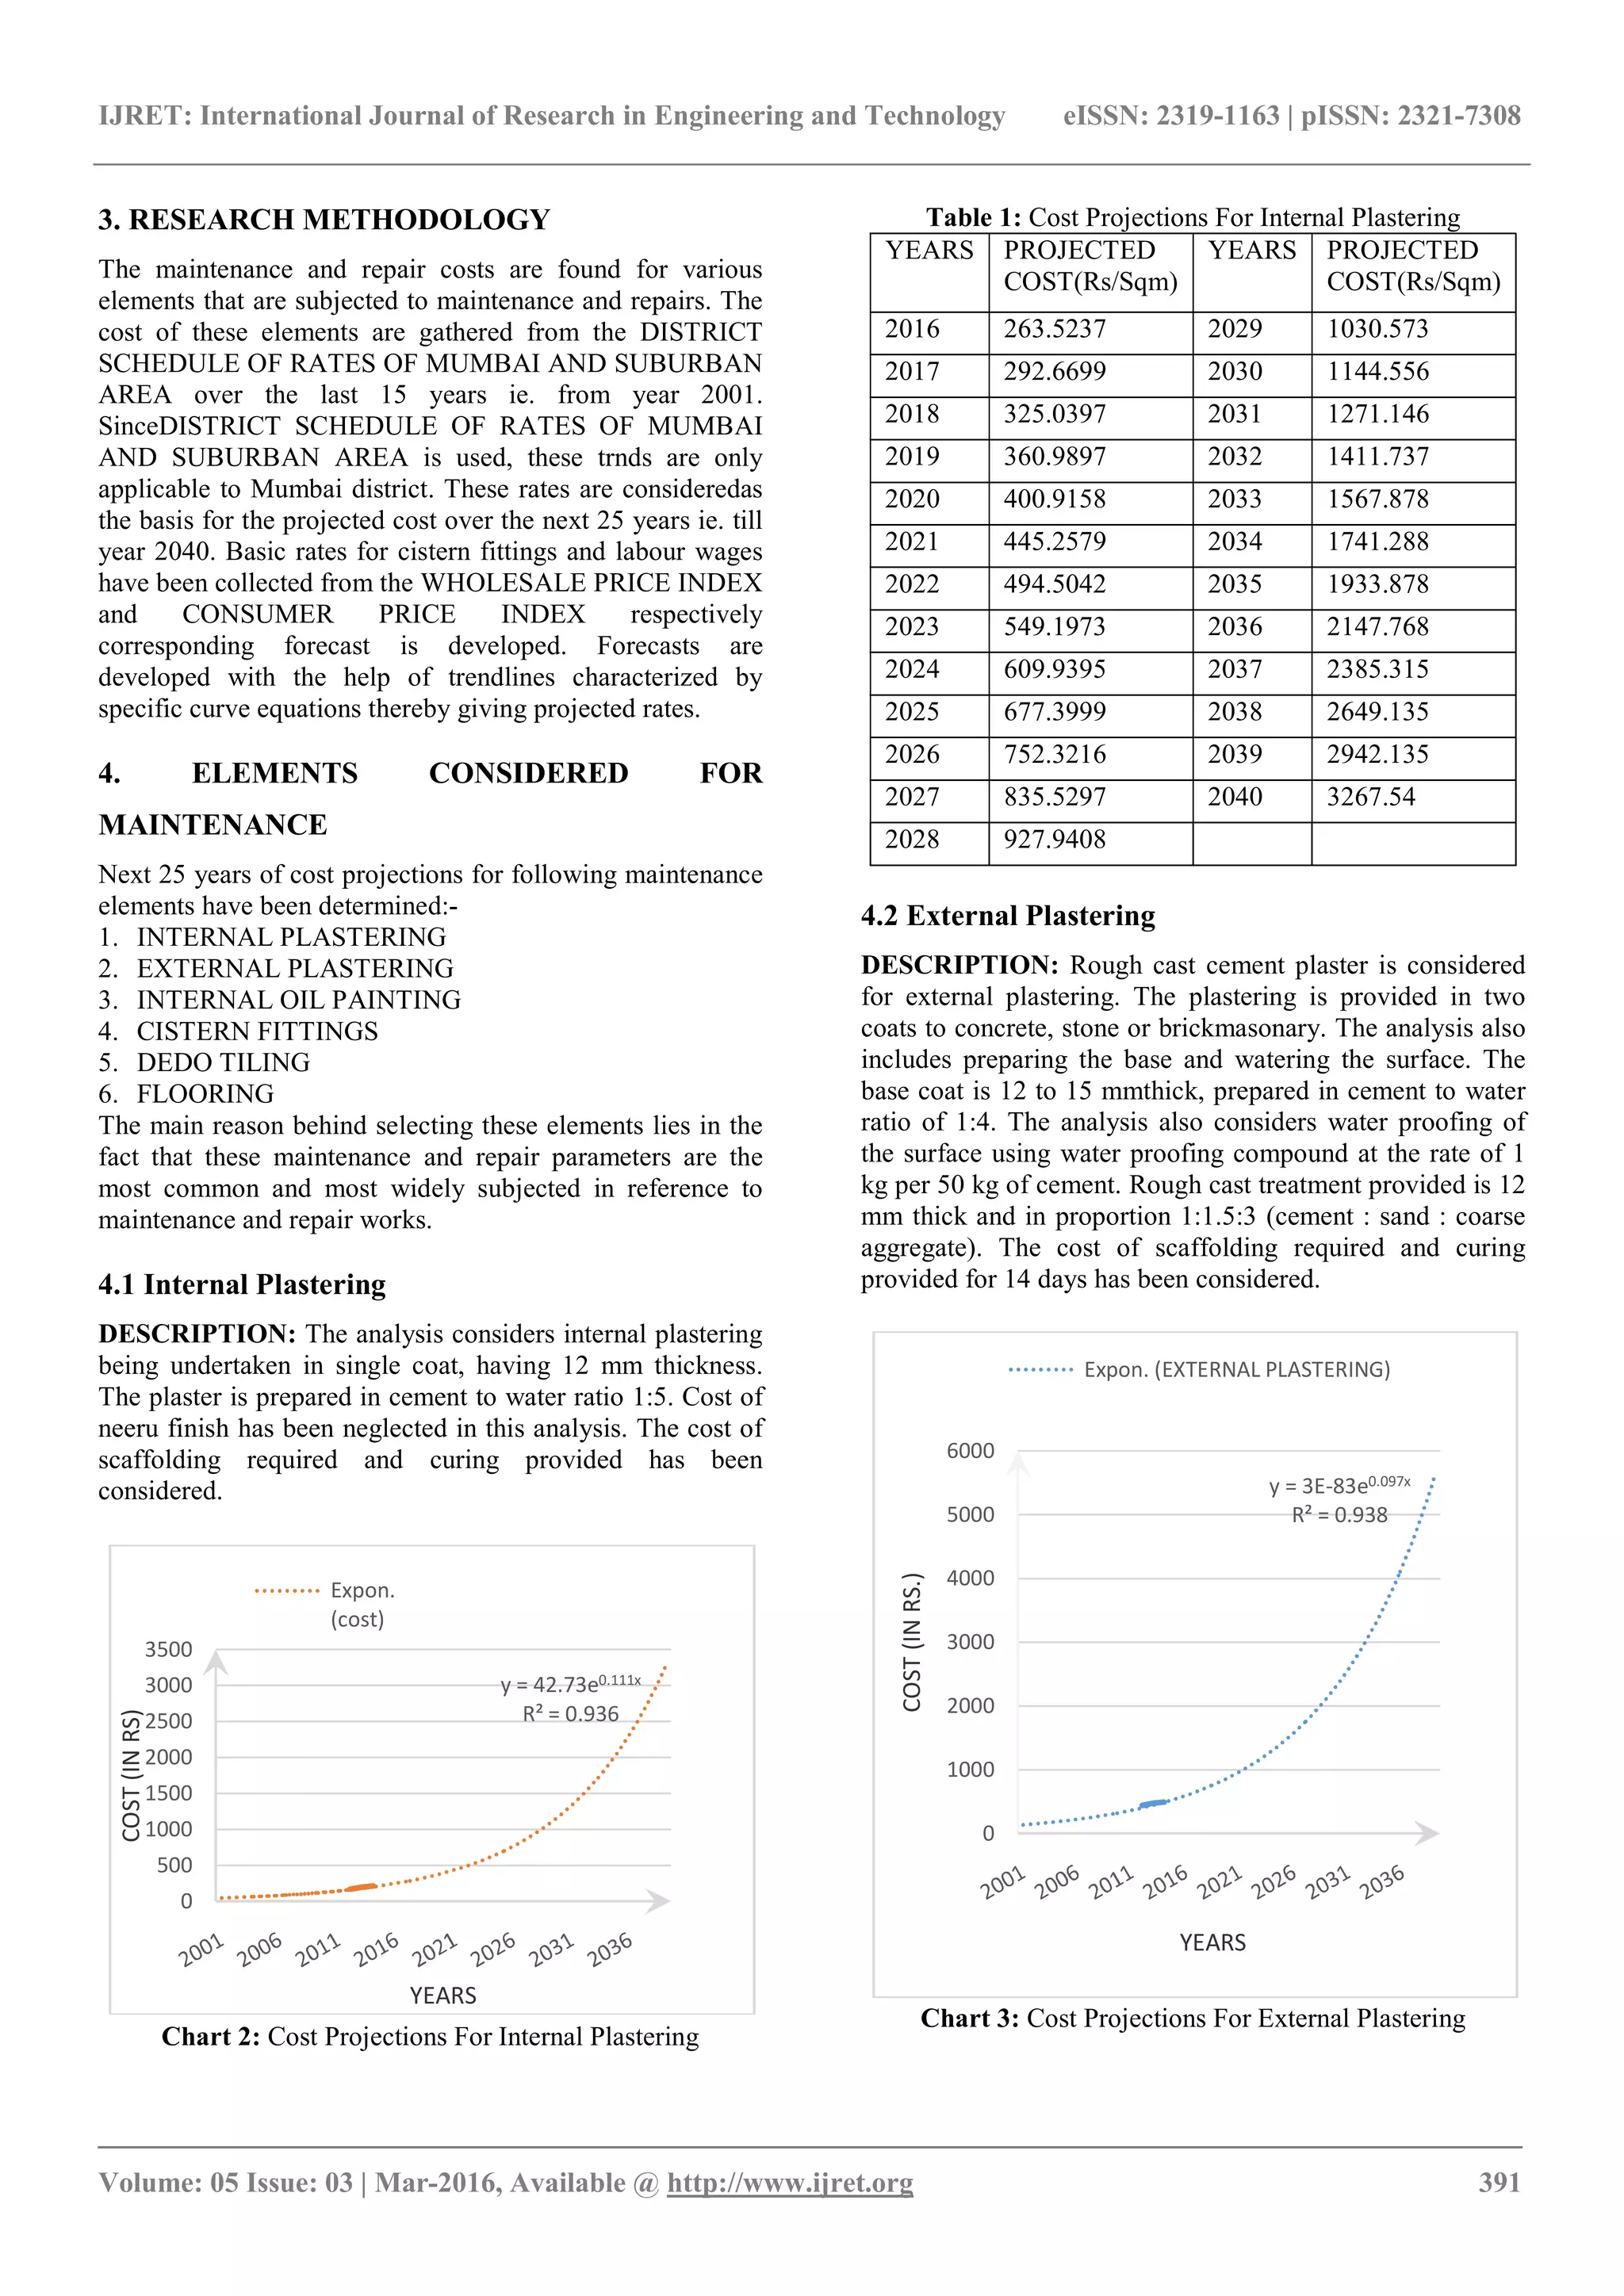
This article mainly focuses on the Maintenance and Repair cost analysis; giving probable trends for next 25 years for various
elements using DSR, WPI and CPI. These trends are only applicable for the whole of Mumbai.
Keyordsw: Life Cycle Cost, Maintenance and Repair cost.
--------------------------------------------------------------------***----------------------------------------------------------------------
1. LIFE CYCLE COST ANALYSIS
.Life Cycle Cost Analysis is a method of estimating the
economic performance of a building over its life period. It is
also known as “whole cost accounting” or “total cost of
ownership,” LCCA balances the intial stage investment with
life period costs including owning cost and operating cost of
that particular building.
LCCA is calculated on the premises that different building
design alternatives can accomplish the same functions with
the same amount of efficiency. These options having
different initial costs, operational costs, maintenance and
repair costs and may also differ in life cycle periods.
Considering a particular alternative, LCCA forecasts the
total cost of building, including initial construction cost,
operation and maintenance cost, for a particular life of the
building, cited as “study period”.
Life cycle cost analysis helps in maintaining a balance
between the initial cost of any alternative process adopted
and long term cost saving of that alternative process. LCCA
also helps in narrowing the most cost effective alternative
and also calculates the “payback” period of the increased
cost. To estimate life cycle cost for allapplicable alternatives
is not feasible, and therefore the guiding principle for LCCA
considers the one which affects the long-term expenses.
1.1Importance of LCCA
[1].As the CHART-1 below depicts 30 year cost analysis of
a building’s life, including its construction costs, its
maintenance costs, operation costs, and utility costs.
CHART–1:30-YEAR ANALYSIS
Since it is evident that for a 30-year period, maintenance
cost accounts nearly 6% of the total cost, the Maintenance
and Repair cost analysis will be the prime focus of this
article.
2. MAINTENANCE AND REPAIR
Building repairs and maintenance mainly consists
ofconserving proper state of a building, its functions and
utilities in routine use.
The types of building repair and maintenance are:
Day to day repairs service facilities
Annual repairs
Special repairs
Additions and alterations
Preventive maintenance
28 %
6 %
4 %
4 %
58 %
30-YEARS LIFE CYCLE COST (%)
UTILITIES MAINTENANCE
SERVICES SYSTEM REPLACEMENT](https://image.slidesharecdn.com/engineeringeconomicsandlifecyclecostanalysis-160921084515/75/Engineering-economics-and-life-cycle-cost-analysis-1-2048.jpg)

The document discusses life-cycle cost analysis (LCCA) as a method for evaluating the total financial requirements for building ownership, emphasizing maintenance and repair costs for various building elements in Mumbai. It outlines projected cost trends for maintenance components over the next 25 years, such as internal plastering, external plastering, and flooring. The analysis uses data from the district schedule of rates and price indexes to forecast these costs, providing insight into the long-term financial implications of maintaining buildings.


![[Vihreä Foorumi 26.4.] Maija Virta, FIGBC](https://cdn.slidesharecdn.com/ss_thumbnails/caseicadeberlin-120503062453-phpapp02-thumbnail.jpg?width=640&height=640&fit=bounds)


