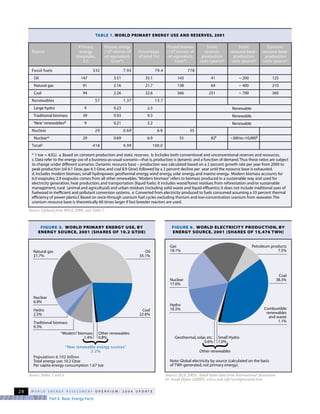
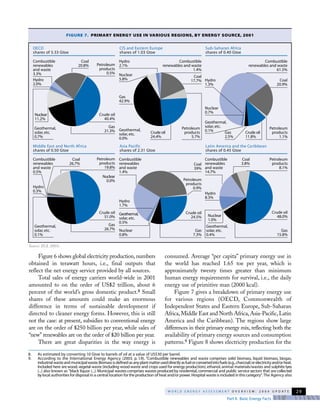
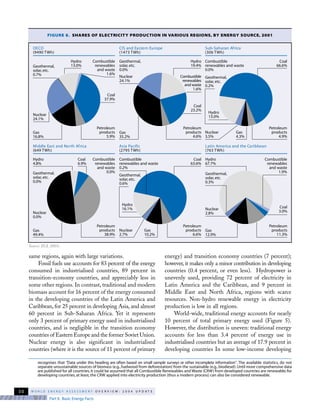
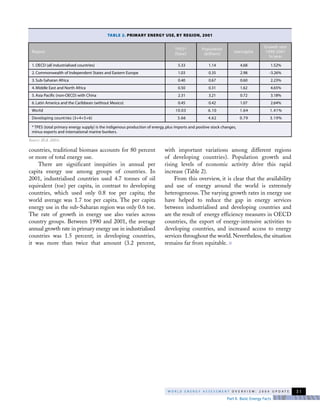
W O R L D E N E R G Y A S S E S S M E N T O V E R V I E W : 2 0 0 4 U P D A T E 25
n energy system is made up of an energy supply sector and energy
end-use technologies. The objective of an energy system is to deliver
to consumers the benefits that energy use offers. The term energy services is
used to describe these benefits,which for households include illumination,cooked
food, comfortable indoor temperatures, refrigeration, telecommunications,
education, and transportation. Energy services are also required for virtually
every commercial and industrial activity. For instance, heating and cooling
are needed for many industrial processes, motive power is needed for
agriculture and industry, and electricity is needed for telecommunications
and electronics. It is the availability of and access to energy services, not
merely energy supply, that is crucial.
The energy chain that delivers these services begins with the collection
or extraction of primary energy that, in one or several steps, may be converted
into energy carriers, or final energy such as electricity or diesel oil that are
suitable for end uses. Energy end-use equipment – stoves, light bulbs, vehicles,
machinery, etc. – converts the final energy into useful energy, which (with
the help of additional technologies) provides the desired benefits: the energy
services. An example of an energy chain – beginning with natural gas
extracted from a well (primary energy) and ending with produced garments
as an energy service – is shown in Figure 2.
Energy services result from a combination of various technologies,
infrastructure (capital), labour (know how), materials, and primary energy.
Each of these inputs carries a price tag, and they are partly substitutable for
one another. From the consumer’s perspective, the important issues are the
economic value or utility derived from the services. Consumers are often
unaware of the upstream activities required to produce energy services.
One way to capture the importance of energy services (not merely energy
use or supply as an end in itself) is to show its impact on the human development
part II
BasicEnergyFacts
A
index (HDI), a composite indicator developed by UNDP
to show countries’ relative well being in social as well as
economic terms. Figure 3 displays the correlation
between a country’s human development index ranking
and per capita energy use, with commercial energy used
as a proxy for energy services. Because the efficiency of
energy use in countries with the lowest per capita energy
use is much lower than in countries with higher per
capita energy use, the relative level of energy services is
even lower in the low per capita energy use countries.
Thus Figure 3 shows that an HDI of 0.8 or higher
currently requires a minimum energy use of about
1 tonne of oil-equivalent per year per capita (or 42 GJ
per capita). It is noteworthy that a higher than ten-fold
increase in consumption of energy does not increase
the HDI significantly.
In most low-income developing countries, a small,
affluent minority uses various forms of commercial
energy in much the same way as most people in the
industrialised world do. However, most people in
low-income developing countries rely on traditional,
non-commercial sources of energy using inefficient
technologies such as unventilated stoves or open fires.
Traditional energy sources are generally not reflected
in energy statistics. Analysis based on “per capita”
consumption of commercially distributed energy
resources is common because the data are much easier
to collect. The resulting analysis, however, does not
accurately reflect the world’s energy situation. Though
less well-documented, non-commercial energy is very
significant globally, and is used far more widely than
commercial energy in rural areas of many developing
countries, particularly the least developed countries.
Per capita use of primary energy in North America
was 280 gigajoules in 2000, more than eleven times as
much as used by an average sub-Saharan African (who
used 25 gigajoules that year when both commercial and
non-commercial energy are included).7 In OECD Europe
and OECD Pacific – developed countries in those
regions – per capita energy use was about 142 and 180
GJ, respectively. Figure 4 shows per capita commercial
and non-commercial energy use in various regions.
Table 1 and Figure 5 show 2001 global primary
energy use, including both commercial and non-
commercial sources of energy. Fossil fuels (oil,
natural gas, and coal) represent nearly 80 percent of
the total. Nuclear power contributes approximately
7 percent; however, because nuclear power plants
have only one third of thermal efficiency, the final
electricity generated for consumption is basically the
same as that generated by large hydropower. Large
hydropower and “new” renewables (which includes
modern uses of biomass and small hydropower,
geothermal, wind, solar, and marine energy) each
contribute slightly more than 2 percent; the percentage
contribution of “new renewable energy sources” has
changed little in recent years.
Part II. Basic Energy Facts
W O R L D E N E R G Y A S S E S S M E N T O V E R V I E W : 2 0 0 4 U P D A T E26
FIGURE 2. AN EXAMPLE OF THE ENERGY CHAIN
FROM EXTRACTION TO SATISFACTION OF NEEDS
Energy services
Extraction and treatment
Primary energy Natural gas
Conversion technologies Power plant,
cogeneration plant
Distribution technologies Electricity grid
Final energy Electricity
Useful energy Motive power
End-use technologies 1 Electric motors
End-use technologies 2
Satisfaction of human needs
Textile processing
Garments
Energy sector
Energy system
Natural gas well
Energy services
———————————————————————————————————————————————————————————————————
7. In this report, the term commercial energy refers to fossil fuels (oil, coal, and natural gas), nuclear energy, and large-scale hydropower. The term
traditional energy is used to denote locally collected and often unprocessed biomass-based fuels, such as crop residues, wood, and animal dung.
Most traditional energy is used non-commercially (i.e.,non-commercialenergy).Although traditional energy sources can be used renewably,the term
new renewables refers to modern biofuels, wind, solar, small-scale hydropower, marine, and geothermal energy.
W O R L D E N E R G Y A S S E S S M E N T O V E R V I E W : 2 0 0 4 U P D A T E
Part II. Basic Energy Facts
27
FIGURE 3. RELATIONSHIP BETWEEN HDI AND PER CAPITA ENERGY USE, 1999/2000
Per capita energy consumption (kgoe/capita)
0 1000 2000 3000 4000 5000 6000 7000 8000 9000 10000 11000 12000 13000
1.0
0.9
0.8
0.7
0.6
0.5
0.4
0.3
0.2
HDI
Iceland
United States
Finland
Singapore
Belgium
France
Russia
Slovak Republic
Italy
Hungary
Argentina
Ukraine
Gabon
Brazil
Zimbabwe
Nigeria
Mozambique
FIGURE 4. PER CAPITA ENERGY USE (COMMERCIAL AND NON-COMMERCIAL), BY REGION, 2000
Sources: IEA, 2002a and 2002b.
Notes: Asia excludes Middle East, China, and
OECD countries;Middle East and North Africa
comprises Algeria, Bahrain, Egypt, Iran, Iraq,
Israel,Jordan,Kuwait,Lebanon,Libya,Morocco,
Oman,Qatar,Saudi Arabia,Syria,Tunisia,United
Arab Emirates and Yemen; Latin America and
Caribbean excludes Mexico; OECD Pacific
comprises Australia, Japan, Korea, and New
Zealand; Former USSR comprises Armenia,
Azerbaijan,Belarus,Estonia,Georgia,Kazakhstan,
Kyrgyzstan, Latvia, Lithuania, Moldova, Russia,
Tajikistan,Turkmenistan, Ukraine, and
Uzbekistan; Non-OECD Europe consists of
Albania, Bosnia and Herzegovina, Bulgaria,
Croatia, Cyprus, Gibraltar, Macedonia, Malta,
Romania, and Slovenia; OECD North
America includes Mexico.
Gigajoules per capita
0 50 100 150 200 250 300
25
38
25
68
46
133
69
142
180
281
Asia
China
Sub-Saharan Africa
Middle East and North Africa
Latin America and Caribbean
Former USSR
Non-OECD Europe
OECD Europe
OECD Pacific
OECD North America
Part II. Basic Energy Facts
W O R L D E N E R G Y A S S E S S M E N T O V E R V I E W : 2 0 0 4 U P D A T E28
TABLE 1. WORLD PRIMARY ENERGY USE AND RESERVES, 2001
Primary
energy
(exajoules,
EJ)
332
147
91
94
57
9
39
9
29
29
418
Primary energy
(109 tonnes of
oil equivalent,
Gtoe*)
7.93
3.51
2.16
2.26
1.37
0.23
0.93
0.21
0.69
0.69
9.99
Percentage
of total (%)
79.4
35.1
21.7
22.6
13.7
2.3
9.3
2.2
6.9
6.9
100.0
Proved reserves
(109 tonnes of
oil equivalent,
Gtoe*)
778
143
138
566
55
55
Static
reserve-
production
ratio (years)a
41
64
251
82f
Static
resource base–
production
ratio (years)b
~ 200
~ 400
~ 700
~300to>10,000f
Dynamic
resource base–
production
ratio (years)c
125
210
360
Source
Fossil fuels
Oil
Natural gas
Coal
Renewables
Large hydro
Traditional biomass
‘New’renewablesd
Nuclear
Nucleare
Totalf
* 1 toe = 42GJ. a. Based on constant production and static reserves. b. Includes both conventional and unconventional reserves and resources.
c.Data refer to the energy use of a business-as-usual scenario—that is, production is dynamic and a function of demand.Thus these ratios are subject
to change under different scenarios. Dynamic resource base – production was calculated based on a 2 percent growth rate per year from 2000 to
peak production (oil 6.1 Gtoe, gas 6.3 Gtoe, and coal 8.9 Gtoe), followed by a 2 percent decline per year until the resource base is exhausted.
d. Includes modern biomass, small hydropower, geothermal energy, wind energy, solar energy, and marine energy. Modern biomass accounts for
6.0 exajoules; 2.9 exajoules comes from all other renewables.“Modern biomass”refers to biomass produced in a sustainable way and used for
electricity generation, heat production, and transportation (liquid fuels). It includes wood/forest residues from reforestation and/or sustainable
management, rural (animal and agricultural) and urban residues (including solid waste and liquid effluents); it does not include traditional uses of
fuelwood in inefficient and pollutant conversion systems. e.Converted from electricity produced to fuels consumed assuming a 33 percent thermal
efficiency of power plants.f. Based on once-through uranium fuel cycles excluding thorium and low-concentration uranium from seawater.The
uranium resource base is theoretically 60 times larger if fast breeder reactors are used.
Renewable
Renewable
Renewable
Source: Updated from WEA, 2000, and Table 7.
FIGURE 5. WORLD PRIMARY ENERGY USE, BY
ENERGY SOURCE, 2001 (SHARES OF 10.2 GTOE)
Natural gas
21.7%
Nuclear
6.9%
Hydro
2.3%
Traditional biomass
9.3%
Population: 6.102 billion
Total energy use: 10.2 Gtoe
Per capita energy consumption: 1.67 toe
Oil
35.1%
Coal
22.6%
“Modern”biomass
1.4%
“New renewable energy sources”
2.2%
Other renewables
0.8%
Source: Tables 1 and 6.
}
FIGURE 6. WORLD ELECTRICITY PRODUCTION, BY
ENERGY SOURCE, 2001 (SHARES OF 15,476 TWH)
Gas
18.1%
Nuclear
17.0%
Hydro
16.5%
Note: Global electricity by source (calculated on the basis
of TWh generated, not primary energy).
Petroleum products
7.5%
Coal
38.3%
Combustible
renewables
and waste
1.1%
Geothermal, solar, etc.
0.6%
Other renewables
Small Hydro
1.0%
Sources: IEA, 2003c. Small hydro data from International Association
for Small Hydro (IASH), www.iash.info/worldpotential.htm.
}
W O R L D E N E R G Y A S S E S S M E N T O V E R V I E W : 2 0 0 4 U P D A T E
Part II. Basic Energy Facts
29
Figure 6 shows global electricity production, numbers
obtained in terawatt hours, i.e., final outputs that
reflect the net energy service provided by all sources.
Total sales of energy carriers world-wide in 2001
amounted to on the order of US$2 trillion, about 6
percent of the world’s gross domestic product.8 Small
shares of these amounts could make an enormous
difference in terms of sustainable development if
directed to cleaner energy forms. However, this is still
not the case: at present, subsidies to conventional energy
are on the order of $250 billion per year, while sales of
“new” renewables are on the order of $20 billion per year.
There are great disparities in the way energy is
consumed. Average “per capita” primary energy use in
the world has reached 1.65 toe per year, which is
approximately twenty times greater than minimum
human energy requirements for survival, i.e., the daily
energy use of primitive man (2000 kcal).
Figure 7 gives a breakdown of primary energy use
for various regions (OECD, Commonwealth of
Independent States and Eastern Europe, Sub-Saharan
Africa,Middle East and North Africa,Asia-Pacific,Latin
America and the Caribbean). The regions show large
differences in their primary energy mix, reflecting both the
availability of primary energy sources and consumption
patterns.9 Figure 8 shows electricity production for the
———————————————————————————————————————————————————————————————————
8. As estimated by converting 10 Gtoe to barrels of oil at a value of US$30 per barrel.
9. According to the International Energy Agency (2003, p. I.9), "Combustible renewables and waste comprises solid biomass, liquid biomass, biogas,
industrial wasteandmunicipalwaste.Biomassisdefinedasanyplantmatteruseddirectlyasfuelorconvertedintofuels(e.g.,charcoal)orelectricityand/orheat.
Included here arewood, vegetal waste (including wood waste and crops used for energy production), ethanol, animal materials/wastes and sulphite lyes
(...) also known as "black liquor (...). Municipal wastes comprises wastes producedby residential, commercial and public service sectors that are collected
by local authorities for disposal in a central location for the production of heat and/or power.Hospital waste is included in this category".The Agency also
FIGURE 7. PRIMARY ENERGY USE IN VARIOUS REGIONS, BY ENERGY SOURCE, 2001
Source: IEA, 2003c.
OECD
shares of 5.33 Gtoe
Crude oil
40.4%
Petroleum
products
0.5%
Coal
20.8%
Combustible
renewables
and waste
3.3%
Hydro
2.0%
Geothermal,
solar, etc.
0.7%
Nuclear
11.2%
Gas
21.3%
CIS and Eastern Europe
shares of 1.03 Gtoe
Crude oil
24.4%
Petroleum
products
5.7%
Combustible
renewables and waste
1.4%
Coal
17.7%
Hydro
2.1%
Geothermal,
solar, etc.
0.0%
Nuclear
5.8%
Gas
42.9%
Sub-Saharan Africa
shares of 0.40 Gtoe
Crude oil
11.8%
Petroleum
products
1.1%
Combustible
renewables and waste
61.5%
Coal
20.9%
Hydro
1.3%
Geothermal,
solar, etc.
0.1%
Nuclear
0.7%
Gas
2.5%
Middle East and North Africa
shares of 0.50 Gtoe
Crude oil
51.0%
Petroleum
products
19.8%
Coal
26.7%
Combustible
renewables
and waste
0.5%
Hydro
0.3%
Geothermal,
solar, etc.
0.1%
Nuclear
0.0%
Gas
26.7%
Asia Pacific
shares of 2.31 Gtoe
Nuclear
0.8%
Petroleum
products
0.9%
Combustible
renewables
and waste
1.4%
Coal
39%
Geothermal,
solar, etc.
0.5%
Hydro
1.7%
Crude oil
24.5%
Gas
7.3%
Latin America and the Caribbean
shares of 0.45 Gtoe
Petroleum
products
8.1%
Crude oil
48.0%
Combustible
renewables
and waste
14.7%
Coal
3.8%
Hydro
8.3%
Geothermal,
solar, etc.
0.4%
Nuclear
1.0%
Gas
15.8%
same regions, again with large variations.
Fossil fuels use accounts for 83 percent of the energy
consumed in industrialised countries, 89 percent in
transition-economy countries, and appreciably less in
some other regions. In contrast, traditional and modern
biomass account for 16 percent of the energy consumed
in the developing countries of the Latin America and
Caribbean, for 25 percent in developing Asia, and almost
60 percent in Sub-Saharan Africa. Yet it represents
only 3 percent of primary energy used in industrialised
countries, and is negligible in the transition economy
countries of Eastern Europe and the former Soviet Union.
Nuclear energy is also significant in industrialised
countries (where it is the source of 11 percent of primary
energy) and transition economy countries (7 percent);
however, it makes only a minor contribution in developing
countries (0.4 percent, or even less). Hydropower is
unevenly used, providing 72 percent of electricity in
Latin America and the Caribbean, and 9 percent in
Middle East and North Africa, regions with scarce
resources. Non-hydro renewable energy in electricity
production is low in all regions.
World-wide, traditional energy accounts for nearly
10 percent of total primary energy used (Figure 5).
However, the distribution is uneven: traditional energy
accounts for less than 3.4 percent of energy use in
industrialised countries but an average of 17.9 percent in
developing countries In some low-income developing
Part II. Basic Energy Facts
W O R L D E N E R G Y A S S E S S M E N T O V E R V I E W : 2 0 0 4 U P D A T E30
———————————————————————————————————————————————————————————————————
recognises that "Data under this heading are often based on small sample surveys or other incomplete information". The available statistics, do not
separate unsustainable sources of biomass (e.g.,fuelwood from deforestation) from the sustainable (e.g.,biodiesel).Until more comprehensive data
are published for all countries,it could be assumed that all Combustible Renewables and Waste (CRW) from developed countries are renewable; for
developing countries, at least, the CRW applied into electricity production (thus a modern process) can also be considered renewable.
FIGURE 8. SHARES OF ELECTRICITY PRODUCTION IN VARIOUS REGIONS, BY ENERGY SOURCE, 2001
Source: IEA, 2003c.
OECD
(9490 TWh)
Coal
37.9%
Combustible
renewables
and waste
1.6%
Hydro
13.0%Geothermal,
solar, etc.
0.7%
Nuclear
24.1%
Petroleum
products
5.9%
Gas
16.8%
Middle East and North Africa
(649 TWh)
Combustible
renewables
and waste
0.0%
Coal
6.9%
Geothermal,
solar, etc.
0.0%
Nuclear
0.0%
Petroleum
products
38.9%
Hydro
4.8%
Gas
49.4%
Sub-Saharan Africa
(306 TWh)
Coal
66.6%
Hydro
13.0%
Geothermal,
solar, etc.
0.2%
Nuclear
3.5%
Petroleum
products
4.9%
Gas
4.3%
CIS and Eastern Europe
(1473 TWh)
Coal
23.2%
Hydro
19.4%
Combustible
renewables
and waste
1.6%
Combustible
renewables and waste
0.0%
Geothermal,
solar, etc.
0.0%
Nuclear
24.1%
Petroleum
products
4.6%
Gas
35.2%
Latin America and the Caribbean
(763 TWh)
Coal
3.0%
Hydro
67.7%
Combustible
renewables
and waste
1.9%Geothermal,
solar, etc.
0.3%
Nuclear
2.8%
Petroleum
products
11.3%
Gas
12.9%
Asia Pacific
(2795 TWh)
Coal
63.6%
Hydro
16.1%
Geothermal,
solar, etc.
0.6%
Nuclear
2.7%
Petroleum
products
6.6%
Gas
10.2%
Combustible
renewables and waste
0.2%
W O R L D E N E R G Y A S S E S S M E N T O V E R V I E W : 2 0 0 4 U P D A T E
Part II. Basic Energy Facts
31
countries, traditional biomass accounts for 80 percent
or more of total energy use.
There are significant inequities in annual per
capita energy use among groups of countries. In
2001, industrialised countries used 4.7 tonnes of oil
equivalent (toe) per capita, in contrast to developing
countries, which used only 0.8 toe per capita; the
world average was 1.7 toe per capita. The per capita
energy use in the sub-Saharan region was only 0.6 toe.
The rate of growth in energy use also varies across
country groups. Between 1990 and 2001, the average
annual growth rate in primary energy use in industrialised
countries was 1.5 percent; in developing countries,
it was more than twice that amount (3.2 percent,
with important variations among different regions
of developing countries). Population growth and
rising levels of economic activity drive this rapid
increase (Table 2).
From this overview, it is clear that the availability
and use of energy around the world is extremely
heterogeneous. The varying growth rates in energy use
have helped to reduce the gap in energy services
between industrialised and developing countries and
are the result of energy efficiency measures in OECD
countries, the export of energy-intensive activities to
developing countries, and increased access to energy
services throughout the world. Nevertheless, the situation
remains far from equitable. s
TABLE 2. PRIMARY ENERGY USE, BY REGION, 2001
TPES*
(Gtoe)
5.33
1.03
0.40
0.50
2.31
0.45
10.03
3.66
Population
(billions)
1.14
0.35
0.67
0.31
3.21
0.42
6.10
4.62
toe/capita
4.68
2.98
0.60
1.62
0.72
1.07
1.64
0.79
Growth rate
1990-2001
%/year
1.52%
-3.26%
2.23%
4.65%
3.18%
2.64%
1.41%
3.19%
Region
1. OECD (all industrialised countries)
2. Commonwealth of Independent States and Eastern Europe
3. Sub-Saharan Africa
4. Middle East and North Africa
5. Asia Pacific (non-OECD) with China
6. Latin America and the Caribbean (without Mexico)
World
Developing countries (3+4+5+6)
* TPES (total primary energy supply) is the indigenous production of energy, plus imports and positive stock changes,
minus exports and international marine bunkers.
Source: IEA, 2003c.

Basic energy facts

  • 1.
    W O RL D E N E R G Y A S S E S S M E N T O V E R V I E W : 2 0 0 4 U P D A T E 25 n energy system is made up of an energy supply sector and energy end-use technologies. The objective of an energy system is to deliver to consumers the benefits that energy use offers. The term energy services is used to describe these benefits,which for households include illumination,cooked food, comfortable indoor temperatures, refrigeration, telecommunications, education, and transportation. Energy services are also required for virtually every commercial and industrial activity. For instance, heating and cooling are needed for many industrial processes, motive power is needed for agriculture and industry, and electricity is needed for telecommunications and electronics. It is the availability of and access to energy services, not merely energy supply, that is crucial. The energy chain that delivers these services begins with the collection or extraction of primary energy that, in one or several steps, may be converted into energy carriers, or final energy such as electricity or diesel oil that are suitable for end uses. Energy end-use equipment – stoves, light bulbs, vehicles, machinery, etc. – converts the final energy into useful energy, which (with the help of additional technologies) provides the desired benefits: the energy services. An example of an energy chain – beginning with natural gas extracted from a well (primary energy) and ending with produced garments as an energy service – is shown in Figure 2. Energy services result from a combination of various technologies, infrastructure (capital), labour (know how), materials, and primary energy. Each of these inputs carries a price tag, and they are partly substitutable for one another. From the consumer’s perspective, the important issues are the economic value or utility derived from the services. Consumers are often unaware of the upstream activities required to produce energy services. One way to capture the importance of energy services (not merely energy use or supply as an end in itself) is to show its impact on the human development part II BasicEnergyFacts A
  • 2.
    index (HDI), acomposite indicator developed by UNDP to show countries’ relative well being in social as well as economic terms. Figure 3 displays the correlation between a country’s human development index ranking and per capita energy use, with commercial energy used as a proxy for energy services. Because the efficiency of energy use in countries with the lowest per capita energy use is much lower than in countries with higher per capita energy use, the relative level of energy services is even lower in the low per capita energy use countries. Thus Figure 3 shows that an HDI of 0.8 or higher currently requires a minimum energy use of about 1 tonne of oil-equivalent per year per capita (or 42 GJ per capita). It is noteworthy that a higher than ten-fold increase in consumption of energy does not increase the HDI significantly. In most low-income developing countries, a small, affluent minority uses various forms of commercial energy in much the same way as most people in the industrialised world do. However, most people in low-income developing countries rely on traditional, non-commercial sources of energy using inefficient technologies such as unventilated stoves or open fires. Traditional energy sources are generally not reflected in energy statistics. Analysis based on “per capita” consumption of commercially distributed energy resources is common because the data are much easier to collect. The resulting analysis, however, does not accurately reflect the world’s energy situation. Though less well-documented, non-commercial energy is very significant globally, and is used far more widely than commercial energy in rural areas of many developing countries, particularly the least developed countries. Per capita use of primary energy in North America was 280 gigajoules in 2000, more than eleven times as much as used by an average sub-Saharan African (who used 25 gigajoules that year when both commercial and non-commercial energy are included).7 In OECD Europe and OECD Pacific – developed countries in those regions – per capita energy use was about 142 and 180 GJ, respectively. Figure 4 shows per capita commercial and non-commercial energy use in various regions. Table 1 and Figure 5 show 2001 global primary energy use, including both commercial and non- commercial sources of energy. Fossil fuels (oil, natural gas, and coal) represent nearly 80 percent of the total. Nuclear power contributes approximately 7 percent; however, because nuclear power plants have only one third of thermal efficiency, the final electricity generated for consumption is basically the same as that generated by large hydropower. Large hydropower and “new” renewables (which includes modern uses of biomass and small hydropower, geothermal, wind, solar, and marine energy) each contribute slightly more than 2 percent; the percentage contribution of “new renewable energy sources” has changed little in recent years. Part II. Basic Energy Facts W O R L D E N E R G Y A S S E S S M E N T O V E R V I E W : 2 0 0 4 U P D A T E26 FIGURE 2. AN EXAMPLE OF THE ENERGY CHAIN FROM EXTRACTION TO SATISFACTION OF NEEDS Energy services Extraction and treatment Primary energy Natural gas Conversion technologies Power plant, cogeneration plant Distribution technologies Electricity grid Final energy Electricity Useful energy Motive power End-use technologies 1 Electric motors End-use technologies 2 Satisfaction of human needs Textile processing Garments Energy sector Energy system Natural gas well Energy services ——————————————————————————————————————————————————————————————————— 7. In this report, the term commercial energy refers to fossil fuels (oil, coal, and natural gas), nuclear energy, and large-scale hydropower. The term traditional energy is used to denote locally collected and often unprocessed biomass-based fuels, such as crop residues, wood, and animal dung. Most traditional energy is used non-commercially (i.e.,non-commercialenergy).Although traditional energy sources can be used renewably,the term new renewables refers to modern biofuels, wind, solar, small-scale hydropower, marine, and geothermal energy.
  • 3.
    W O RL D E N E R G Y A S S E S S M E N T O V E R V I E W : 2 0 0 4 U P D A T E Part II. Basic Energy Facts 27 FIGURE 3. RELATIONSHIP BETWEEN HDI AND PER CAPITA ENERGY USE, 1999/2000 Per capita energy consumption (kgoe/capita) 0 1000 2000 3000 4000 5000 6000 7000 8000 9000 10000 11000 12000 13000 1.0 0.9 0.8 0.7 0.6 0.5 0.4 0.3 0.2 HDI Iceland United States Finland Singapore Belgium France Russia Slovak Republic Italy Hungary Argentina Ukraine Gabon Brazil Zimbabwe Nigeria Mozambique FIGURE 4. PER CAPITA ENERGY USE (COMMERCIAL AND NON-COMMERCIAL), BY REGION, 2000 Sources: IEA, 2002a and 2002b. Notes: Asia excludes Middle East, China, and OECD countries;Middle East and North Africa comprises Algeria, Bahrain, Egypt, Iran, Iraq, Israel,Jordan,Kuwait,Lebanon,Libya,Morocco, Oman,Qatar,Saudi Arabia,Syria,Tunisia,United Arab Emirates and Yemen; Latin America and Caribbean excludes Mexico; OECD Pacific comprises Australia, Japan, Korea, and New Zealand; Former USSR comprises Armenia, Azerbaijan,Belarus,Estonia,Georgia,Kazakhstan, Kyrgyzstan, Latvia, Lithuania, Moldova, Russia, Tajikistan,Turkmenistan, Ukraine, and Uzbekistan; Non-OECD Europe consists of Albania, Bosnia and Herzegovina, Bulgaria, Croatia, Cyprus, Gibraltar, Macedonia, Malta, Romania, and Slovenia; OECD North America includes Mexico. Gigajoules per capita 0 50 100 150 200 250 300 25 38 25 68 46 133 69 142 180 281 Asia China Sub-Saharan Africa Middle East and North Africa Latin America and Caribbean Former USSR Non-OECD Europe OECD Europe OECD Pacific OECD North America
  • 4.
    Part II. BasicEnergy Facts W O R L D E N E R G Y A S S E S S M E N T O V E R V I E W : 2 0 0 4 U P D A T E28 TABLE 1. WORLD PRIMARY ENERGY USE AND RESERVES, 2001 Primary energy (exajoules, EJ) 332 147 91 94 57 9 39 9 29 29 418 Primary energy (109 tonnes of oil equivalent, Gtoe*) 7.93 3.51 2.16 2.26 1.37 0.23 0.93 0.21 0.69 0.69 9.99 Percentage of total (%) 79.4 35.1 21.7 22.6 13.7 2.3 9.3 2.2 6.9 6.9 100.0 Proved reserves (109 tonnes of oil equivalent, Gtoe*) 778 143 138 566 55 55 Static reserve- production ratio (years)a 41 64 251 82f Static resource base– production ratio (years)b ~ 200 ~ 400 ~ 700 ~300to>10,000f Dynamic resource base– production ratio (years)c 125 210 360 Source Fossil fuels Oil Natural gas Coal Renewables Large hydro Traditional biomass ‘New’renewablesd Nuclear Nucleare Totalf * 1 toe = 42GJ. a. Based on constant production and static reserves. b. Includes both conventional and unconventional reserves and resources. c.Data refer to the energy use of a business-as-usual scenario—that is, production is dynamic and a function of demand.Thus these ratios are subject to change under different scenarios. Dynamic resource base – production was calculated based on a 2 percent growth rate per year from 2000 to peak production (oil 6.1 Gtoe, gas 6.3 Gtoe, and coal 8.9 Gtoe), followed by a 2 percent decline per year until the resource base is exhausted. d. Includes modern biomass, small hydropower, geothermal energy, wind energy, solar energy, and marine energy. Modern biomass accounts for 6.0 exajoules; 2.9 exajoules comes from all other renewables.“Modern biomass”refers to biomass produced in a sustainable way and used for electricity generation, heat production, and transportation (liquid fuels). It includes wood/forest residues from reforestation and/or sustainable management, rural (animal and agricultural) and urban residues (including solid waste and liquid effluents); it does not include traditional uses of fuelwood in inefficient and pollutant conversion systems. e.Converted from electricity produced to fuels consumed assuming a 33 percent thermal efficiency of power plants.f. Based on once-through uranium fuel cycles excluding thorium and low-concentration uranium from seawater.The uranium resource base is theoretically 60 times larger if fast breeder reactors are used. Renewable Renewable Renewable Source: Updated from WEA, 2000, and Table 7. FIGURE 5. WORLD PRIMARY ENERGY USE, BY ENERGY SOURCE, 2001 (SHARES OF 10.2 GTOE) Natural gas 21.7% Nuclear 6.9% Hydro 2.3% Traditional biomass 9.3% Population: 6.102 billion Total energy use: 10.2 Gtoe Per capita energy consumption: 1.67 toe Oil 35.1% Coal 22.6% “Modern”biomass 1.4% “New renewable energy sources” 2.2% Other renewables 0.8% Source: Tables 1 and 6. } FIGURE 6. WORLD ELECTRICITY PRODUCTION, BY ENERGY SOURCE, 2001 (SHARES OF 15,476 TWH) Gas 18.1% Nuclear 17.0% Hydro 16.5% Note: Global electricity by source (calculated on the basis of TWh generated, not primary energy). Petroleum products 7.5% Coal 38.3% Combustible renewables and waste 1.1% Geothermal, solar, etc. 0.6% Other renewables Small Hydro 1.0% Sources: IEA, 2003c. Small hydro data from International Association for Small Hydro (IASH), www.iash.info/worldpotential.htm. }
  • 5.
    W O RL D E N E R G Y A S S E S S M E N T O V E R V I E W : 2 0 0 4 U P D A T E Part II. Basic Energy Facts 29 Figure 6 shows global electricity production, numbers obtained in terawatt hours, i.e., final outputs that reflect the net energy service provided by all sources. Total sales of energy carriers world-wide in 2001 amounted to on the order of US$2 trillion, about 6 percent of the world’s gross domestic product.8 Small shares of these amounts could make an enormous difference in terms of sustainable development if directed to cleaner energy forms. However, this is still not the case: at present, subsidies to conventional energy are on the order of $250 billion per year, while sales of “new” renewables are on the order of $20 billion per year. There are great disparities in the way energy is consumed. Average “per capita” primary energy use in the world has reached 1.65 toe per year, which is approximately twenty times greater than minimum human energy requirements for survival, i.e., the daily energy use of primitive man (2000 kcal). Figure 7 gives a breakdown of primary energy use for various regions (OECD, Commonwealth of Independent States and Eastern Europe, Sub-Saharan Africa,Middle East and North Africa,Asia-Pacific,Latin America and the Caribbean). The regions show large differences in their primary energy mix, reflecting both the availability of primary energy sources and consumption patterns.9 Figure 8 shows electricity production for the ——————————————————————————————————————————————————————————————————— 8. As estimated by converting 10 Gtoe to barrels of oil at a value of US$30 per barrel. 9. According to the International Energy Agency (2003, p. I.9), "Combustible renewables and waste comprises solid biomass, liquid biomass, biogas, industrial wasteandmunicipalwaste.Biomassisdefinedasanyplantmatteruseddirectlyasfuelorconvertedintofuels(e.g.,charcoal)orelectricityand/orheat. Included here arewood, vegetal waste (including wood waste and crops used for energy production), ethanol, animal materials/wastes and sulphite lyes (...) also known as "black liquor (...). Municipal wastes comprises wastes producedby residential, commercial and public service sectors that are collected by local authorities for disposal in a central location for the production of heat and/or power.Hospital waste is included in this category".The Agency also FIGURE 7. PRIMARY ENERGY USE IN VARIOUS REGIONS, BY ENERGY SOURCE, 2001 Source: IEA, 2003c. OECD shares of 5.33 Gtoe Crude oil 40.4% Petroleum products 0.5% Coal 20.8% Combustible renewables and waste 3.3% Hydro 2.0% Geothermal, solar, etc. 0.7% Nuclear 11.2% Gas 21.3% CIS and Eastern Europe shares of 1.03 Gtoe Crude oil 24.4% Petroleum products 5.7% Combustible renewables and waste 1.4% Coal 17.7% Hydro 2.1% Geothermal, solar, etc. 0.0% Nuclear 5.8% Gas 42.9% Sub-Saharan Africa shares of 0.40 Gtoe Crude oil 11.8% Petroleum products 1.1% Combustible renewables and waste 61.5% Coal 20.9% Hydro 1.3% Geothermal, solar, etc. 0.1% Nuclear 0.7% Gas 2.5% Middle East and North Africa shares of 0.50 Gtoe Crude oil 51.0% Petroleum products 19.8% Coal 26.7% Combustible renewables and waste 0.5% Hydro 0.3% Geothermal, solar, etc. 0.1% Nuclear 0.0% Gas 26.7% Asia Pacific shares of 2.31 Gtoe Nuclear 0.8% Petroleum products 0.9% Combustible renewables and waste 1.4% Coal 39% Geothermal, solar, etc. 0.5% Hydro 1.7% Crude oil 24.5% Gas 7.3% Latin America and the Caribbean shares of 0.45 Gtoe Petroleum products 8.1% Crude oil 48.0% Combustible renewables and waste 14.7% Coal 3.8% Hydro 8.3% Geothermal, solar, etc. 0.4% Nuclear 1.0% Gas 15.8%
  • 6.
    same regions, againwith large variations. Fossil fuels use accounts for 83 percent of the energy consumed in industrialised countries, 89 percent in transition-economy countries, and appreciably less in some other regions. In contrast, traditional and modern biomass account for 16 percent of the energy consumed in the developing countries of the Latin America and Caribbean, for 25 percent in developing Asia, and almost 60 percent in Sub-Saharan Africa. Yet it represents only 3 percent of primary energy used in industrialised countries, and is negligible in the transition economy countries of Eastern Europe and the former Soviet Union. Nuclear energy is also significant in industrialised countries (where it is the source of 11 percent of primary energy) and transition economy countries (7 percent); however, it makes only a minor contribution in developing countries (0.4 percent, or even less). Hydropower is unevenly used, providing 72 percent of electricity in Latin America and the Caribbean, and 9 percent in Middle East and North Africa, regions with scarce resources. Non-hydro renewable energy in electricity production is low in all regions. World-wide, traditional energy accounts for nearly 10 percent of total primary energy used (Figure 5). However, the distribution is uneven: traditional energy accounts for less than 3.4 percent of energy use in industrialised countries but an average of 17.9 percent in developing countries In some low-income developing Part II. Basic Energy Facts W O R L D E N E R G Y A S S E S S M E N T O V E R V I E W : 2 0 0 4 U P D A T E30 ——————————————————————————————————————————————————————————————————— recognises that "Data under this heading are often based on small sample surveys or other incomplete information". The available statistics, do not separate unsustainable sources of biomass (e.g.,fuelwood from deforestation) from the sustainable (e.g.,biodiesel).Until more comprehensive data are published for all countries,it could be assumed that all Combustible Renewables and Waste (CRW) from developed countries are renewable; for developing countries, at least, the CRW applied into electricity production (thus a modern process) can also be considered renewable. FIGURE 8. SHARES OF ELECTRICITY PRODUCTION IN VARIOUS REGIONS, BY ENERGY SOURCE, 2001 Source: IEA, 2003c. OECD (9490 TWh) Coal 37.9% Combustible renewables and waste 1.6% Hydro 13.0%Geothermal, solar, etc. 0.7% Nuclear 24.1% Petroleum products 5.9% Gas 16.8% Middle East and North Africa (649 TWh) Combustible renewables and waste 0.0% Coal 6.9% Geothermal, solar, etc. 0.0% Nuclear 0.0% Petroleum products 38.9% Hydro 4.8% Gas 49.4% Sub-Saharan Africa (306 TWh) Coal 66.6% Hydro 13.0% Geothermal, solar, etc. 0.2% Nuclear 3.5% Petroleum products 4.9% Gas 4.3% CIS and Eastern Europe (1473 TWh) Coal 23.2% Hydro 19.4% Combustible renewables and waste 1.6% Combustible renewables and waste 0.0% Geothermal, solar, etc. 0.0% Nuclear 24.1% Petroleum products 4.6% Gas 35.2% Latin America and the Caribbean (763 TWh) Coal 3.0% Hydro 67.7% Combustible renewables and waste 1.9%Geothermal, solar, etc. 0.3% Nuclear 2.8% Petroleum products 11.3% Gas 12.9% Asia Pacific (2795 TWh) Coal 63.6% Hydro 16.1% Geothermal, solar, etc. 0.6% Nuclear 2.7% Petroleum products 6.6% Gas 10.2% Combustible renewables and waste 0.2%
  • 7.
    W O RL D E N E R G Y A S S E S S M E N T O V E R V I E W : 2 0 0 4 U P D A T E Part II. Basic Energy Facts 31 countries, traditional biomass accounts for 80 percent or more of total energy use. There are significant inequities in annual per capita energy use among groups of countries. In 2001, industrialised countries used 4.7 tonnes of oil equivalent (toe) per capita, in contrast to developing countries, which used only 0.8 toe per capita; the world average was 1.7 toe per capita. The per capita energy use in the sub-Saharan region was only 0.6 toe. The rate of growth in energy use also varies across country groups. Between 1990 and 2001, the average annual growth rate in primary energy use in industrialised countries was 1.5 percent; in developing countries, it was more than twice that amount (3.2 percent, with important variations among different regions of developing countries). Population growth and rising levels of economic activity drive this rapid increase (Table 2). From this overview, it is clear that the availability and use of energy around the world is extremely heterogeneous. The varying growth rates in energy use have helped to reduce the gap in energy services between industrialised and developing countries and are the result of energy efficiency measures in OECD countries, the export of energy-intensive activities to developing countries, and increased access to energy services throughout the world. Nevertheless, the situation remains far from equitable. s TABLE 2. PRIMARY ENERGY USE, BY REGION, 2001 TPES* (Gtoe) 5.33 1.03 0.40 0.50 2.31 0.45 10.03 3.66 Population (billions) 1.14 0.35 0.67 0.31 3.21 0.42 6.10 4.62 toe/capita 4.68 2.98 0.60 1.62 0.72 1.07 1.64 0.79 Growth rate 1990-2001 %/year 1.52% -3.26% 2.23% 4.65% 3.18% 2.64% 1.41% 3.19% Region 1. OECD (all industrialised countries) 2. Commonwealth of Independent States and Eastern Europe 3. Sub-Saharan Africa 4. Middle East and North Africa 5. Asia Pacific (non-OECD) with China 6. Latin America and the Caribbean (without Mexico) World Developing countries (3+4+5+6) * TPES (total primary energy supply) is the indigenous production of energy, plus imports and positive stock changes, minus exports and international marine bunkers. Source: IEA, 2003c.