Download as PDF, PPTX


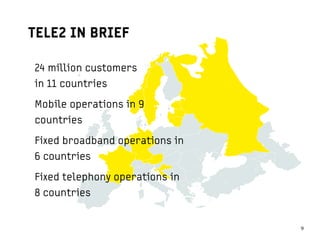
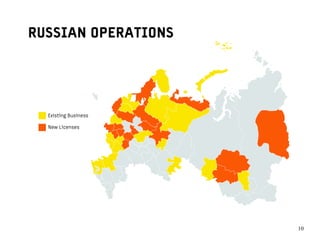
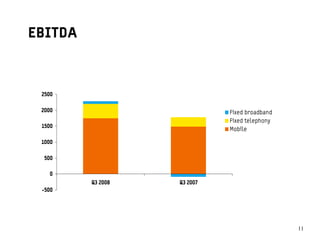
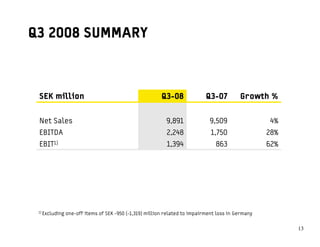
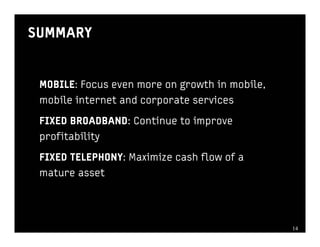

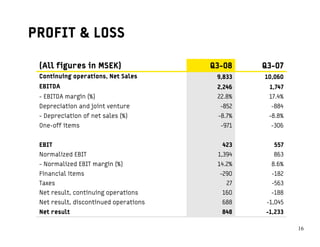
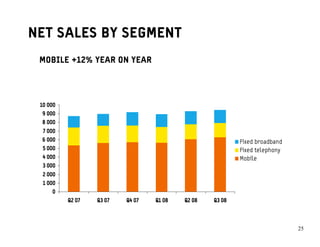
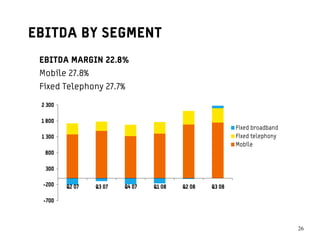
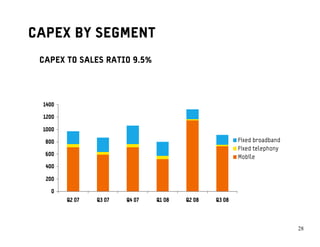


This document provides an overview of Tele2's financial performance in Q3 2008. Some key points: - Net sales increased 4% year-over-year to SEK 9.9 billion. EBITDA grew 28% to SEK 2.2 billion. - Mobile operations continue to be the main focus and driver of growth, with net sales up 12% and EBITDA margin of 27.8%. - Tele2 acquired 17 new licenses in Russia, which are expected to require SEK 1-1.4 billion in capital expenditures through 2009 as the new regions are launched. - To maintain a strong financial position in uncertain markets, Tele2 will not utilize its current share


