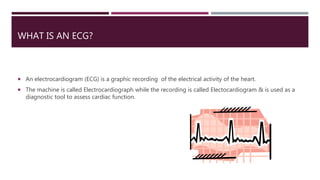
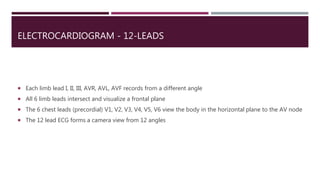
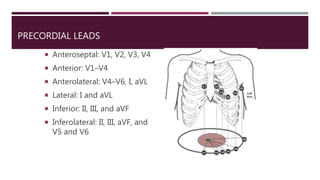
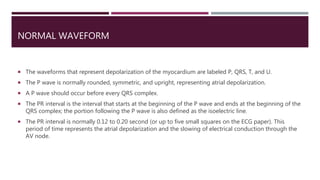
The document provides an in-depth overview of electrocardiography (ECG), detailing the anatomy of coronary circulation, electrical conduction pathways of the heart, and the operation of ECG machines and paper. It describes the structure and placement of 12-lead ECGs, normal waveforms (P, QRS, T, U), and methods for analyzing heart rhythm and rate. Additionally, various types of arrhythmias, including sinus bradycardia, tachycardia, and arrhythmia, are examined along with their characteristics and clinical implications.
![ECG PAPER
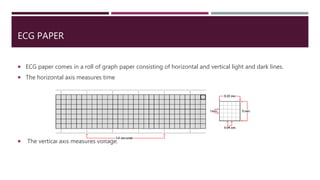
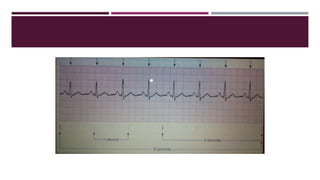
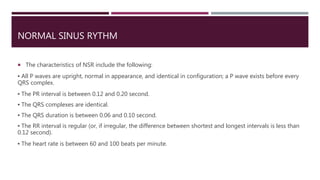
One small square = 0.04 seconds
One large square = 0.2 seconds Or [One small square(0.04)] x 5](https://image.slidesharecdn.com/electrocardiography-220201060730/85/Electrocardiography-19-320.jpg)
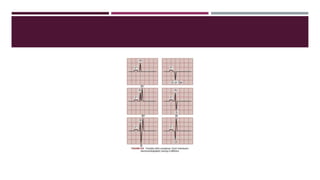
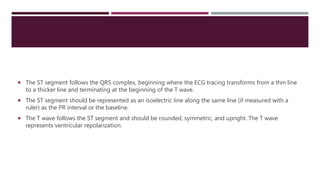
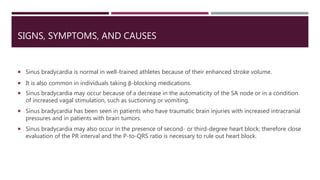


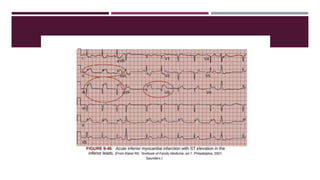
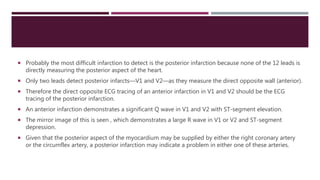
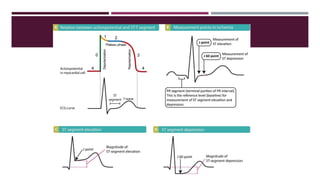
![ The ECG may demonstrate ST-segment depression while the patient is at rest in the presence of chest
pain or of suspected coronary ischemia.
The ST-segment depression in this situation represents subendocardial infarction and also requires
immediate treatment.
A subendocardial infarct (also called a nontransmural, non–Q-wave infarct, or non–ST-segment elevation
myocardial infarction [STEMI] infarct) is an acute injury to the myocardial wall, but it does not extend
through the full thickness of the ventricular wall. Instead, the injury is only to the subendocardium.](https://image.slidesharecdn.com/electrocardiography-220201060730/85/Electrocardiography-142-320.jpg)