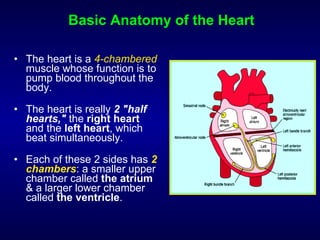
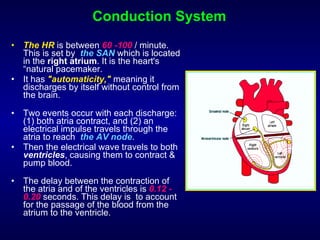
Essentials of ECG Prof. Dr.  Ibrahim Mohammad Mukhtar Professor of  Internal Medicine Ain-Shams University Consultant of internal Medicine KKGH
What is t he electrocardiogram   The electrocardiogram  (ECG or EKG) is a diagnostic tool that measures and records the electrical activity of the heart. Interpretation of these details allows diagnosis of a wide range of heart  diseases which can vary from minor to life threatening. To fully understand how an ECG reveals useful information about the condition of the heart a basic understanding of the  anatomy  (that is, the structure) and  physiology  (that is, the function) of the heart is important.
Basic Anatomy of the Heart The heart is a  4-chambered  muscle whose function is to pump blood throughout the body.  The heart is really  2 "half hearts,"  the  right heart  and the  left heart , which beat simultaneously.  Each of these 2 sides has  2 chambers : a smaller upper chamber called  the atrium  & a larger lower chamber called  the ventricle .
Basic Anatomy of the Heart The heart's function is so important to the body that it has its  own electrical system  to keep it running  independently  of the rest of the body's nervous system. Even in cases of  severe brain damage , the heart often beats normally.  The ECG records this electrical activity and depicts it as a series of graph-like tracings, or waves. The shapes and frequencies of these tracings reveal abnormalities in the heart's  anatomy  or  function .
Reasons to Have an ECG Heart problems can produce a wide array of symptoms.  Without the benefit of an ECG, it may be impossible to tell whether these symptoms are being caused by a heart problem or just mimicking one.  Common symptoms that frequently require an ECG include : 1- Chest pain or discomfort  2- Epigastric pain  3- Shortness of breath  4- Weakness    5- syncope  6- Palpitations
Conduction System The HR  is between  60 -100  / minute. This is set by  the SAN  which is located in the  right atrium . It is the heart's “natural pacemaker.  It has  "automaticity,"  meaning it discharges by itself without control from the brain.  Two events occur with each discharge: (1) both atria contract, and (2) an electrical impulse travels through the atria to reach  the AV node .  Then the electrical wave travels to both  ventricles , causing them to contract & pump blood.  The delay between the contraction of the atria and of the ventricles is  0.12 - 0.20  seconds. This delay is  to account for the passage of the blood from the atrium to the ventricle.
How ECG is done? Few procedures in medicine are easier than an ECG.  6 small adhesive electrode  pads  across chest wall. Other pads will be placed on each of the arms and legs. Insulated wires will connect each of these  10   pads to the ECG machine.  Once these leads are attached, the ECG records on a single sheet of graph paper.
How ECG is recorded? Each heartbeat produces a set of  P-QRS-T  waves. Six of these points of view are the locations of the 6 pads placed across the chest. These are called  V1, V2, V3, V4, V5, and V6 .  The other points of view represent combinations of the pads placed on the arms and legs. These are called  I, II, III , aVR, aVL, and aVF.
ECG paper Vertical axis   represents the amplitude  10mm = 1 mV Horizontal axis   represents time  1mm = 0.04 sec . –  5 mm = 0.2 sec. speed of ECG paper   is  25  mm / sec .
Why different shapes for the same beat?
Heart Rate & Rhythm HR:   No. of big squares /  300   or    No. of small squares /  1500 Rhythm:   reflected by  the equality  in the  distances  between the complexes .
ECG Waves P-Wave Atrial contractions  show up as the  P   wave.  Characteristics of the P wave Positive  in leads I & II Best seen in leads II &  V1 Commonly  biphasic  in lead V1 < 3  small squares in  duration < 2.5  small squares in  amplitude
  P-R interval   P-R interval:   The distance between beginning of P to the beginning of  R =  0.12 – 0.20 *
QRS Complex Ventricular contractions show as a series of 3 waves,  Q-R-S , known as the  QRS complex .  Non­pathological Q waves  are  < two small squares deep  and  < one small square wide , and should be  < 25% of the amplitude of the corresponding R wave.
R-Wave The height  of the R wave is variable and increases progressively across the precordial leads; it is usually < 27 mm in leads V5 and V6.  The R wave in lead V6, however, is often smaller than the R wave in V5, since the V6 electrode is further from the left ventricle.
S-Wave The S wave  is deepest in the right precordial leads; it decreases in amplitude across the precordium, and is often absent in leads V5 and V6.  The depth of the S wave should not exceed  30  mm in a normal individual, although S waves and R waves > 30 mm are occasionally recorded in  normal young male adults .
S-T segment S-T segment:   The ST segment lies between the J point and the beginning of the T wave, and represents the period between the end of ventricular depolarisation and the beginning of repolarisation.  In leads  V1 to V3  the rapidly ascending S wave merges directly with the T wave,  “high take­off.”  S-T segment:   should be isoelectric.
T-Wave Ventricular  repolarisation  produces the T wave. The normal T wave is  asymmetrical , the first half having a more gradual slope than the second half. T wave  orientation  usually corresponds with that of the QRS complex. The presence of  symmetrical, inverted T waves  is highly suggestive of  myocardial ischemia , though  asymmetrical  inverted T waves are frequently a  non­specific  finding.
Q-T interval Q-T interval:   between the start of Q to the end of T. The heart is not responding to any electric activity. =  0.35 – 0.44. It represents  the total time  taken for depolarisation and repolarisation of the ventricles. The QT interval lengthens as the heart rate slows. The QT interval increases slightly with age and tends to be longer in women than in men.
U wave The U wave  is a small deflection that follows the T wave. It is generally upright & often most prominent in leads  V2 to V4 .  U waves result from repolarisation of the mid­myocardium. Prominent U waves  may be found in athletes and are associated with  hypokalaemia  &  hypercalcaemia .
Abnormal ECG’s Hypertrophy of the ventricles:   Increase in the amplitude of R- wave in V5-6 = Lt.VH – V1-2 =Rt.VH
Arrhythmias 1-  Inequality in the distances   between Complexes. 2-  Bizarre shaped   complexes in case of ventricular arrhythmias.
Myocardial Ischemia 1- S-T depression 2- T-wave inversion
Myocardial infarction 1- peaked  T- wave 2- Elevation of  S-T segment 3-  Q-wave
Thank you

Essentials Of Ecg

  • 1.
    Essentials of ECGProf. Dr. Ibrahim Mohammad Mukhtar Professor of Internal Medicine Ain-Shams University Consultant of internal Medicine KKGH
  • 2.
    What is the electrocardiogram The electrocardiogram (ECG or EKG) is a diagnostic tool that measures and records the electrical activity of the heart. Interpretation of these details allows diagnosis of a wide range of heart diseases which can vary from minor to life threatening. To fully understand how an ECG reveals useful information about the condition of the heart a basic understanding of the anatomy (that is, the structure) and physiology (that is, the function) of the heart is important.
  • 3.
    Basic Anatomy ofthe Heart The heart is a 4-chambered muscle whose function is to pump blood throughout the body. The heart is really 2 &quot;half hearts,&quot; the right heart and the left heart , which beat simultaneously. Each of these 2 sides has 2 chambers : a smaller upper chamber called the atrium & a larger lower chamber called the ventricle .
  • 4.
    Basic Anatomy ofthe Heart The heart's function is so important to the body that it has its own electrical system to keep it running independently of the rest of the body's nervous system. Even in cases of severe brain damage , the heart often beats normally. The ECG records this electrical activity and depicts it as a series of graph-like tracings, or waves. The shapes and frequencies of these tracings reveal abnormalities in the heart's anatomy or function .
  • 5.
    Reasons to Havean ECG Heart problems can produce a wide array of symptoms. Without the benefit of an ECG, it may be impossible to tell whether these symptoms are being caused by a heart problem or just mimicking one. Common symptoms that frequently require an ECG include : 1- Chest pain or discomfort 2- Epigastric pain 3- Shortness of breath 4- Weakness 5- syncope 6- Palpitations
  • 6.
    Conduction System TheHR is between 60 -100 / minute. This is set by the SAN which is located in the right atrium . It is the heart's “natural pacemaker. It has &quot;automaticity,&quot; meaning it discharges by itself without control from the brain. Two events occur with each discharge: (1) both atria contract, and (2) an electrical impulse travels through the atria to reach the AV node . Then the electrical wave travels to both ventricles , causing them to contract & pump blood. The delay between the contraction of the atria and of the ventricles is 0.12 - 0.20 seconds. This delay is to account for the passage of the blood from the atrium to the ventricle.
  • 7.
    How ECG isdone? Few procedures in medicine are easier than an ECG. 6 small adhesive electrode pads across chest wall. Other pads will be placed on each of the arms and legs. Insulated wires will connect each of these 10 pads to the ECG machine. Once these leads are attached, the ECG records on a single sheet of graph paper.
  • 8.
    How ECG isrecorded? Each heartbeat produces a set of P-QRS-T waves. Six of these points of view are the locations of the 6 pads placed across the chest. These are called V1, V2, V3, V4, V5, and V6 . The other points of view represent combinations of the pads placed on the arms and legs. These are called I, II, III , aVR, aVL, and aVF.
  • 9.
    ECG paper Verticalaxis represents the amplitude 10mm = 1 mV Horizontal axis represents time 1mm = 0.04 sec . – 5 mm = 0.2 sec. speed of ECG paper is 25 mm / sec .
  • 10.
    Why different shapesfor the same beat?
  • 11.
    Heart Rate &Rhythm HR: No. of big squares / 300 or No. of small squares / 1500 Rhythm: reflected by the equality in the distances between the complexes .
  • 12.
    ECG Waves P-WaveAtrial contractions show up as the P wave. Characteristics of the P wave Positive in leads I & II Best seen in leads II & V1 Commonly biphasic in lead V1 < 3 small squares in duration < 2.5 small squares in amplitude
  • 13.
    P-Rinterval P-R interval: The distance between beginning of P to the beginning of R = 0.12 – 0.20 *
  • 14.
    QRS Complex Ventricularcontractions show as a series of 3 waves, Q-R-S , known as the QRS complex . Non­pathological Q waves are < two small squares deep and < one small square wide , and should be < 25% of the amplitude of the corresponding R wave.
  • 15.
    R-Wave The height of the R wave is variable and increases progressively across the precordial leads; it is usually < 27 mm in leads V5 and V6. The R wave in lead V6, however, is often smaller than the R wave in V5, since the V6 electrode is further from the left ventricle.
  • 16.
    S-Wave The Swave is deepest in the right precordial leads; it decreases in amplitude across the precordium, and is often absent in leads V5 and V6. The depth of the S wave should not exceed 30 mm in a normal individual, although S waves and R waves > 30 mm are occasionally recorded in normal young male adults .
  • 17.
    S-T segment S-Tsegment: The ST segment lies between the J point and the beginning of the T wave, and represents the period between the end of ventricular depolarisation and the beginning of repolarisation. In leads V1 to V3 the rapidly ascending S wave merges directly with the T wave, “high take­off.” S-T segment: should be isoelectric.
  • 18.
    T-Wave Ventricular repolarisation produces the T wave. The normal T wave is asymmetrical , the first half having a more gradual slope than the second half. T wave orientation usually corresponds with that of the QRS complex. The presence of symmetrical, inverted T waves is highly suggestive of myocardial ischemia , though asymmetrical inverted T waves are frequently a non­specific finding.
  • 19.
    Q-T interval Q-Tinterval: between the start of Q to the end of T. The heart is not responding to any electric activity. = 0.35 – 0.44. It represents the total time taken for depolarisation and repolarisation of the ventricles. The QT interval lengthens as the heart rate slows. The QT interval increases slightly with age and tends to be longer in women than in men.
  • 20.
    U wave TheU wave is a small deflection that follows the T wave. It is generally upright & often most prominent in leads V2 to V4 . U waves result from repolarisation of the mid­myocardium. Prominent U waves may be found in athletes and are associated with hypokalaemia & hypercalcaemia .
  • 21.
    Abnormal ECG’s Hypertrophyof the ventricles: Increase in the amplitude of R- wave in V5-6 = Lt.VH – V1-2 =Rt.VH
  • 22.
    Arrhythmias 1- Inequality in the distances between Complexes. 2- Bizarre shaped complexes in case of ventricular arrhythmias.
  • 23.
    Myocardial Ischemia 1-S-T depression 2- T-wave inversion
  • 24.
    Myocardial infarction 1-peaked T- wave 2- Elevation of S-T segment 3- Q-wave
  • 25.