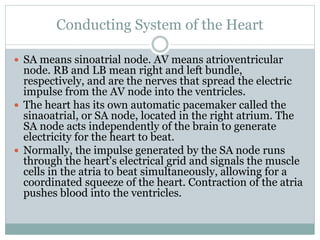
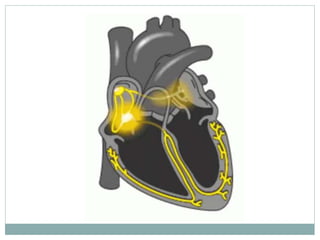
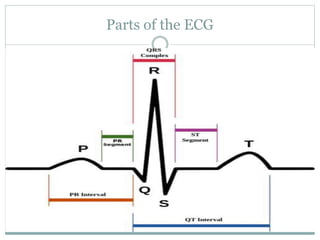
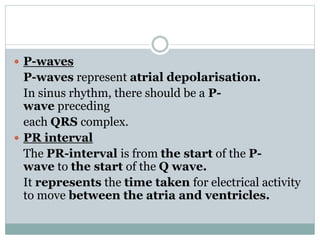
T U Y O R , M I Q U E L L E
V A L D E Z , J O S E P H I N E
N U R S I N G I N F O R M A T I C S L A B O R A T O R Y
Electrocardiogram (ECG or
EKG)
Electrocardiogram (ECG or EKG)
 is a diagnostic tool that is routinely used to assess the
electrical and muscular functions of the heart from
different angles to identify and locate pathology.
 The ECG test is painless and harmless. (The ECG
machine records electrical impulses coming from
your body - it does not put any electricity into your
body
Brief History
 Willem Einthoven (a Dutch physiologist; 1860-1927)
made the first ECG recording in 1895.
- P, Q, R, S, T waves are also first defined by Willem
Einthoven in 1895.
 In 1905, Willem Einthoven recorded ECGs in his
laboratory which was located 1.5 km away from the
hospital.
- The patient was in the hospital while his ECG was
being recorded in the laboratory 1.5 km away.
 Willem Einthoven first published his normal and
abnormal ECG recordings in 1906
Old string galvanometer electrocardiograph showing the big machine with the
patient rinsing his extremities in the cylindrical electrodes filled with electrolyte
solution.
 In 1924, Willem Einthoven received Nobel prize for
his invention of the ECG.
 Goldhammer ve Scherf were the first to suggest the
use of exercise ECG for the diagnosis of coronary
artery disease in 1932.
 Charles Wolferth ve Francis Wood were the first to
report the use of precordial electrodes in 1932.
 In 1942, Emanuel Goldberger adds the augmented
limb leads aVR, aVL and aVF to Einthoven's three
limb leads and the six chest leads making the 12-lead
electrocardiogram that is used today.
Basic Anatomy of the Heart
 The heart has four chambers – the right and left
atrium and the right and left ventricle.
 The right side of the heart collects blood from the body
and pumps it to the lungs while the left side of the heart
receives blood from the lungs and pumps it to the body.
Blood flows through the body in the following way:
 Oxygen-rich blood from the lungs enters the left atrium
through the pulmonary veins.
 Blood then flows into the left ventricle where it is
pumped into the aorta and is distributed to the rest of the
body. This blood supplies organs and cells with oxygen
and nutrients necessary for metabolism.
 Blood that returns to the heart is depleted of oxygen
and carries carbon dioxide, the waste product
of metabolism. The blood enters the right
atrium though the vena cava, where it is collected
and pumped to the right ventricle.
 The right ventricle then pumps blood through the
pulmonary artery to the lungs where carbon dioxide
is stripped off, oxygen is replaced, and the cycle
begins again.
Conducting System of the Heart
 SA means sinoatrial node. AV means atrioventricular
node. RB and LB mean right and left bundle,
respectively, and are the nerves that spread the electric
impulse from the AV node into the ventricles.
 The heart has its own automatic pacemaker called the
sinaoatrial, or SA node, located in the right atrium. The
SA node acts independently of the brain to generate
electricity for the heart to beat.
 Normally, the impulse generated by the SA node runs
through the heart's electrical grid and signals the muscle
cells in the atria to beat simultaneously, allowing for a
coordinated squeeze of the heart. Contraction of the atria
pushes blood into the ventricles.
 The electrical signal that was generated in the SA node
travels to a junction box between the atria and ventricles
(the AV node) where it is delayed for a few milliseconds
to allow the ventricles to fill.
 The electrical signal then travels through the ventricles,
stimulating those heart muscle cells to contract.
Ventricular contraction pumps blood to the body (from
the left ventricle) and the lungs (from the right ventricle).
 There is a short pause to allow blood to return to the
heart and fill before the electrical cycle repeats itself for
the next heartbeat.
Parts of the ECG
 P-waves
P-waves represent atrial depolarisation.
In sinus rhythm, there should be a P-
wave preceding
each QRS complex.
 PR interval
The PR-interval is from the start of the P-
wave to the start of the Q wave.
It represents the time taken for electrical activity
to move between the atria and ventricles.
 QRS complex
The QRS-complex represents depolarisation of
the ventricles.
It is seen as three closely related waves on the
ECG (Q,R and S wave).
 ST segment
The ST-segment starts at the end of the S-
wave and finishes at the start of the T-wave.
The ST segment is an isoelectric line that
represents the time between depolarization and
repolarization of the ventricles (i.e. contraction).
 T-wave
The T-wave represents ventricular repolarisation.
It is seen as a small wave after the QRS complex.
 RR-interval
The RR-interval starts at the peak of one R
wave and ends at the peak of the next R wave.
It represents the time between two QRS
complexes.
 QT-interval
The QT-interval starts at the beginning of the QRS
complex and finishes at the end of the T-wave.
It represents the time taken for
the ventricles to depolarise and then repolarise.
The 12 lead ECG
 Lead refers to an imaginary line between
two ECG electrodes.
 The electrical activity of this lead is measured
and recorded as part of the ECG.
 A 12-lead ECG records 12 of these “leads”
producing 12 separate graphs on the ECG paper.
 However , 10 physical electrodes can be attach to
the patient.
Electrodes
 The electrodes are wires that you attach to
the patient to record the ECG.
 These electrodes allow leads to be calculated.
Chest Electrodes Positions
 V1 – 4th intercostal space – right sternal edge
 V2 – 4th intercostal space – left sternal edge
 V3 – midway between V2 and V4
 V4 – 5th intercostal space – midclavicular line
 V5 – left anterior axillary line – same
horizontal level as V4
 V6 – left mid-axillary line – same horizontal
level as V4 & V5
Chest leads
 V1 – Septal view of heart
 V2 – Septal view of heart
 V3 – Anterior view of heart
 V4 – Anterior view of heart
 V5 – Lateral view of heart
 V6 – Lateral view of heart
Chest electrode positions
Limb Electrodes
 LA – left arm
 RA – right arm
 LL – left leg
 RL – right leg – neutral – not used in
measurements
How to read ECG paper
 The paper which ECGs are recorded upon
is standardised across all hospitals (usually):
 Each small square represents 0.04 seconds
 Each large square on the paper represents 0.2
seconds
 5 large squares therefore = 1 second
 300 large squares = 1 minute
The shape of the ECG waveform
 Each individual leads ECG recording is slightly
different in shape.
 This is due to each lead recording the electrical
activity from different directions.
 When the electrical activity of the heart
travels towards a lead you get a positive
deflection.
 When the electrical activity travels away from a
lead you get a negative deflection.
 Electrical activity in the heart flows in many
directions at once.
 The wave seen on the ECG paper represents
the average direction.
 The height of the deflection also represents
the amount of electricity flowing in
that direction.
 The lead with the most positive deflection is
closest to the direction the
heart’s electricity is flowing.
 If the R-wave is greater than the S-wave it
suggests depolarisation is moving towards that
lead.
 If the S-wave is greater than the R-
waves it suggests depolarisation is
moving away from that lead.
 If the R and S-waves are of equal size it means
depolarisation is travelling at exactly 90° to that
lead.
Cardiac axis
 The electrical activity of the heart starts at
the sinoatrial node then spreads to
the atrioventricular (AV) node.
 It then spreads down the bundle of His and
then Purkinje fibres to cause ventricular
contraction.
 Whenever the direction of electrical activity is towards
a lead you get a positive deflection in that lead.
 Whenever the direction of electrical activity is away
from a lead you get a negative deflection in that
lead.
 The cardiac axis gives us an idea of the overall
direction of electrical activity when the ventricles
are contracting.
Electrocardiogram

Electrocardiogram

  • 1.
    T U YO R , M I Q U E L L E V A L D E Z , J O S E P H I N E N U R S I N G I N F O R M A T I C S L A B O R A T O R Y Electrocardiogram (ECG or EKG)
  • 3.
    Electrocardiogram (ECG orEKG)  is a diagnostic tool that is routinely used to assess the electrical and muscular functions of the heart from different angles to identify and locate pathology.  The ECG test is painless and harmless. (The ECG machine records electrical impulses coming from your body - it does not put any electricity into your body
  • 5.
    Brief History  WillemEinthoven (a Dutch physiologist; 1860-1927) made the first ECG recording in 1895. - P, Q, R, S, T waves are also first defined by Willem Einthoven in 1895.  In 1905, Willem Einthoven recorded ECGs in his laboratory which was located 1.5 km away from the hospital. - The patient was in the hospital while his ECG was being recorded in the laboratory 1.5 km away.  Willem Einthoven first published his normal and abnormal ECG recordings in 1906
  • 6.
    Old string galvanometerelectrocardiograph showing the big machine with the patient rinsing his extremities in the cylindrical electrodes filled with electrolyte solution.
  • 7.
     In 1924,Willem Einthoven received Nobel prize for his invention of the ECG.  Goldhammer ve Scherf were the first to suggest the use of exercise ECG for the diagnosis of coronary artery disease in 1932.  Charles Wolferth ve Francis Wood were the first to report the use of precordial electrodes in 1932.  In 1942, Emanuel Goldberger adds the augmented limb leads aVR, aVL and aVF to Einthoven's three limb leads and the six chest leads making the 12-lead electrocardiogram that is used today.
  • 9.
    Basic Anatomy ofthe Heart  The heart has four chambers – the right and left atrium and the right and left ventricle.  The right side of the heart collects blood from the body and pumps it to the lungs while the left side of the heart receives blood from the lungs and pumps it to the body. Blood flows through the body in the following way:  Oxygen-rich blood from the lungs enters the left atrium through the pulmonary veins.  Blood then flows into the left ventricle where it is pumped into the aorta and is distributed to the rest of the body. This blood supplies organs and cells with oxygen and nutrients necessary for metabolism.
  • 10.
     Blood thatreturns to the heart is depleted of oxygen and carries carbon dioxide, the waste product of metabolism. The blood enters the right atrium though the vena cava, where it is collected and pumped to the right ventricle.  The right ventricle then pumps blood through the pulmonary artery to the lungs where carbon dioxide is stripped off, oxygen is replaced, and the cycle begins again.
  • 12.
    Conducting System ofthe Heart  SA means sinoatrial node. AV means atrioventricular node. RB and LB mean right and left bundle, respectively, and are the nerves that spread the electric impulse from the AV node into the ventricles.  The heart has its own automatic pacemaker called the sinaoatrial, or SA node, located in the right atrium. The SA node acts independently of the brain to generate electricity for the heart to beat.  Normally, the impulse generated by the SA node runs through the heart's electrical grid and signals the muscle cells in the atria to beat simultaneously, allowing for a coordinated squeeze of the heart. Contraction of the atria pushes blood into the ventricles.
  • 13.
     The electricalsignal that was generated in the SA node travels to a junction box between the atria and ventricles (the AV node) where it is delayed for a few milliseconds to allow the ventricles to fill.  The electrical signal then travels through the ventricles, stimulating those heart muscle cells to contract. Ventricular contraction pumps blood to the body (from the left ventricle) and the lungs (from the right ventricle).  There is a short pause to allow blood to return to the heart and fill before the electrical cycle repeats itself for the next heartbeat.
  • 15.
  • 16.
     P-waves P-waves representatrial depolarisation. In sinus rhythm, there should be a P- wave preceding each QRS complex.  PR interval The PR-interval is from the start of the P- wave to the start of the Q wave. It represents the time taken for electrical activity to move between the atria and ventricles.
  • 17.
     QRS complex TheQRS-complex represents depolarisation of the ventricles. It is seen as three closely related waves on the ECG (Q,R and S wave).  ST segment The ST-segment starts at the end of the S- wave and finishes at the start of the T-wave. The ST segment is an isoelectric line that represents the time between depolarization and repolarization of the ventricles (i.e. contraction).
  • 18.
     T-wave The T-waverepresents ventricular repolarisation. It is seen as a small wave after the QRS complex.  RR-interval The RR-interval starts at the peak of one R wave and ends at the peak of the next R wave. It represents the time between two QRS complexes.  QT-interval The QT-interval starts at the beginning of the QRS complex and finishes at the end of the T-wave. It represents the time taken for the ventricles to depolarise and then repolarise.
  • 19.
    The 12 leadECG  Lead refers to an imaginary line between two ECG electrodes.  The electrical activity of this lead is measured and recorded as part of the ECG.  A 12-lead ECG records 12 of these “leads” producing 12 separate graphs on the ECG paper.  However , 10 physical electrodes can be attach to the patient.
  • 20.
    Electrodes  The electrodesare wires that you attach to the patient to record the ECG.  These electrodes allow leads to be calculated.
  • 22.
    Chest Electrodes Positions V1 – 4th intercostal space – right sternal edge  V2 – 4th intercostal space – left sternal edge  V3 – midway between V2 and V4  V4 – 5th intercostal space – midclavicular line  V5 – left anterior axillary line – same horizontal level as V4  V6 – left mid-axillary line – same horizontal level as V4 & V5
  • 23.
    Chest leads  V1– Septal view of heart  V2 – Septal view of heart  V3 – Anterior view of heart  V4 – Anterior view of heart  V5 – Lateral view of heart  V6 – Lateral view of heart
  • 24.
  • 25.
    Limb Electrodes  LA– left arm  RA – right arm  LL – left leg  RL – right leg – neutral – not used in measurements
  • 27.
    How to readECG paper  The paper which ECGs are recorded upon is standardised across all hospitals (usually):  Each small square represents 0.04 seconds  Each large square on the paper represents 0.2 seconds  5 large squares therefore = 1 second  300 large squares = 1 minute
  • 29.
    The shape ofthe ECG waveform  Each individual leads ECG recording is slightly different in shape.  This is due to each lead recording the electrical activity from different directions.  When the electrical activity of the heart travels towards a lead you get a positive deflection.  When the electrical activity travels away from a lead you get a negative deflection.
  • 30.
     Electrical activityin the heart flows in many directions at once.  The wave seen on the ECG paper represents the average direction.  The height of the deflection also represents the amount of electricity flowing in that direction.  The lead with the most positive deflection is closest to the direction the heart’s electricity is flowing.
  • 31.
     If theR-wave is greater than the S-wave it suggests depolarisation is moving towards that lead.  If the S-wave is greater than the R- waves it suggests depolarisation is moving away from that lead.  If the R and S-waves are of equal size it means depolarisation is travelling at exactly 90° to that lead.
  • 33.
    Cardiac axis  Theelectrical activity of the heart starts at the sinoatrial node then spreads to the atrioventricular (AV) node.  It then spreads down the bundle of His and then Purkinje fibres to cause ventricular contraction.  Whenever the direction of electrical activity is towards a lead you get a positive deflection in that lead.  Whenever the direction of electrical activity is away from a lead you get a negative deflection in that lead.  The cardiac axis gives us an idea of the overall direction of electrical activity when the ventricles are contracting.