Download to read offline
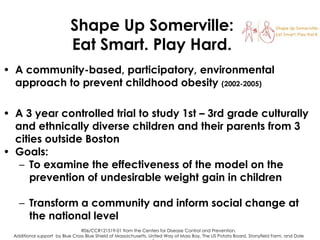
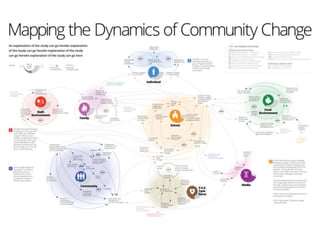


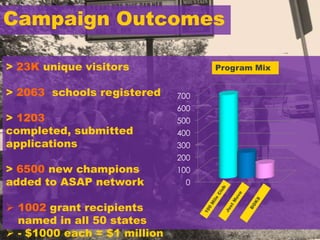
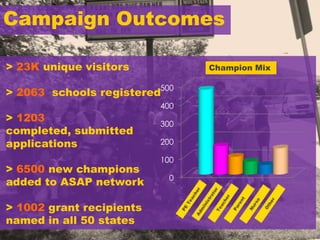


400 6500 new champions added to ASAP network 300 1002 grant recipients named in all 50 states 200 - $1000 each = $1 million 100 1. The document summarizes the Shape Up Somerville study, a community-based intervention to prevent childhood obesity through environmental and policy changes across schools, homes, and the community. 2. Key results showed decreases in BMI z-scores and unhealthy behaviors like screen time and sugary drinks in the intervention group compared to controls after 2 years. 3. A qualitative analysis using a systems perspective found that engaging leaders across sectors, using evidence, and blending


