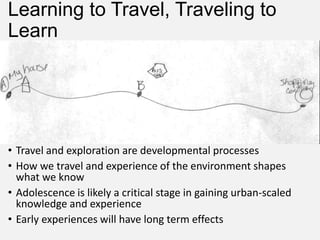
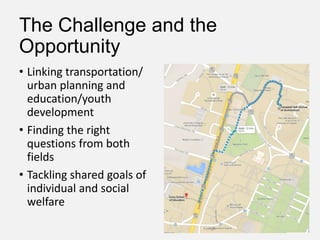
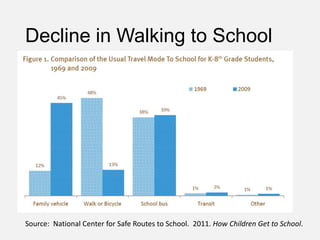
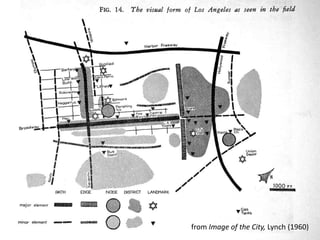
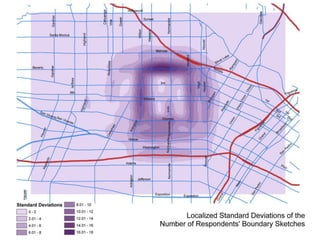
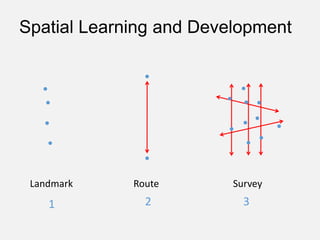
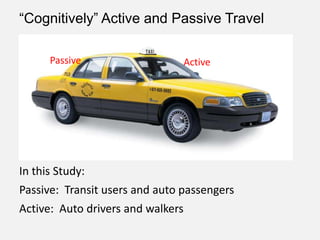
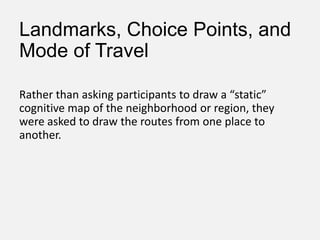
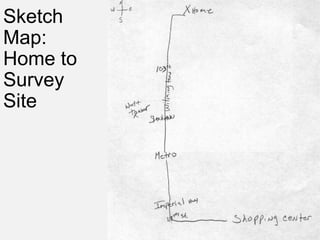
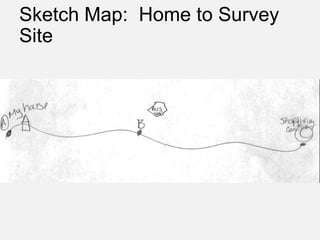
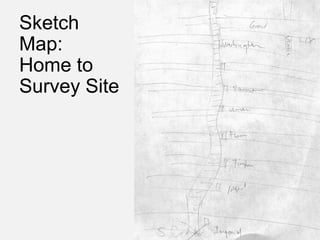
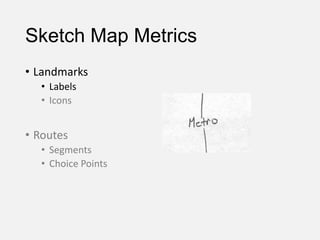
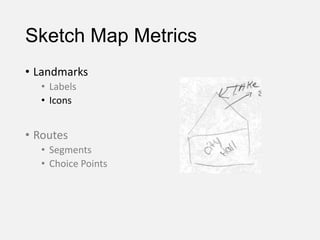
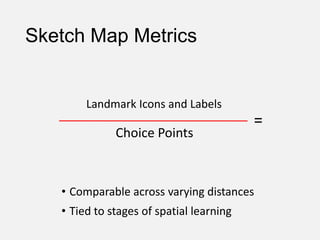
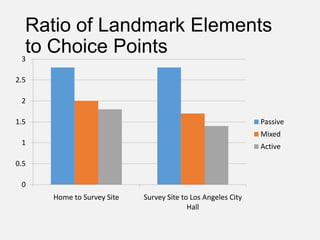
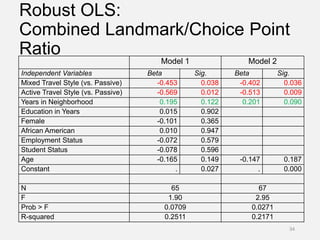
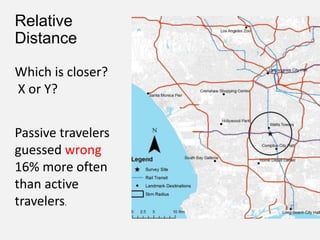
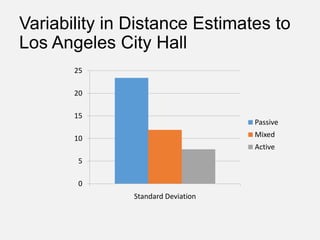
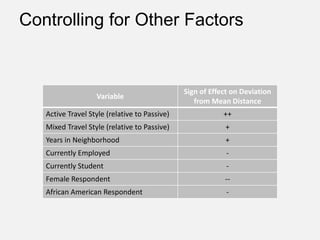
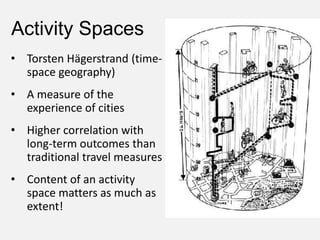
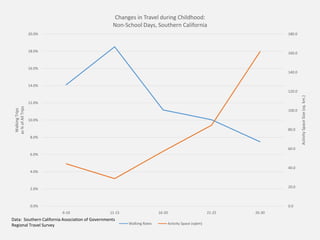
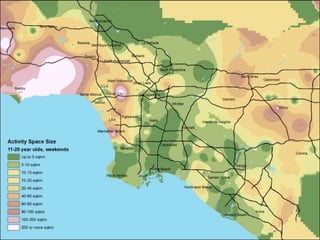
Learning the City
Early Experiences with Travel and the
Development of the Cognitive Map
Andrew Mondschein, Ph.D., AICP
Department of Urban and Environmental Planning
School of Architecture
University of Virginia
Image: Franky Levy
Learning to Travel, Traveling to
Learn
• Travel and exploration are developmental processes
• How we travel and experience of the environment shapes
what we know
• Adolescence is likely a critical stage in gaining urban-scaled
knowledge and experience
• Early experiences will have long term effects
The Challenge and the
Opportunity
• Linking transportation/
urban planning and
education/youth
development
• Finding the right
questions from both
fields
• Tackling shared goals of
individual and social
welfare
Transportation Planning
• Transportation planning and engineering has been
predicated for 100 years on increasing mobility.
Transportation Planning
• Redesigning the city to accommodate the
automobile has been fundamental.
Transportation Planning
• Travel behavior is viewed from a microeconomic
framework: minimizing costs, maximizing
immediate benefits.
Transportation Planning
• Long-term effects have only relatively recently been
incorporated into the framework:
oEnvironment and sustainability
oHealth
Recent Findings on Long-Term
Travel Behavior
• Habit
oRecent findings that “rational” choices skewed by
habitual behavior.
oWalking and biking become more reliable after
habituation.
Recent Findings on Long-Term
Travel Behavior
• Immigrant travel behavior
Youth Travel Behavior
Research
• Safe Routes to School
• Fostering independent mobility
oTo encourage walking and biking
oPotential effects on sense of community, safety, well-
being
• Emphasis on learning long-term sustainable travel
behaviors.
oTeen attitudes to cycling
oUnderstanding recent trends in youth mobility
Decline in Walking to School
Source: National Center for Safe Routes to School. 2011. How Children Get to School.
• Space as experienced by individuals
• Incomplete and error-prone, but error not random
• Within-group commonalities in cognitive maps
• Some youth research
“Cognitive mapping is a construct which encompasses those
cognitive processes which enable people to acquire, code, store,
recall, and manipulate information about the nature of their
spatial environment. This information… is an essential
component in the adaptive process of spatial decision making.”
(Downs and Stea, 1974)
Cognitive Mapping
from Image of the City, Lynch (1960)
Cognitive Mapping and Travel
• Travel experiences are the primary source of spatial
knowledge.
• Path-based conceptualization (Golledge and Stimson).
• Wayfinding – search, exploration, and path selection –
facilitates spatial learning.
• “Choice points” are locations where travel decisions are
made.
• Individuals retain greater knowledge of opportunities located
at choice points.
Spatial Learning and Development
SurveyRoute
1 32
Landmark
In this Study:
Passive: Transit users and auto passengers
Active: Auto drivers and walkers
“Cognitively” Active and Passive Travel
ActivePassive
• Survey of 196 adults in South Los Angeles
• In-person surveys in English and Spanish
• $10 Starbucks card incentive (Starbucks at shopping
center)
• 15 verbal questions and 2 sketch maps
• Multiple and varied measures to capture information on:
Travel mode
Spatial knowledge / cognitive mapping
Socio-economic status, spatial location
Methods and Design
Landmarks, Choice Points, and
Mode of Travel
Rather than asking participants to draw a “static”
cognitive map of the neighborhood or region, they
were asked to draw the routes from one place to
another.
Sketch
Map:
Home to
Survey
Site
Sketch Map: Home to Survey
Site
Sketch
Map:
Home to
Survey Site
“Sketch” Map
?
Mapping Methodology
How to analyze such diverse sketch maps?
Mapping Methodology
How to analyze such diverse sketch maps?
Break them in to their component parts.
Sketch Map Metrics
• Landmarks
• Labels
• Icons
• Routes
• Segments
• Choice Points
Sketch Map Metrics
• Landmarks
• Labels
• Icons
• Routes
• Segments
• Choice Points
Sketch Map Metrics
• Landmarks
• Labels
• Icons
• Routes
• Segments
• Choice Points
Sketch Map Metrics
• Landmarks
• Labels
• Icons
• Routes
• Segments
• Choice Points
Sketch Map Metrics
Landmark Icons and Labels
Choice Points
=
• Comparable across varying distances
• Tied to stages of spatial learning
Ratio of Landmark Elements
to Choice Points
0
0.5
1
1.5
2
2.5
3
Home to Survey Site Survey Site to Los Angeles City
Hall
Passive
Mixed
Active
Robust OLS:
Combined Landmark/Choice Point
Ratio
34
Model 1 Model 2
Independent Variables Beta Sig. Beta Sig.
Mixed Travel Style (vs. Passive) -0.453 0.038 -0.402 0.036
Active Travel Style (vs. Passive) -0.569 0.012 -0.513 0.009
Years in Neighborhood 0.195 0.122 0.201 0.090
Education in Years 0.015 0.902
Female -0.101 0.365
African American 0.010 0.947
Employment Status -0.072 0.579
Student Status -0.078 0.596
Age -0.165 0.149 -0.147 0.187
Constant . 0.027 . 0.000
N 65 67
F 1.90 2.95
Prob > F 0.0709 0.0271
R-squared 0.2511 0.2171
Describing: Home
Passive/Active
Street 0.96
Cross Street 0.98
Landmark 2.51
Describing: Work
Passive/Active
Street 0.79
Cross Street 0.77
Landmark 1.01
Relative
Distance
Which is closer?
X or Y?
Passive travelers
guessed wrong
16% more often
than active
travelers.
Variability in Distance Estimates to
Los Angeles City Hall
0
5
10
15
20
25
Standard Deviation
Passive
Mixed
Active
Controlling for Other Factors
Accuracy of the Distance Estimate Increases with:
Variable
Sign of Effect on Deviation
from Mean Distance
Active Travel Style (relative to Passive) ++
Mixed Travel Style (relative to Passive) +
Years in Neighborhood +
Currently Employed -
Currently Student -
Female Respondent --
African American Respondent -
Activity Spaces
• Torsten Hägerstrand (time-
space geography)
• A measure of the
experience of cities
• Higher correlation with
long-term outcomes than
traditional travel measures
• Content of an activity
space matters as much as
extent!
0.0
20.0
40.0
60.0
80.0
100.0
120.0
140.0
160.0
180.0
0.0%
2.0%
4.0%
6.0%
8.0%
10.0%
12.0%
14.0%
16.0%
18.0%
20.0%
6-10 11-15 16-20 21-25 26-30
ActivitySpaceSize(sq.km.)
WalkingTrips
as%ofAllTrips
Changes in Travel during Childhood:
Non-School Days, Southern California
Walking Rates Activity Space (sqkm)
Data: Southern California Association of Governments
Regional Travel Survey
Findings and Implications
• How we understand cities changes over the
lifespan, including knowledge of opportunities.
• Reliance on landmarks is particularly important for
young adults.
• Active (independent?) travel engages spatial
learning.
• Urban “legibility” is different depending on travel
mode.
• Planners need to treat travel as an integral part of
the broader urban experience, including for youth.
Future Directions
• Transportation planning and youth development:
oPromoting more sustainable travel behavior through
urban legibility
oRole of information technologies in youth travel
oMeasuring the affective dimensions of the cognitive
map – safety, security, attachment, engagement
oMeasuring youth activity spaces
Future Directions
• Learning and travel:
oHow is spatial learning tied to
overall development?
oLearning outside school?
oHow can planners foster
independent mobility?
oWhat are the effects of
different built environments?
o Old suburban
o New Urbanist
o Transit-oriented development
oLinkages to social and
psychological health
Thank You!

Learning the city powerpointfrom am v3

  • 1.
    Learning the City EarlyExperiences with Travel and the Development of the Cognitive Map Andrew Mondschein, Ph.D., AICP Department of Urban and Environmental Planning School of Architecture University of Virginia Image: Franky Levy
  • 2.
    Learning to Travel,Traveling to Learn • Travel and exploration are developmental processes • How we travel and experience of the environment shapes what we know • Adolescence is likely a critical stage in gaining urban-scaled knowledge and experience • Early experiences will have long term effects
  • 3.
    The Challenge andthe Opportunity • Linking transportation/ urban planning and education/youth development • Finding the right questions from both fields • Tackling shared goals of individual and social welfare
  • 4.
    Transportation Planning • Transportationplanning and engineering has been predicated for 100 years on increasing mobility.
  • 5.
    Transportation Planning • Redesigningthe city to accommodate the automobile has been fundamental.
  • 6.
    Transportation Planning • Travelbehavior is viewed from a microeconomic framework: minimizing costs, maximizing immediate benefits.
  • 7.
    Transportation Planning • Long-termeffects have only relatively recently been incorporated into the framework: oEnvironment and sustainability oHealth
  • 8.
    Recent Findings onLong-Term Travel Behavior • Habit oRecent findings that “rational” choices skewed by habitual behavior. oWalking and biking become more reliable after habituation.
  • 9.
    Recent Findings onLong-Term Travel Behavior • Immigrant travel behavior
  • 10.
    Youth Travel Behavior Research •Safe Routes to School • Fostering independent mobility oTo encourage walking and biking oPotential effects on sense of community, safety, well- being • Emphasis on learning long-term sustainable travel behaviors. oTeen attitudes to cycling oUnderstanding recent trends in youth mobility
  • 11.
    Decline in Walkingto School Source: National Center for Safe Routes to School. 2011. How Children Get to School.
  • 12.
    • Space asexperienced by individuals • Incomplete and error-prone, but error not random • Within-group commonalities in cognitive maps • Some youth research “Cognitive mapping is a construct which encompasses those cognitive processes which enable people to acquire, code, store, recall, and manipulate information about the nature of their spatial environment. This information… is an essential component in the adaptive process of spatial decision making.” (Downs and Stea, 1974) Cognitive Mapping
  • 13.
    from Image ofthe City, Lynch (1960)
  • 15.
    Cognitive Mapping andTravel • Travel experiences are the primary source of spatial knowledge. • Path-based conceptualization (Golledge and Stimson). • Wayfinding – search, exploration, and path selection – facilitates spatial learning. • “Choice points” are locations where travel decisions are made. • Individuals retain greater knowledge of opportunities located at choice points.
  • 16.
    Spatial Learning andDevelopment SurveyRoute 1 32 Landmark
  • 17.
    In this Study: Passive:Transit users and auto passengers Active: Auto drivers and walkers “Cognitively” Active and Passive Travel ActivePassive
  • 19.
    • Survey of196 adults in South Los Angeles • In-person surveys in English and Spanish • $10 Starbucks card incentive (Starbucks at shopping center) • 15 verbal questions and 2 sketch maps • Multiple and varied measures to capture information on: Travel mode Spatial knowledge / cognitive mapping Socio-economic status, spatial location Methods and Design
  • 20.
    Landmarks, Choice Points,and Mode of Travel Rather than asking participants to draw a “static” cognitive map of the neighborhood or region, they were asked to draw the routes from one place to another.
  • 21.
  • 22.
    Sketch Map: Hometo Survey Site
  • 23.
  • 24.
  • 25.
  • 26.
    Mapping Methodology How toanalyze such diverse sketch maps?
  • 27.
    Mapping Methodology How toanalyze such diverse sketch maps? Break them in to their component parts.
  • 28.
    Sketch Map Metrics •Landmarks • Labels • Icons • Routes • Segments • Choice Points
  • 29.
    Sketch Map Metrics •Landmarks • Labels • Icons • Routes • Segments • Choice Points
  • 30.
    Sketch Map Metrics •Landmarks • Labels • Icons • Routes • Segments • Choice Points
  • 31.
    Sketch Map Metrics •Landmarks • Labels • Icons • Routes • Segments • Choice Points
  • 32.
    Sketch Map Metrics LandmarkIcons and Labels Choice Points = • Comparable across varying distances • Tied to stages of spatial learning
  • 33.
    Ratio of LandmarkElements to Choice Points 0 0.5 1 1.5 2 2.5 3 Home to Survey Site Survey Site to Los Angeles City Hall Passive Mixed Active
  • 34.
    Robust OLS: Combined Landmark/ChoicePoint Ratio 34 Model 1 Model 2 Independent Variables Beta Sig. Beta Sig. Mixed Travel Style (vs. Passive) -0.453 0.038 -0.402 0.036 Active Travel Style (vs. Passive) -0.569 0.012 -0.513 0.009 Years in Neighborhood 0.195 0.122 0.201 0.090 Education in Years 0.015 0.902 Female -0.101 0.365 African American 0.010 0.947 Employment Status -0.072 0.579 Student Status -0.078 0.596 Age -0.165 0.149 -0.147 0.187 Constant . 0.027 . 0.000 N 65 67 F 1.90 2.95 Prob > F 0.0709 0.0271 R-squared 0.2511 0.2171
  • 35.
  • 36.
  • 37.
    Relative Distance Which is closer? Xor Y? Passive travelers guessed wrong 16% more often than active travelers.
  • 38.
    Variability in DistanceEstimates to Los Angeles City Hall 0 5 10 15 20 25 Standard Deviation Passive Mixed Active
  • 39.
    Controlling for OtherFactors Accuracy of the Distance Estimate Increases with: Variable Sign of Effect on Deviation from Mean Distance Active Travel Style (relative to Passive) ++ Mixed Travel Style (relative to Passive) + Years in Neighborhood + Currently Employed - Currently Student - Female Respondent -- African American Respondent -
  • 40.
    Activity Spaces • TorstenHägerstrand (time- space geography) • A measure of the experience of cities • Higher correlation with long-term outcomes than traditional travel measures • Content of an activity space matters as much as extent!
  • 41.
    0.0 20.0 40.0 60.0 80.0 100.0 120.0 140.0 160.0 180.0 0.0% 2.0% 4.0% 6.0% 8.0% 10.0% 12.0% 14.0% 16.0% 18.0% 20.0% 6-10 11-15 16-2021-25 26-30 ActivitySpaceSize(sq.km.) WalkingTrips as%ofAllTrips Changes in Travel during Childhood: Non-School Days, Southern California Walking Rates Activity Space (sqkm) Data: Southern California Association of Governments Regional Travel Survey
  • 43.
    Findings and Implications •How we understand cities changes over the lifespan, including knowledge of opportunities. • Reliance on landmarks is particularly important for young adults. • Active (independent?) travel engages spatial learning. • Urban “legibility” is different depending on travel mode. • Planners need to treat travel as an integral part of the broader urban experience, including for youth.
  • 44.
    Future Directions • Transportationplanning and youth development: oPromoting more sustainable travel behavior through urban legibility oRole of information technologies in youth travel oMeasuring the affective dimensions of the cognitive map – safety, security, attachment, engagement oMeasuring youth activity spaces
  • 45.
    Future Directions • Learningand travel: oHow is spatial learning tied to overall development? oLearning outside school? oHow can planners foster independent mobility? oWhat are the effects of different built environments? o Old suburban o New Urbanist o Transit-oriented development oLinkages to social and psychological health
  • 46.

Editor's Notes

  • #13 Put another way, cognitive mapping is space as it is experienced by indviduals.Importantly, while our cognitive maps map be incomplete and error-prone, that error is not necessarily random. Instead, deviations from the norm may be associated with particular characteristics, whether individual, social, or spatial that can be analyzed and lead to greater understanding of the urban environment.
  • #14 This image is a classic representation of how a cognitive map might be distilled into its geometric components, from Kevin Lynch’s 1960 book Image of the City. A neighborhood, in this case downtown Los Angeles, gets broken into component parts, including paths, edges, nodes, districts, and landmarks. While there is a relationship with the actual geography, it’s not one-to-one, and is imbued with a hierachy of major elements and minor or ignored elements.
  • #40 These results can also be analyzed in multivariate statistical analysis. This simple regression uses the absolute deviation of each respondent from the normalized mean distance estimate for the landmark question as the dependent variable. From the survey questions we asked about several factors in addition to mode, including employment status and gender.This regression, which explains about a quarter of the distance estimate. Some interesting effects are apparent. Not surprisingly, being an active traveler instead of a passive traveler reduces how much one’s estimate deviated from the mean, correct distance estimate. Conversely, female gender increases the deviation from the mean, correct estimate. Employment status has a mixed effect, where simply being employed seems to increase the deviation while traveling to work specifically by car more or less cancels out the effect.An significant R-squared of .23 isn’t irrelevant for a process as challenging to pin down as cognitive knowledge acquistion, but I suspect that there’s another important factor that is unfortunately still missing. That is the spatial factor. I would hypothesize that distance of residence and/or employment from the landmark has a significant effect on the correctness of one’s spatial knowledge. Unfortunately, this final part of the analysis, a spatial regression is not quite ready. It will be in short order, so maybe I can show everyone those results in the not too distant future!
  • #41 Now I want to focus a bit more explicitly on some of the theoretical concepts that feed into my research.Most broadly is a generalized concern with how individuals experience space and how individuals and groups construct places. I draw primarily on findings from environmental and cognitive psychology to conceptualize the basic process by which individuals interpret and react to stimuli in the environment, and I also draw on methods developed by environmental psychologists to extract valid data from individuals.Behavioral geography is particularly important for the contributions of Reginald Golledge at UC Santa Barbara, who has conducted a tremendous amount of research on how cognition and travel behavior are tied together, particularly through the wayfinding process.Cognitive mapping is the notion that we store an analyzable map of the environment inside our minds, and I’ll have much more to say about that throughout this talk.