Download to read offline
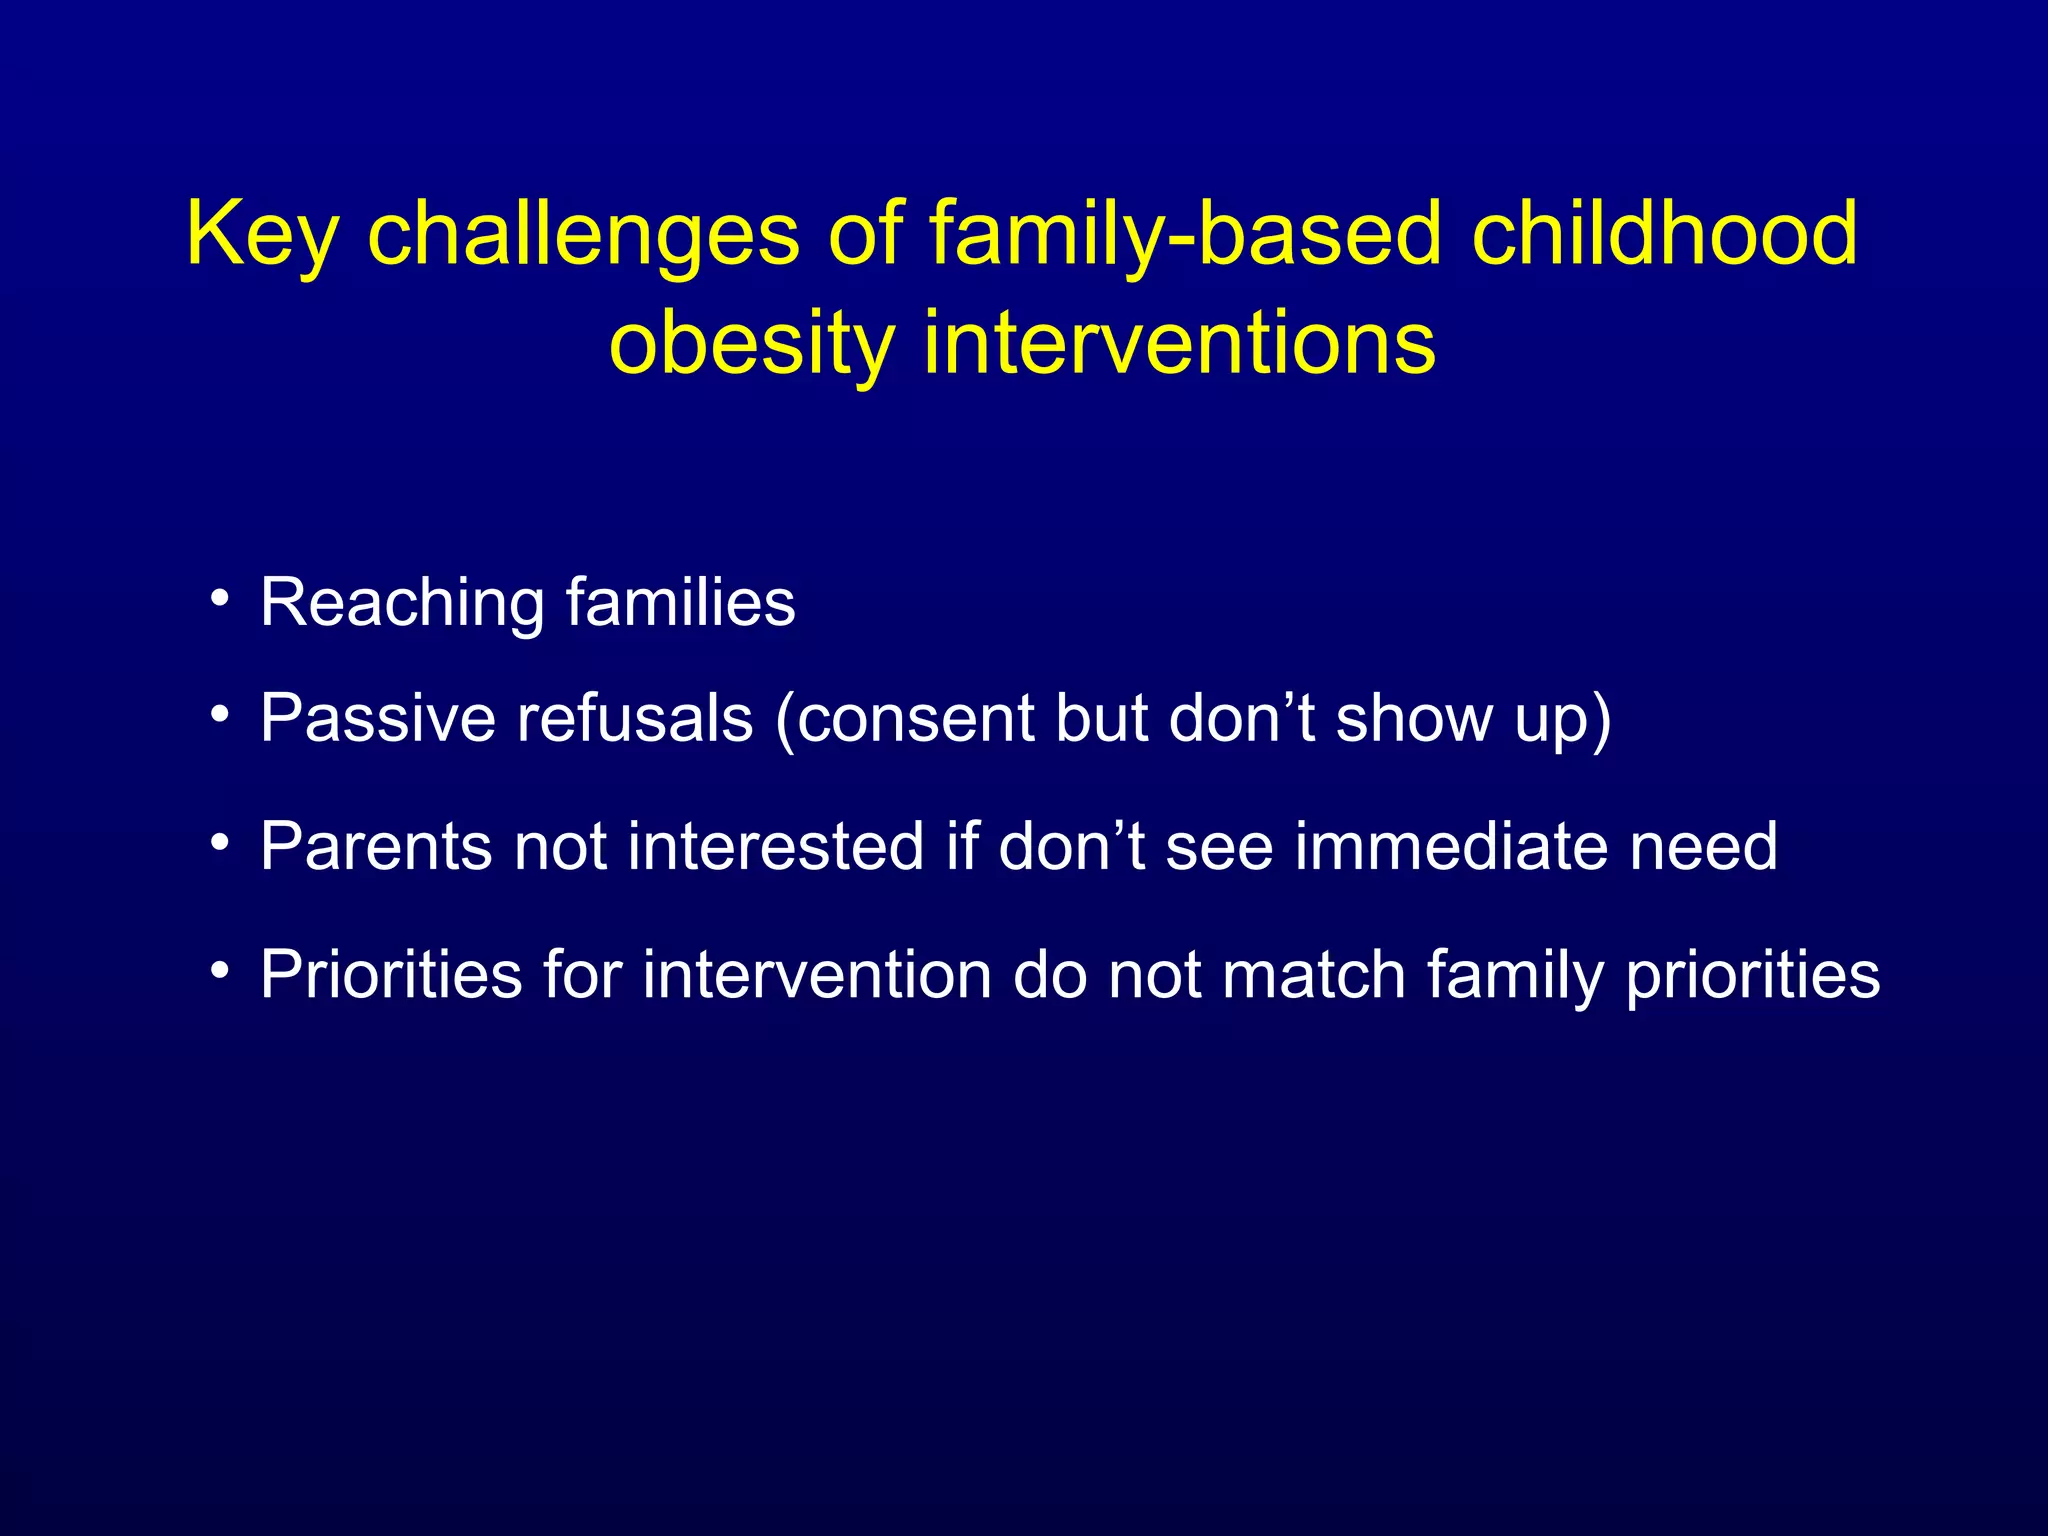
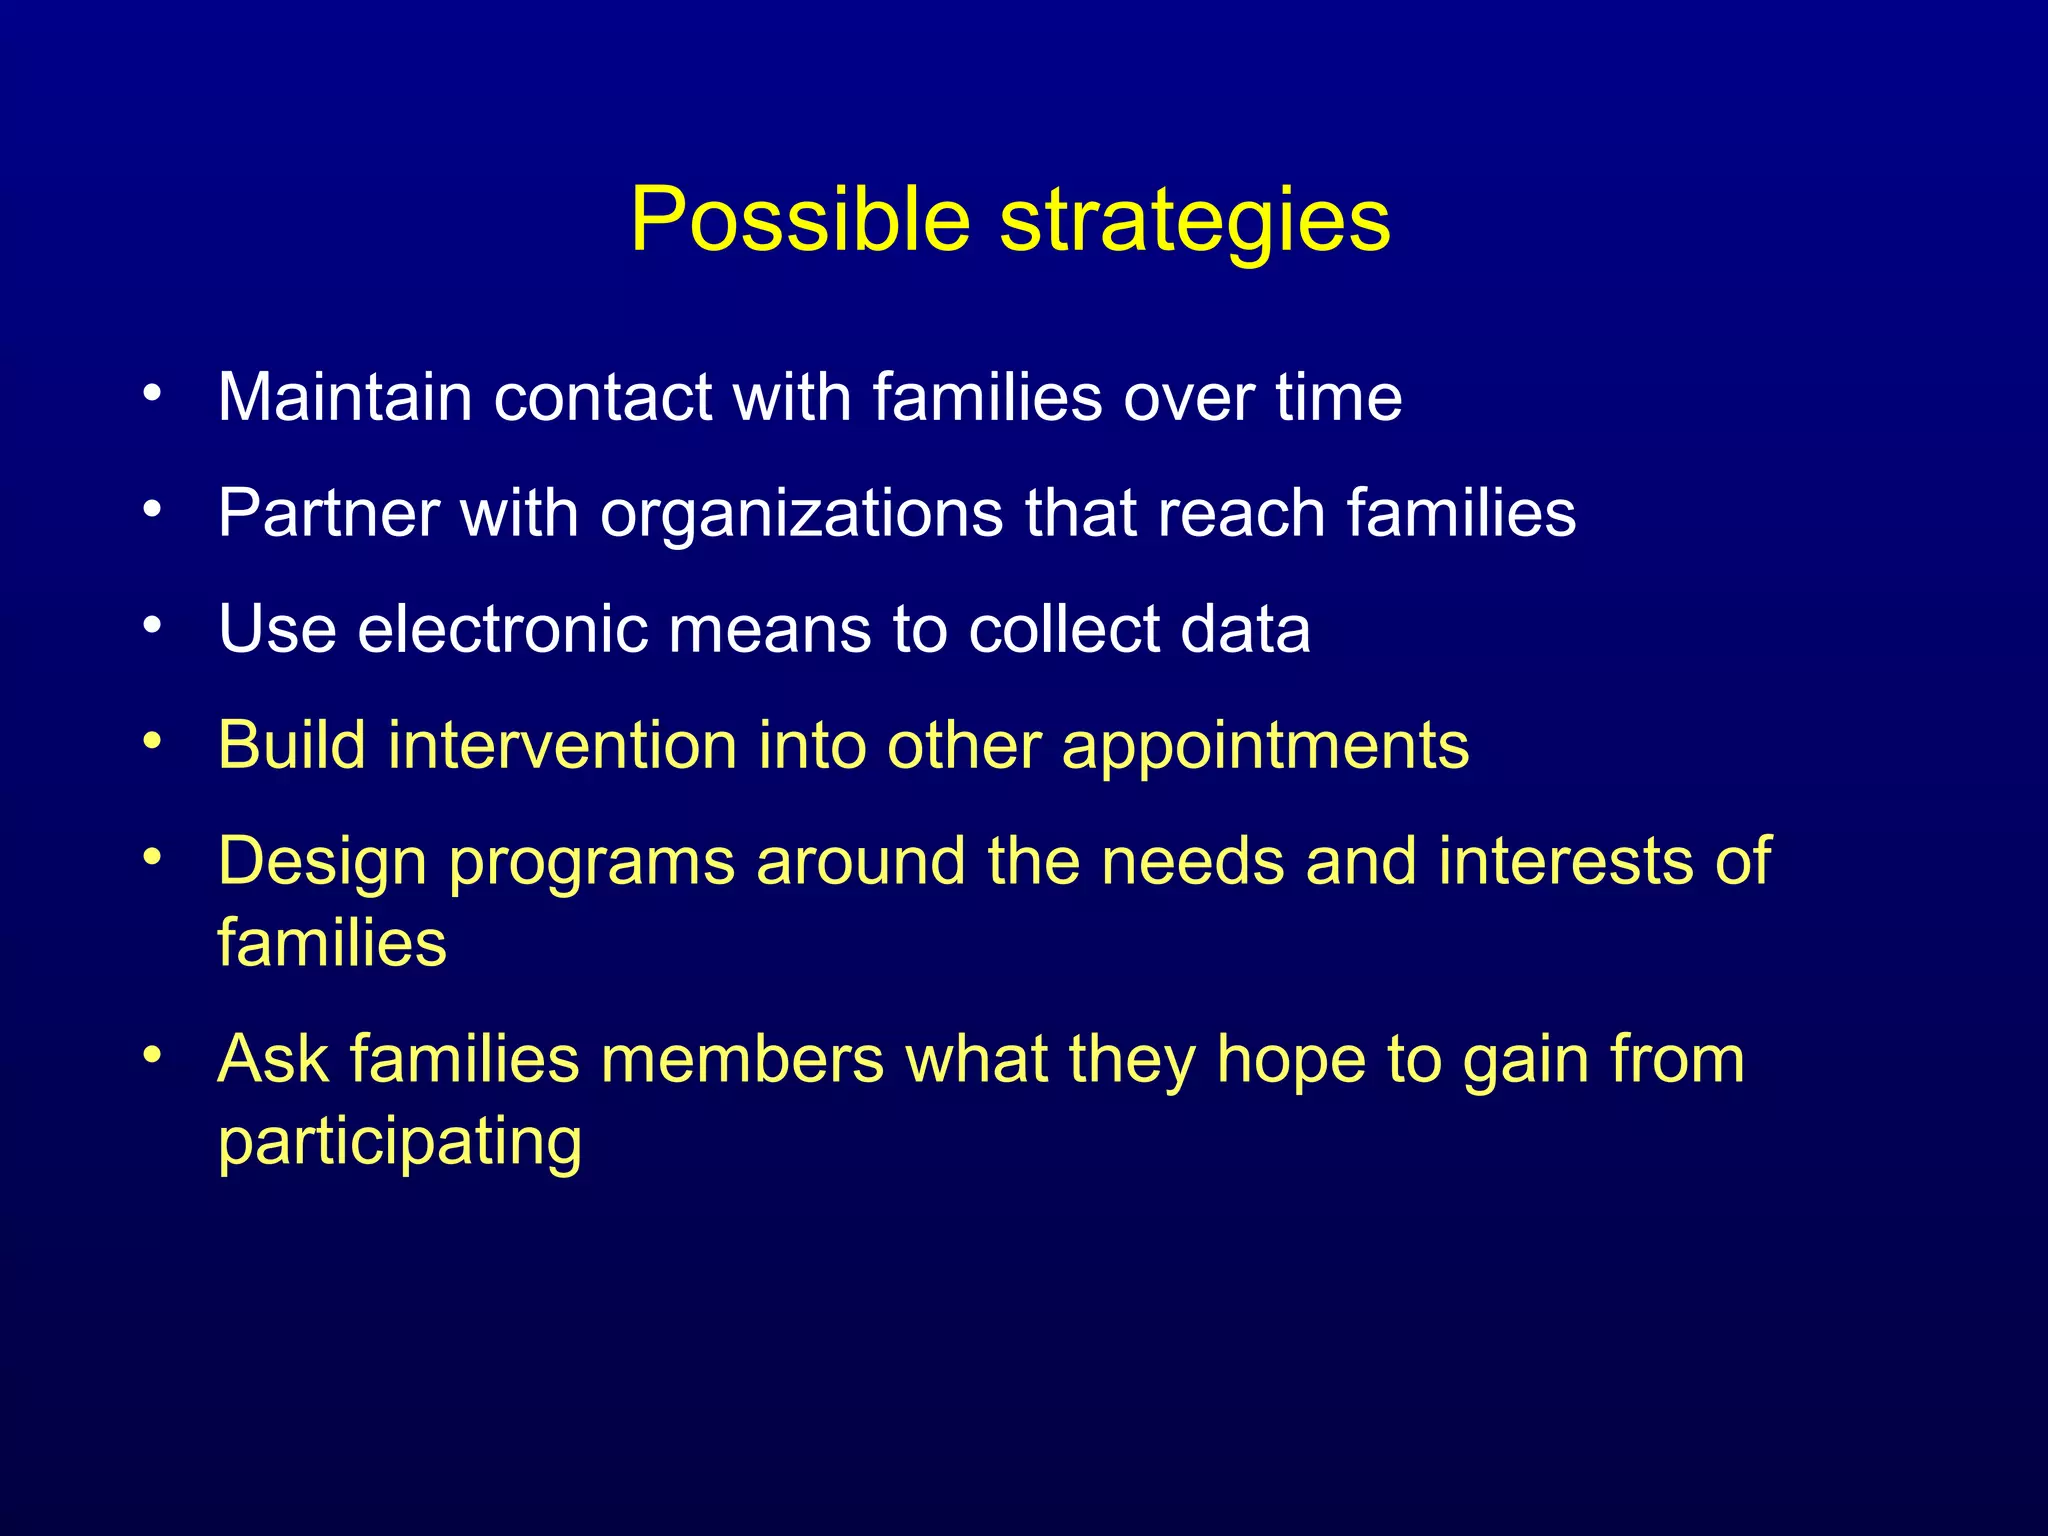
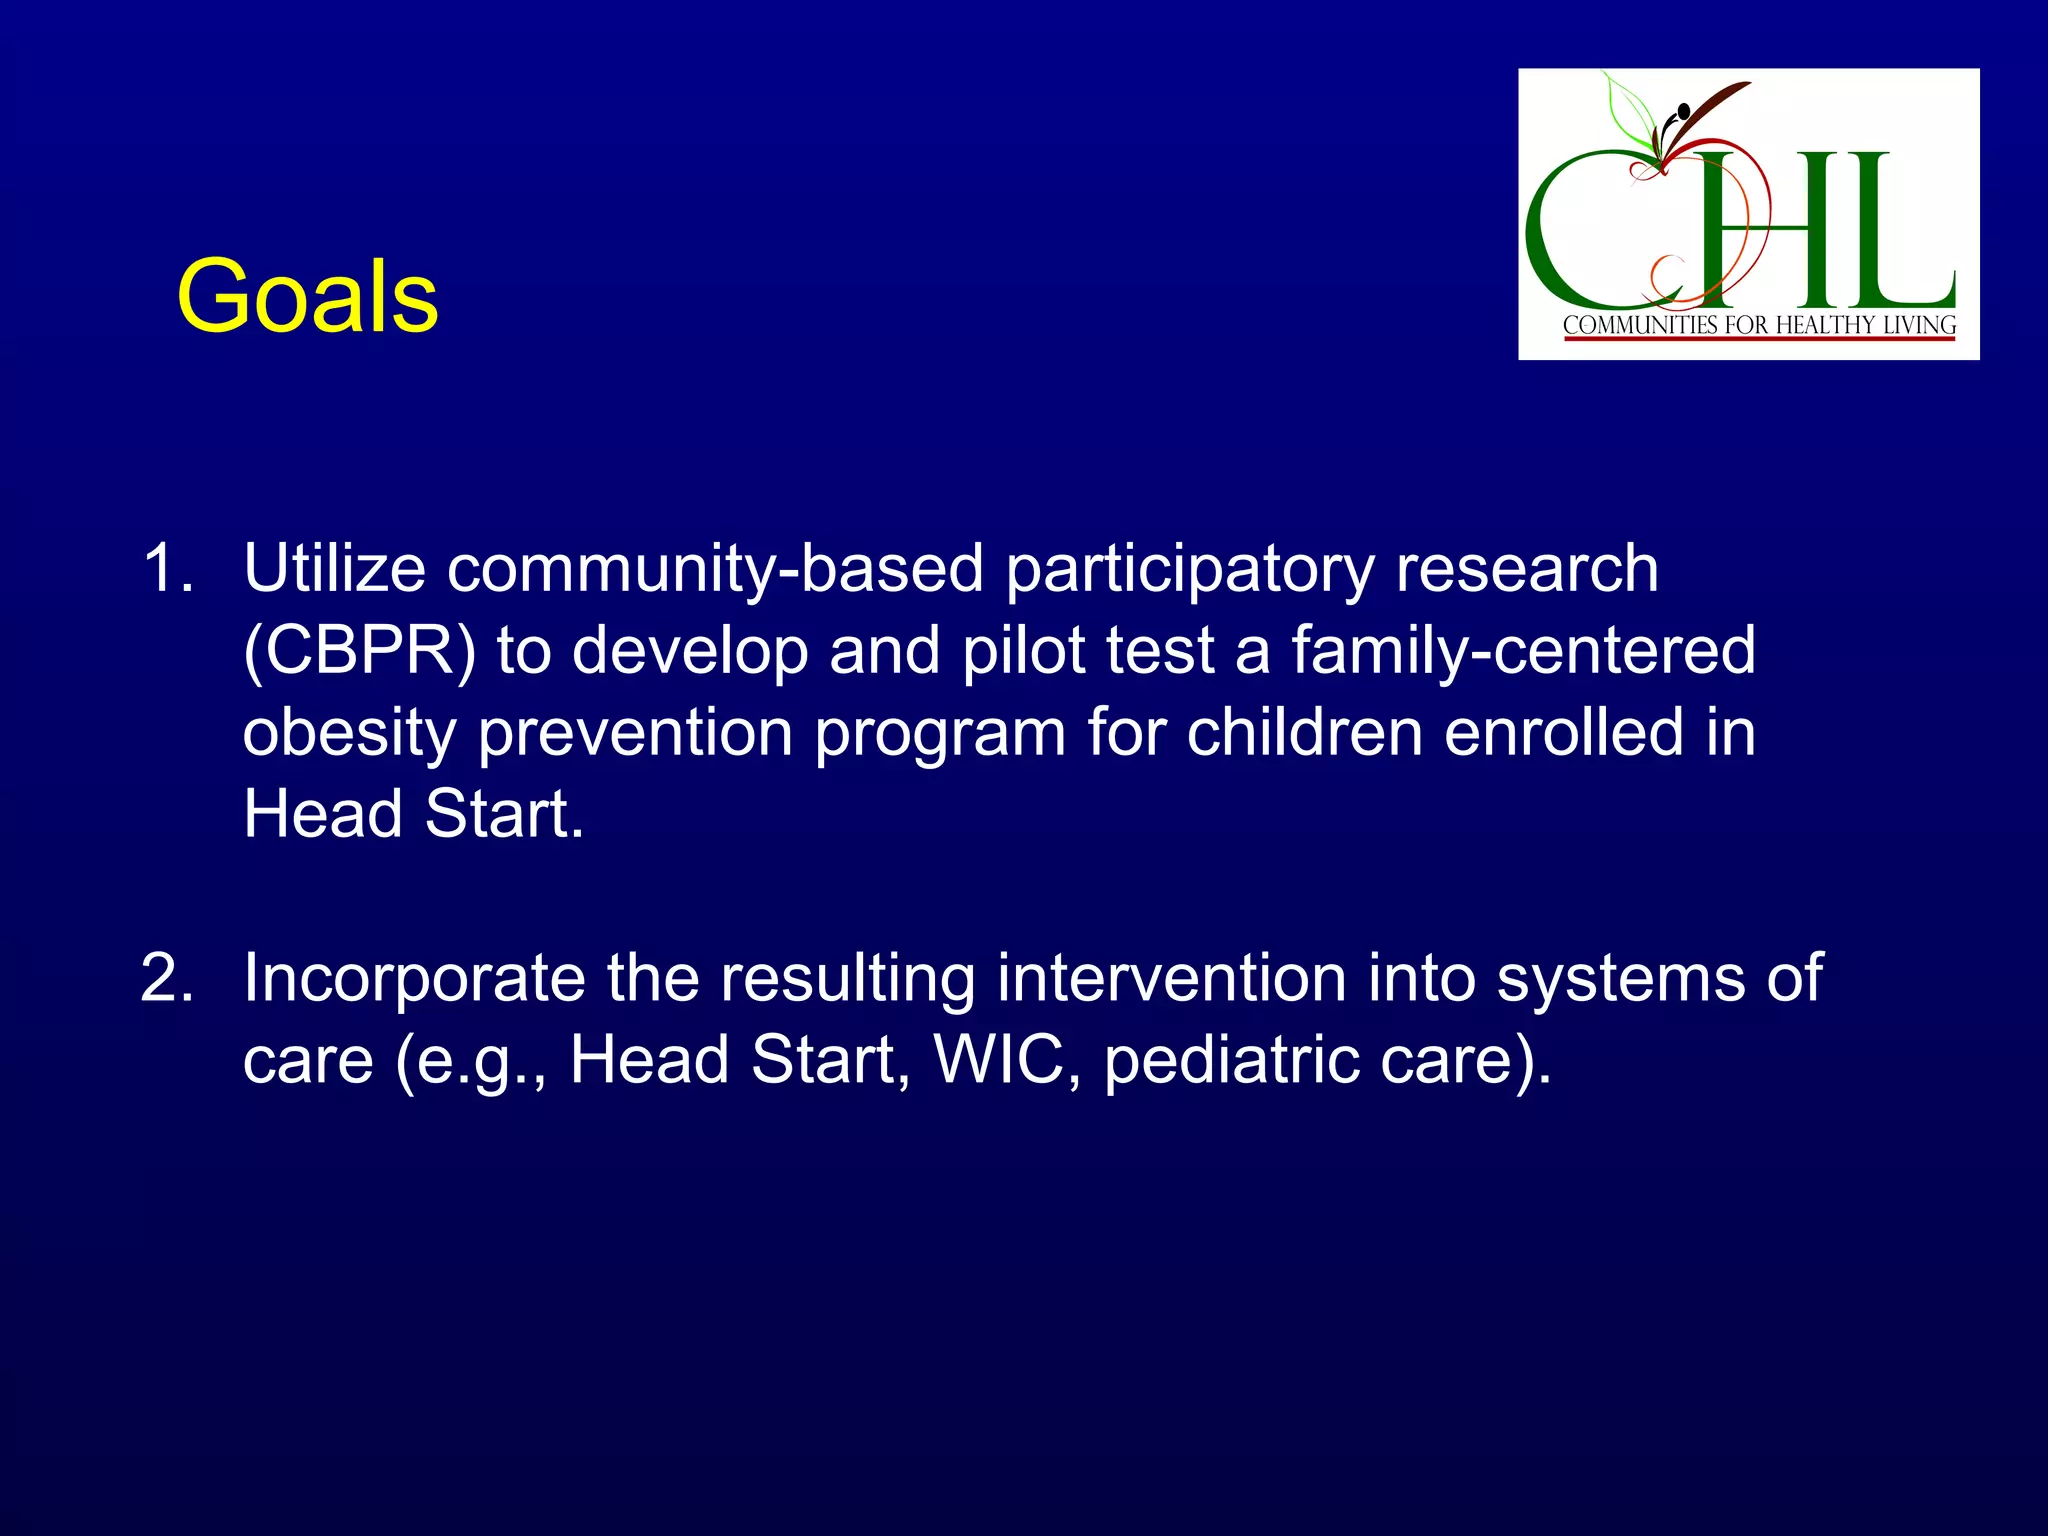
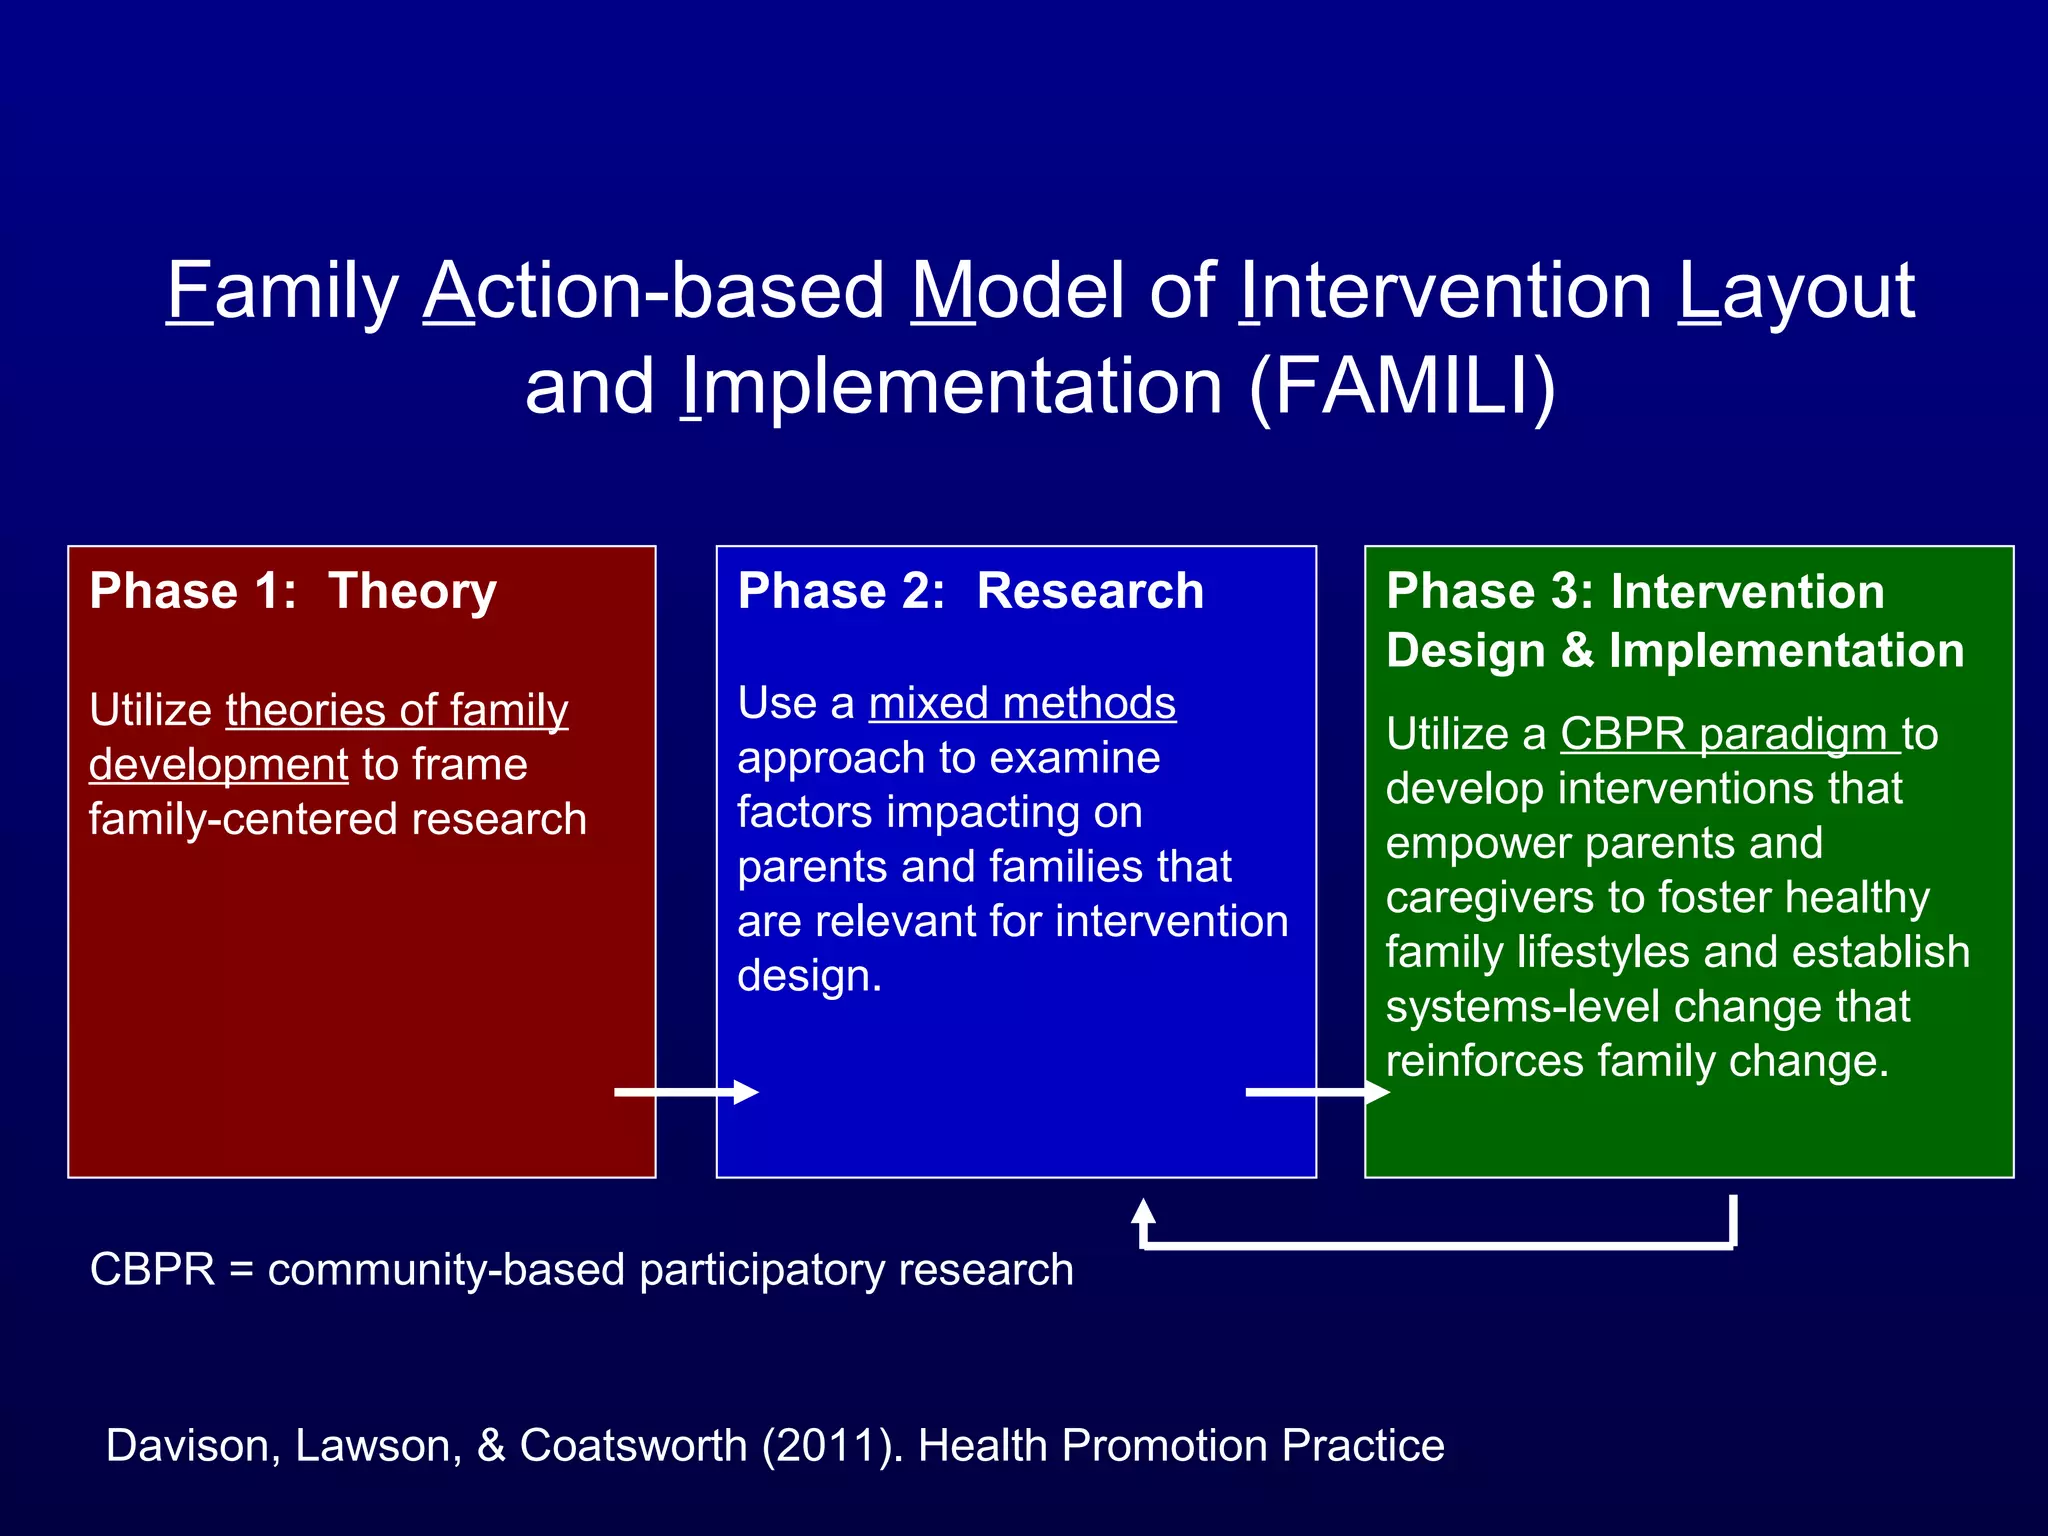
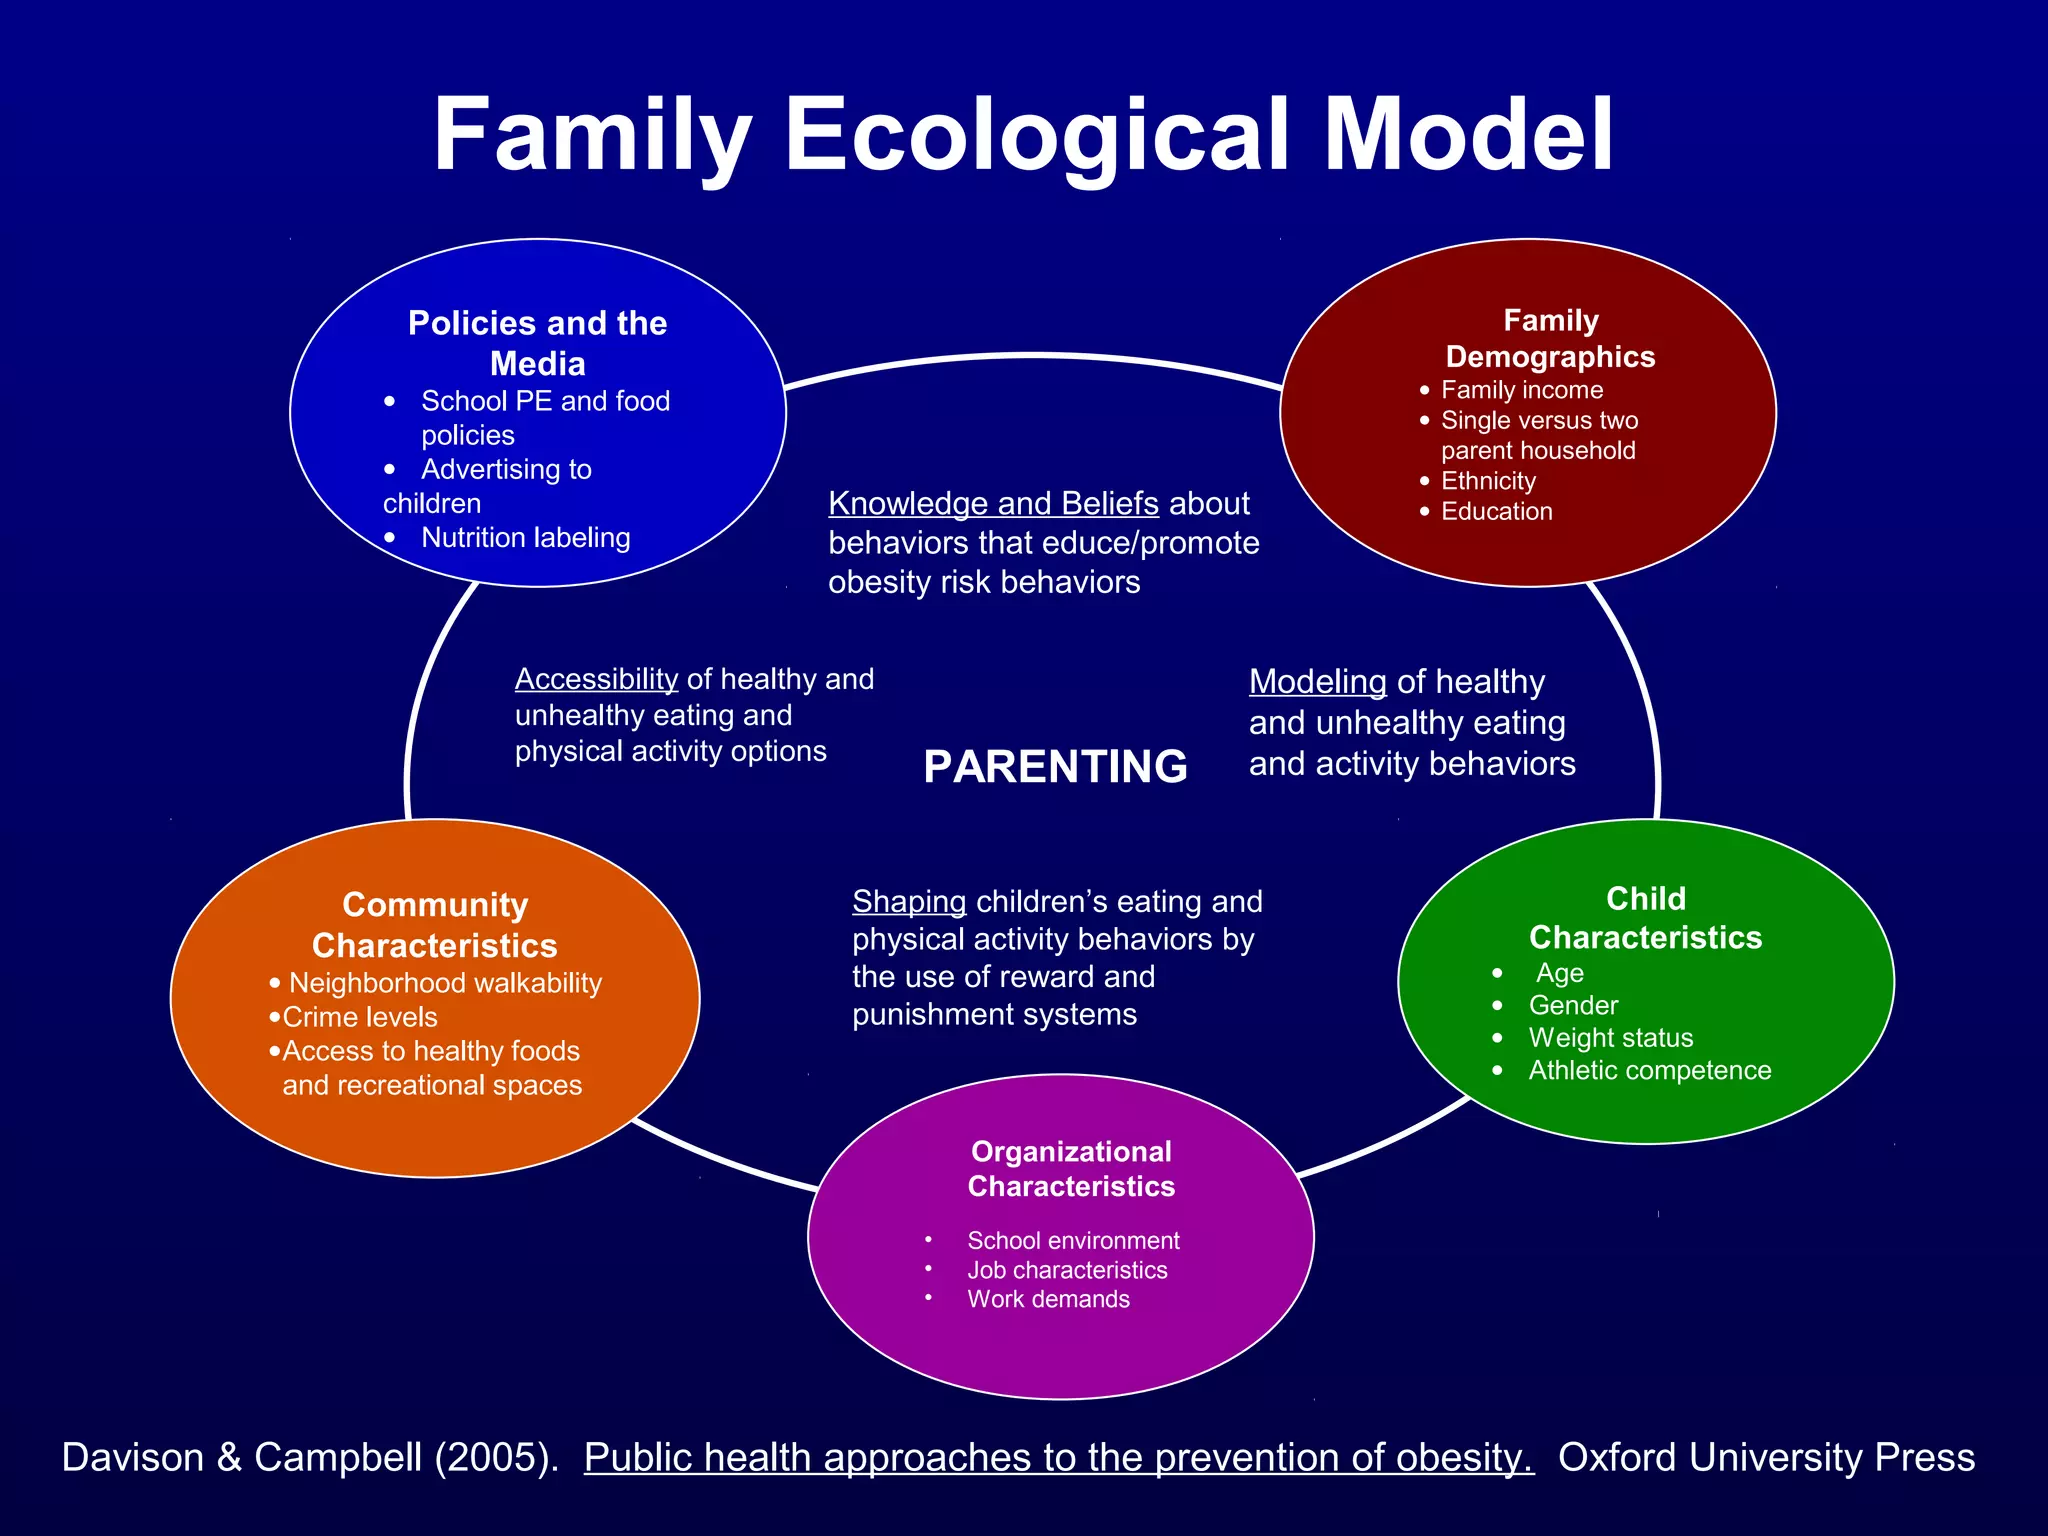
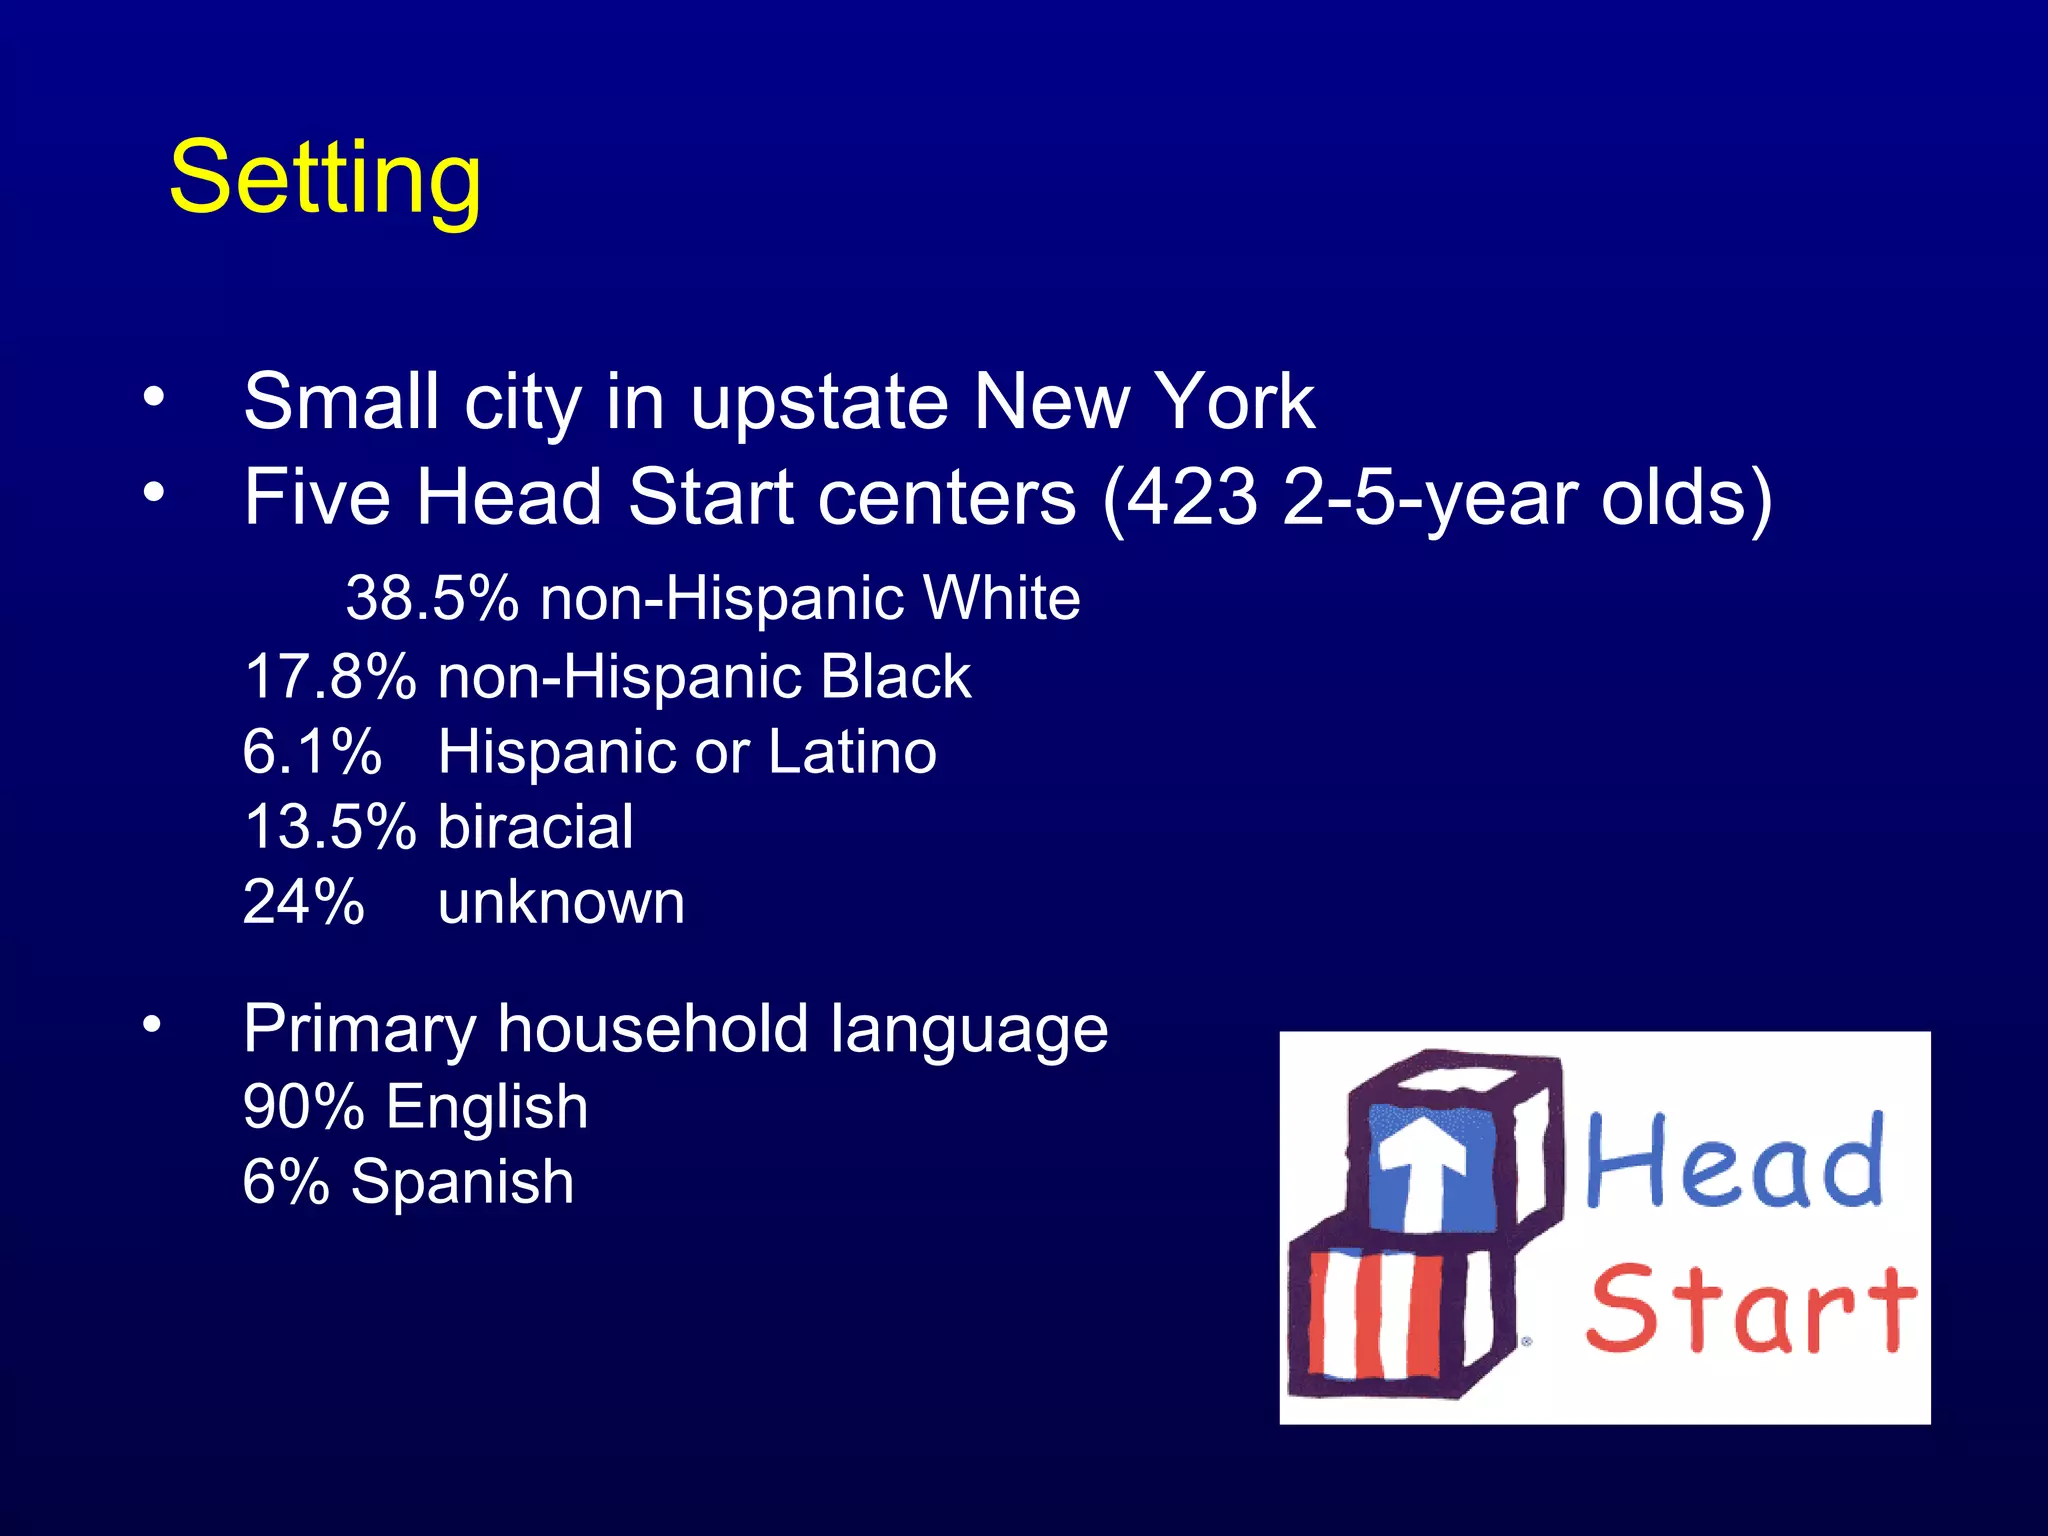
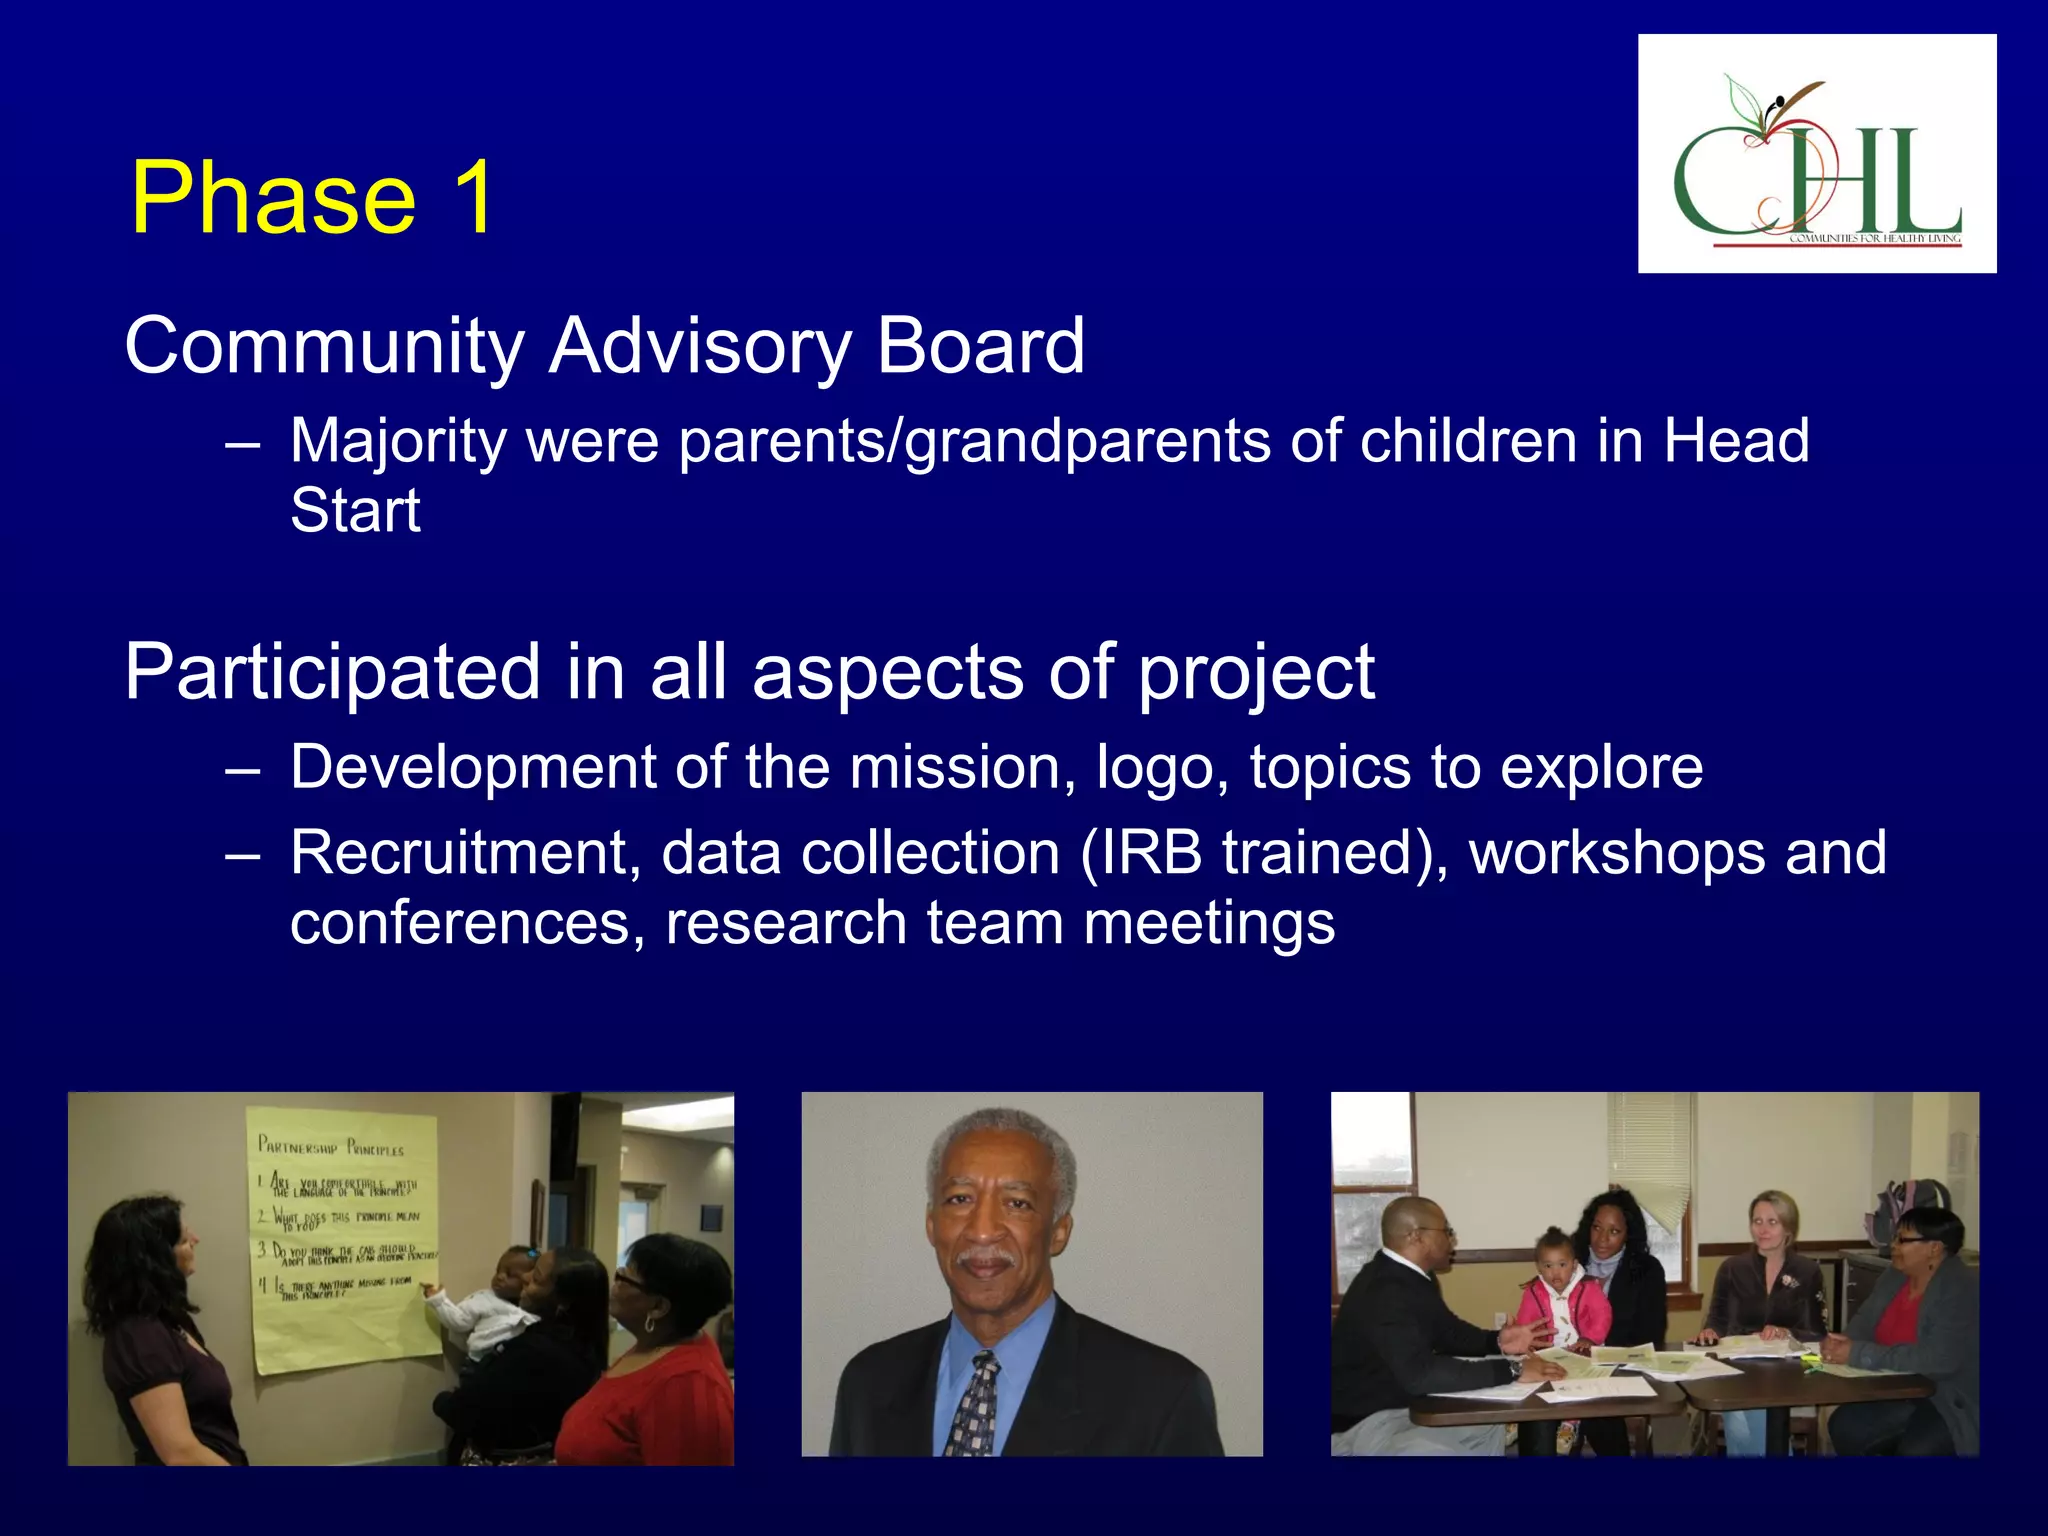
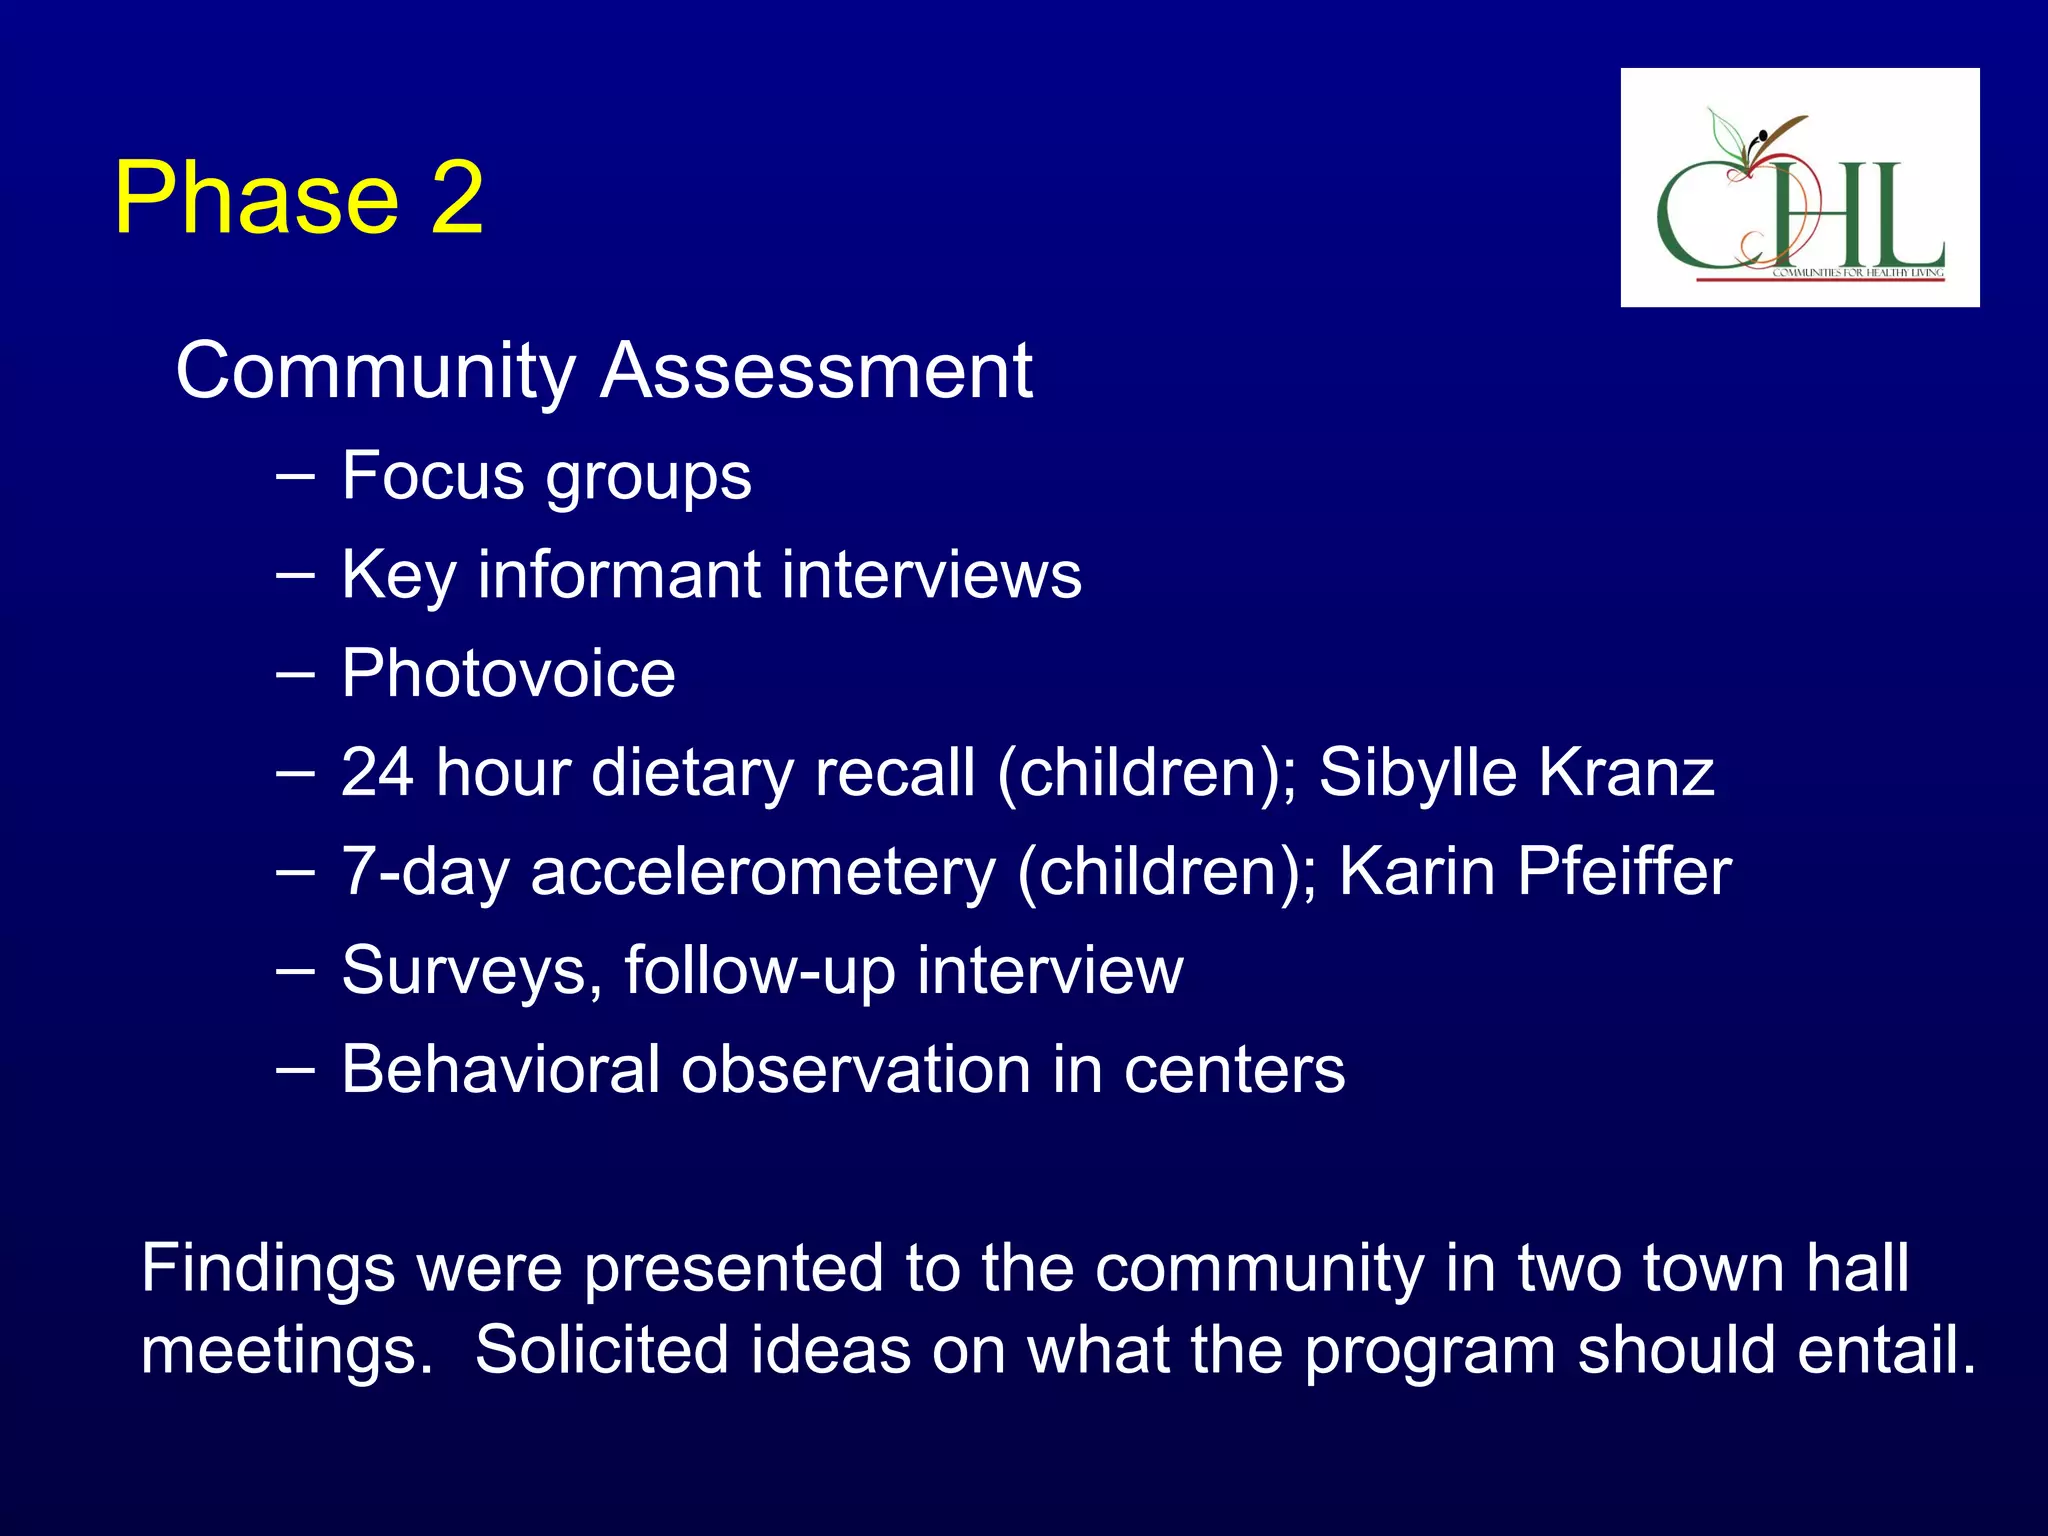
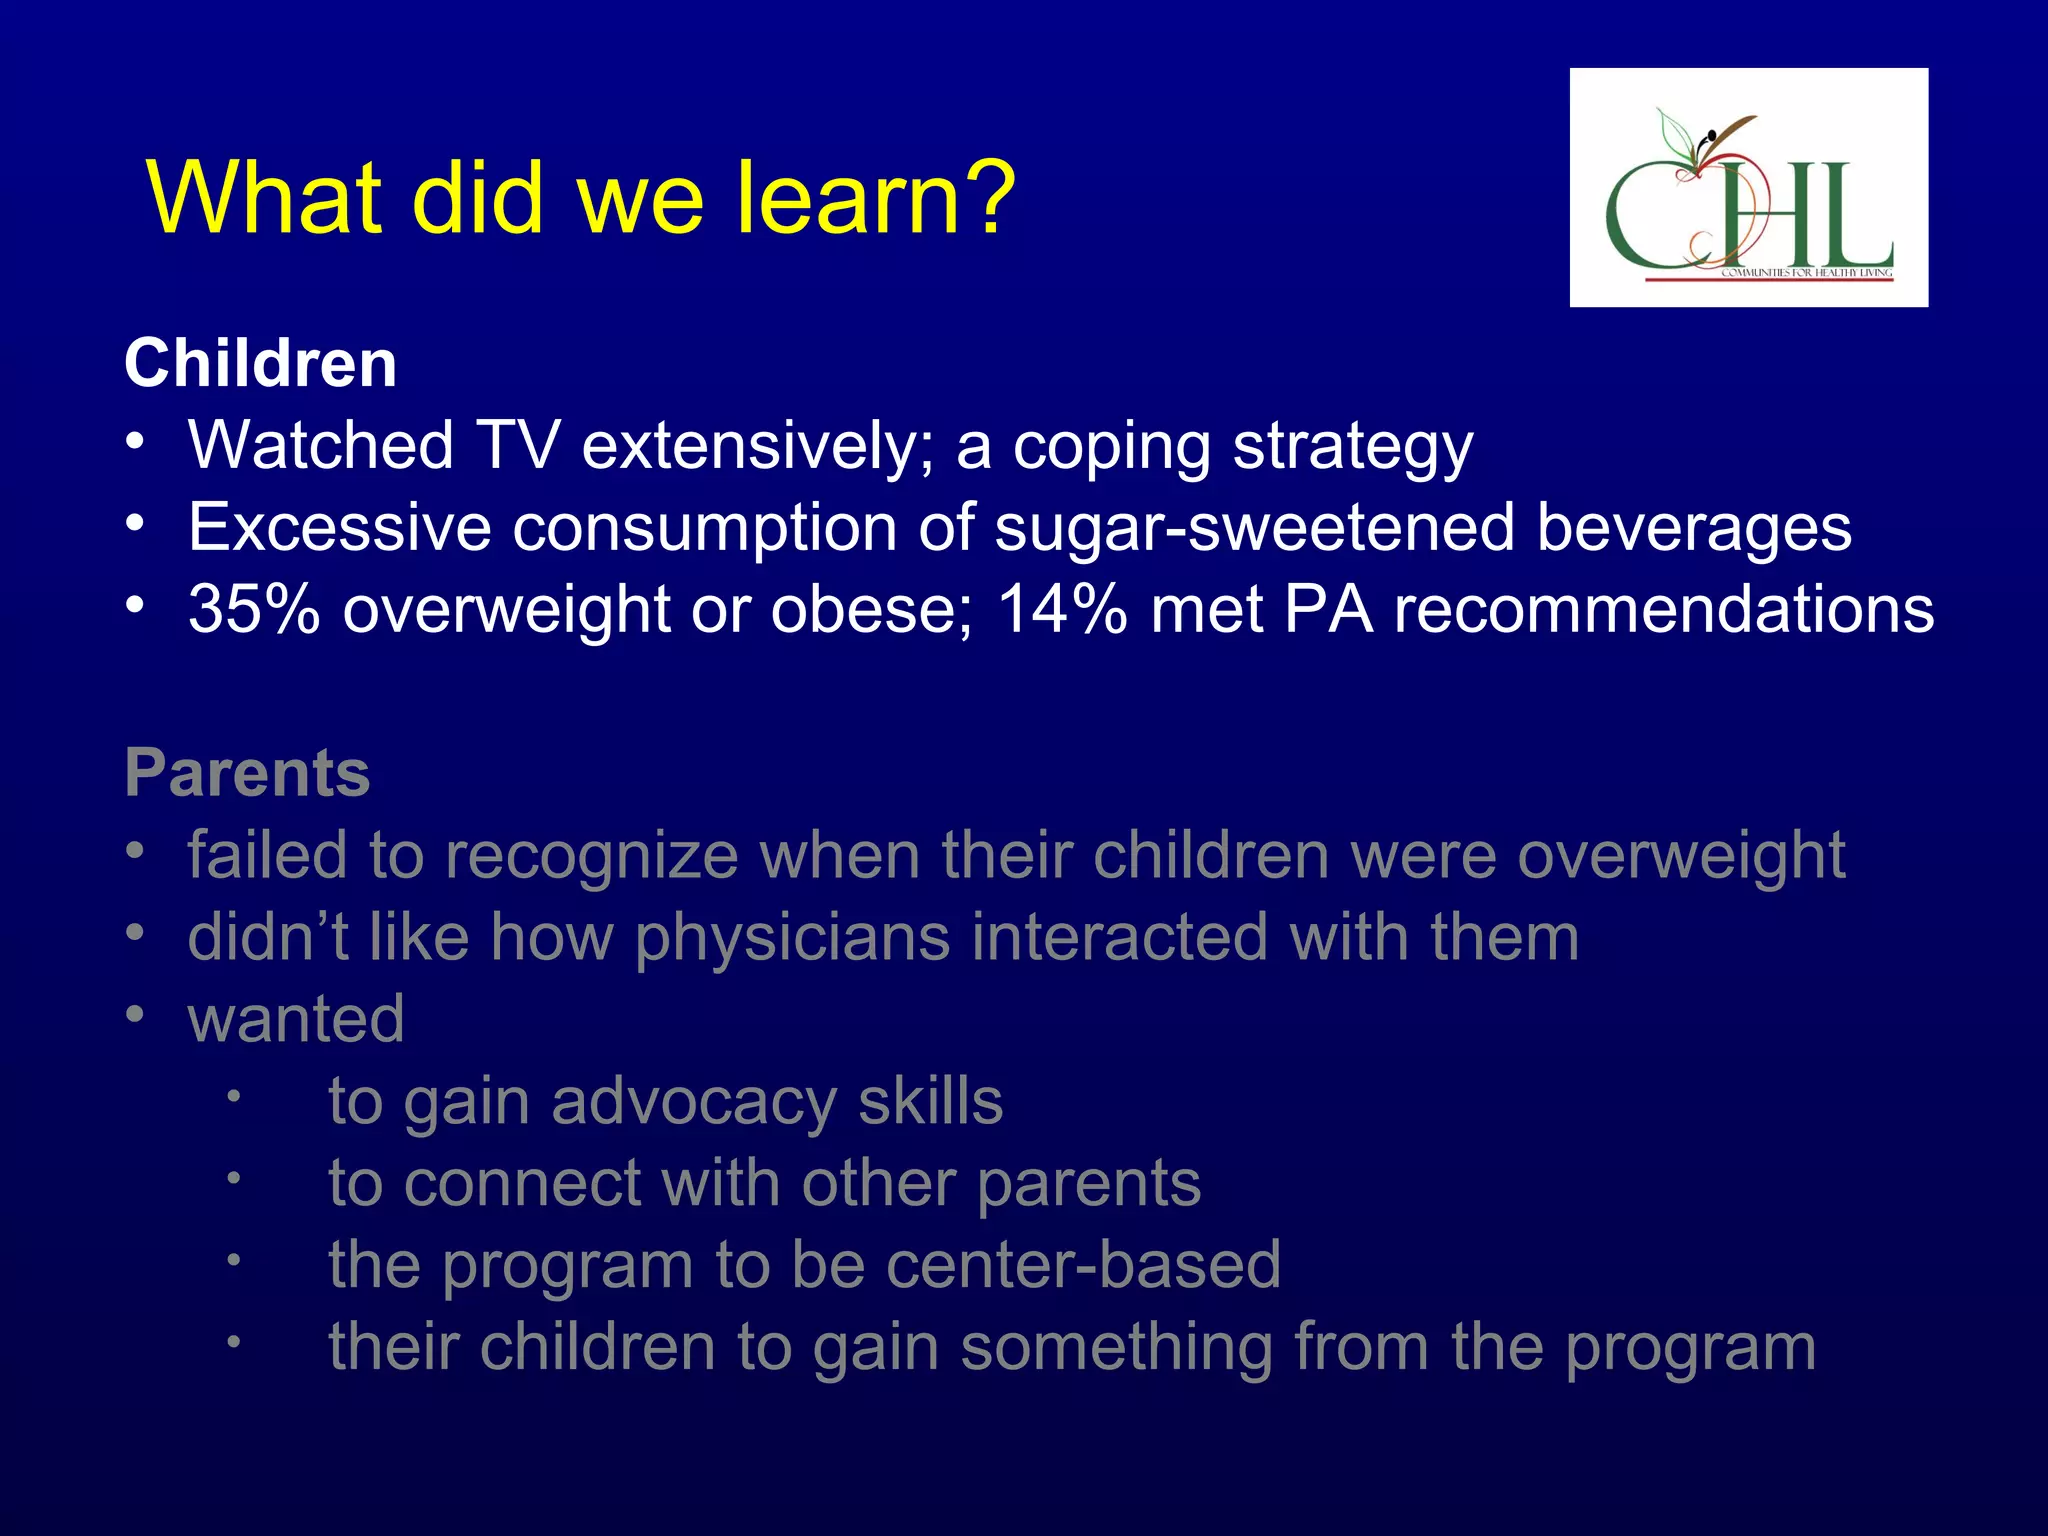
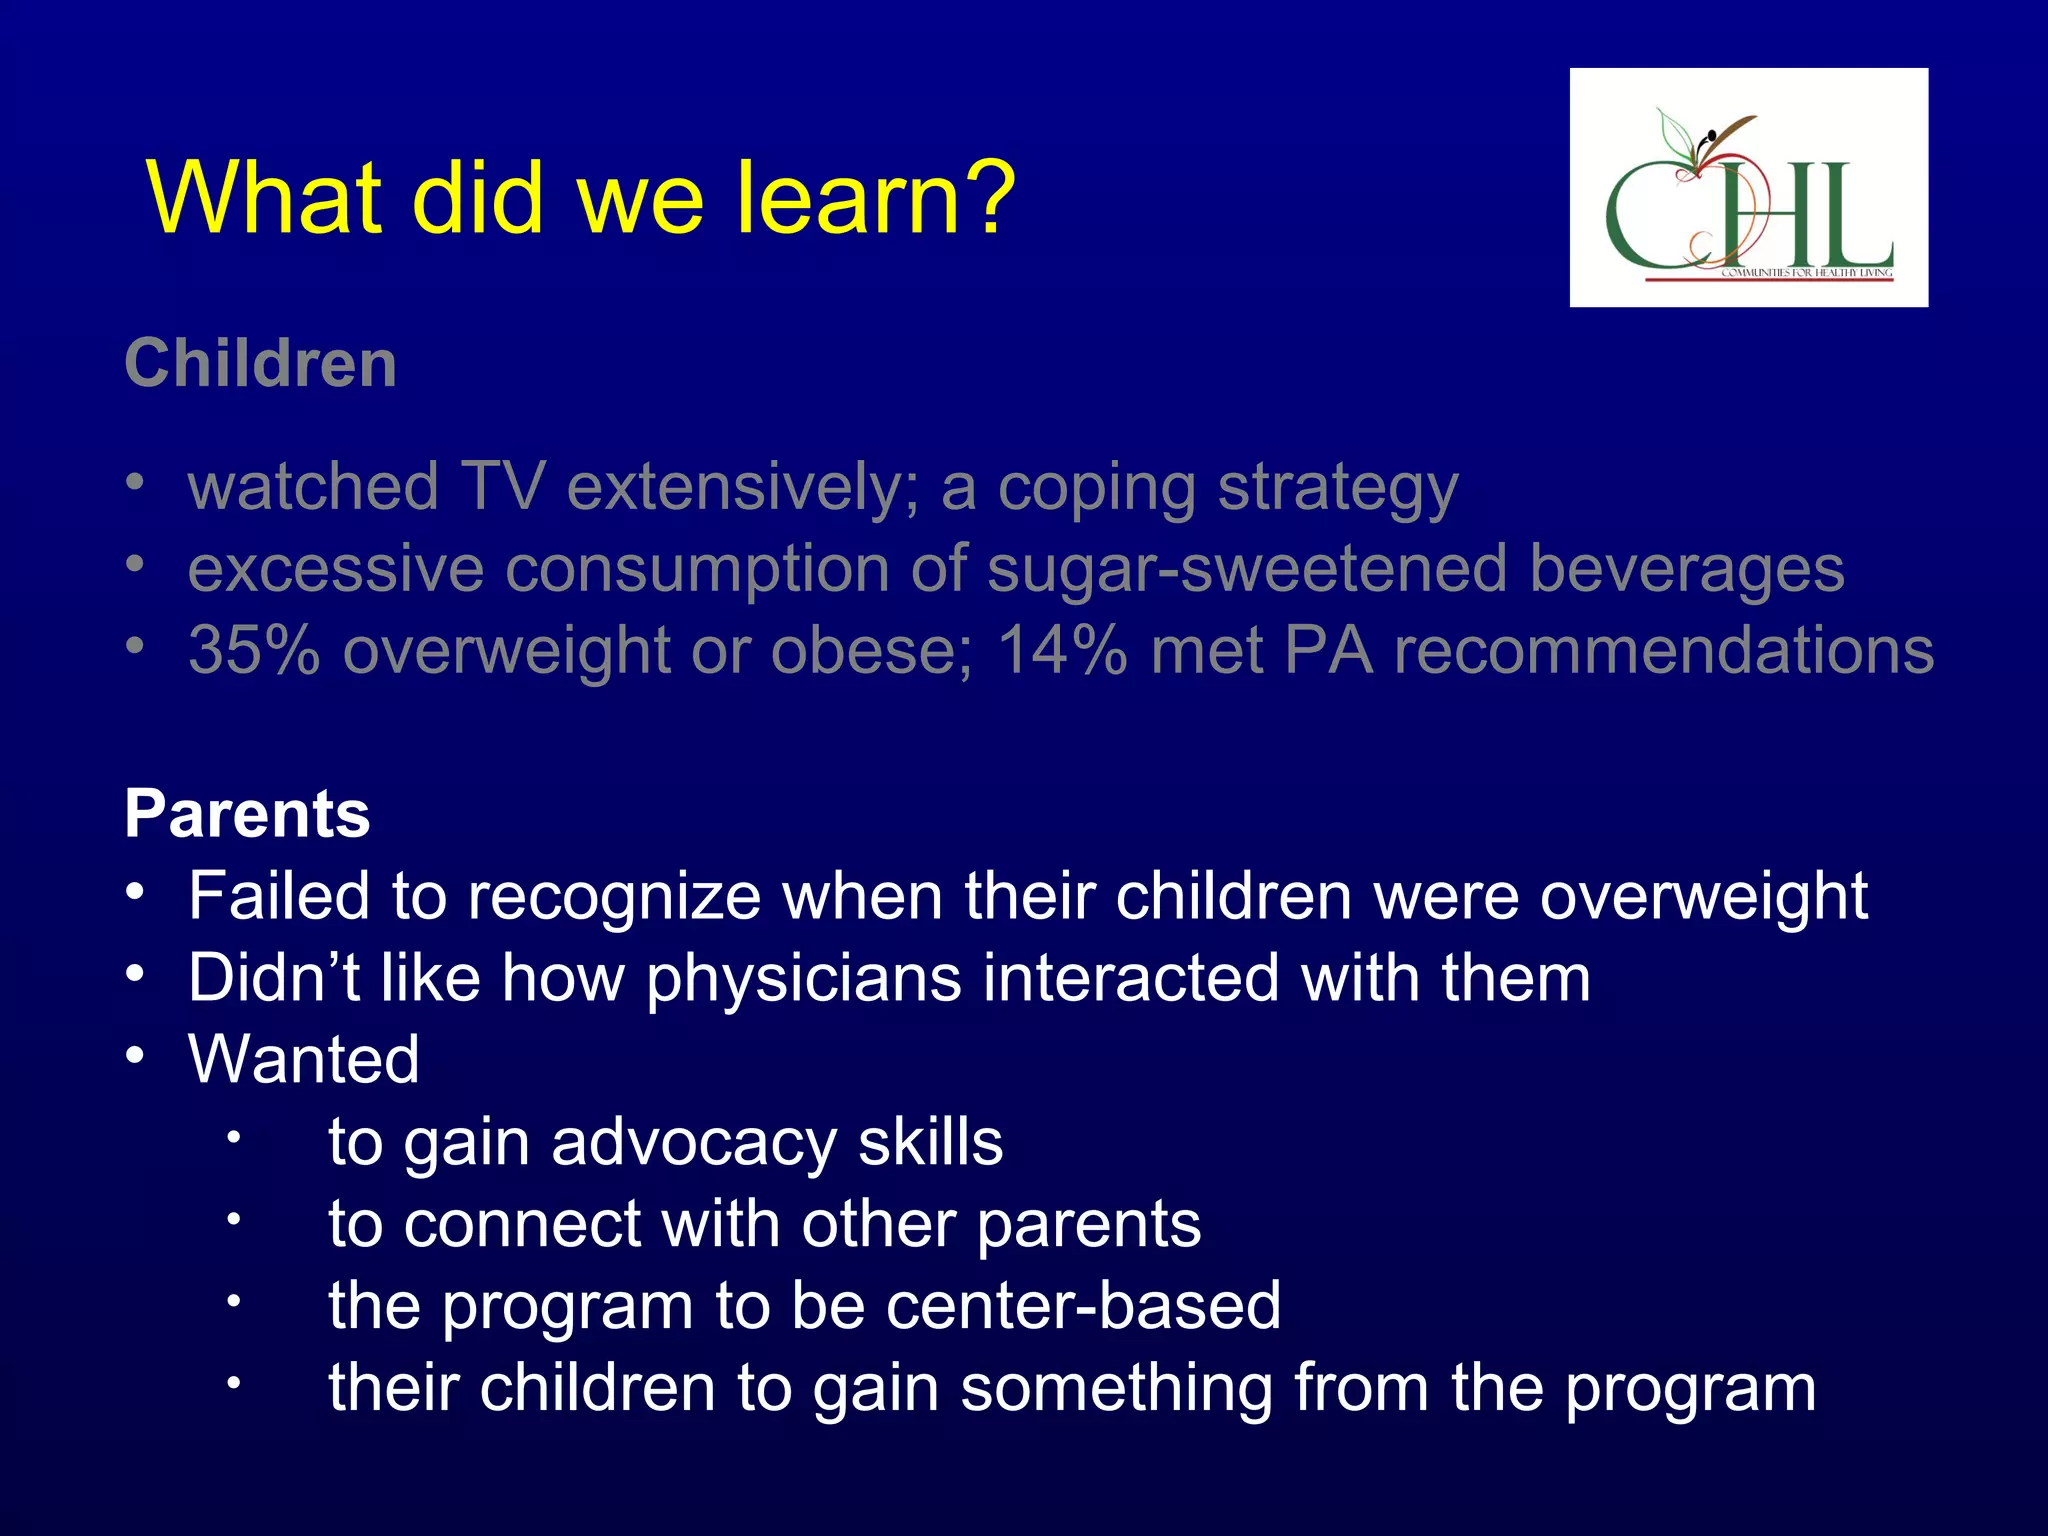
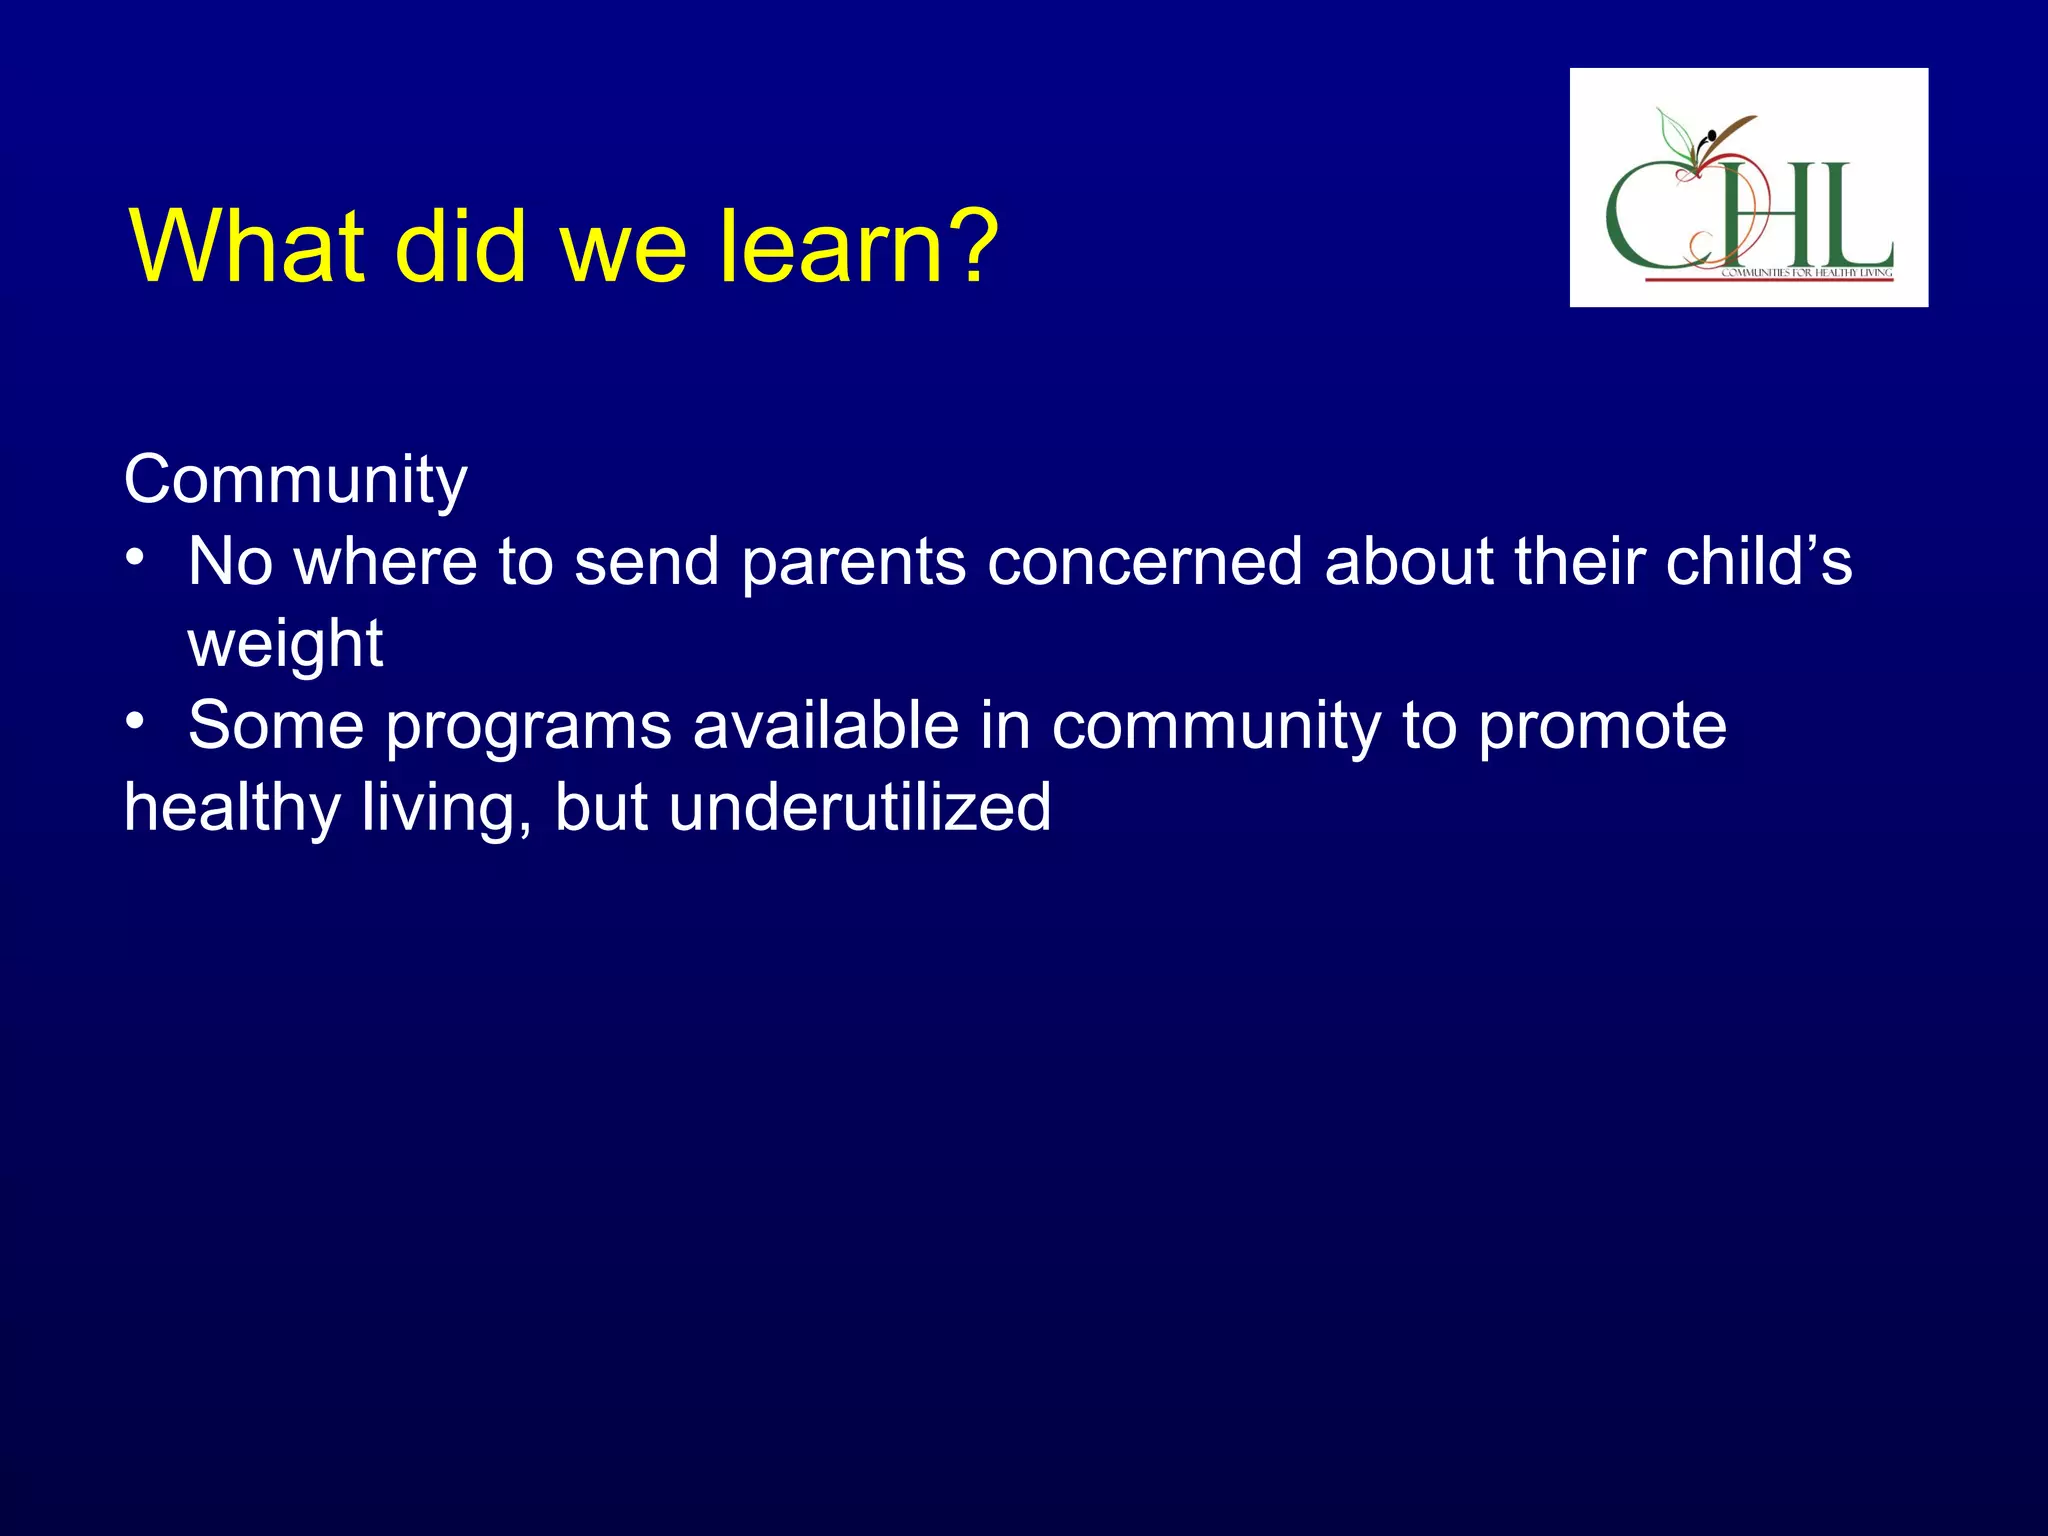
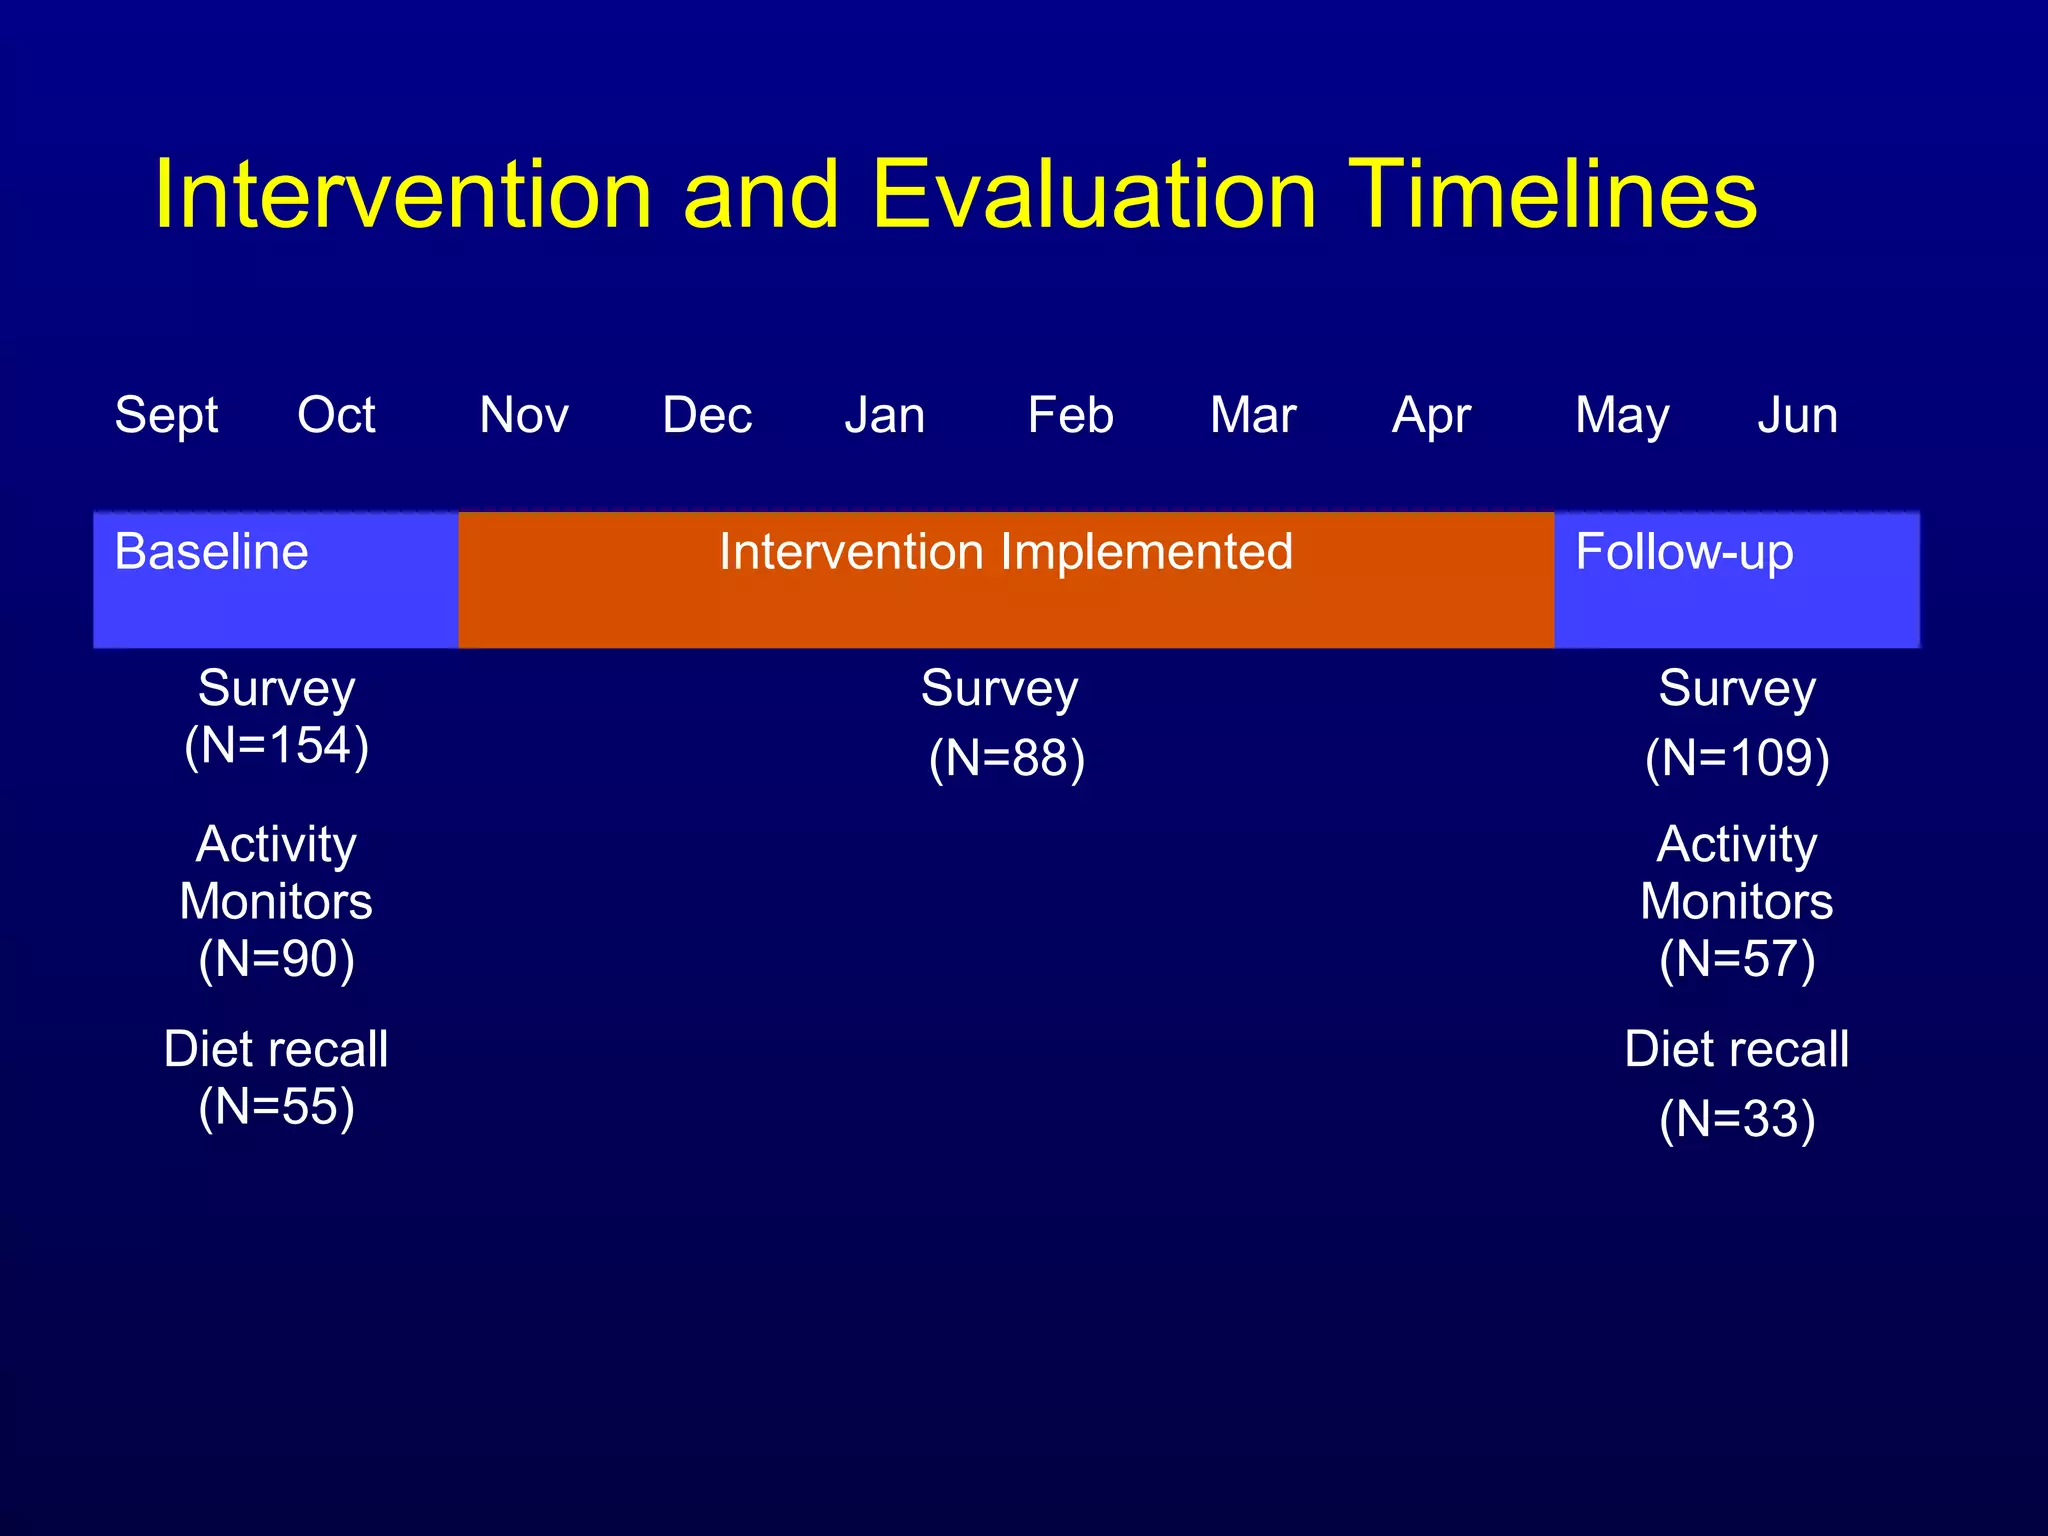
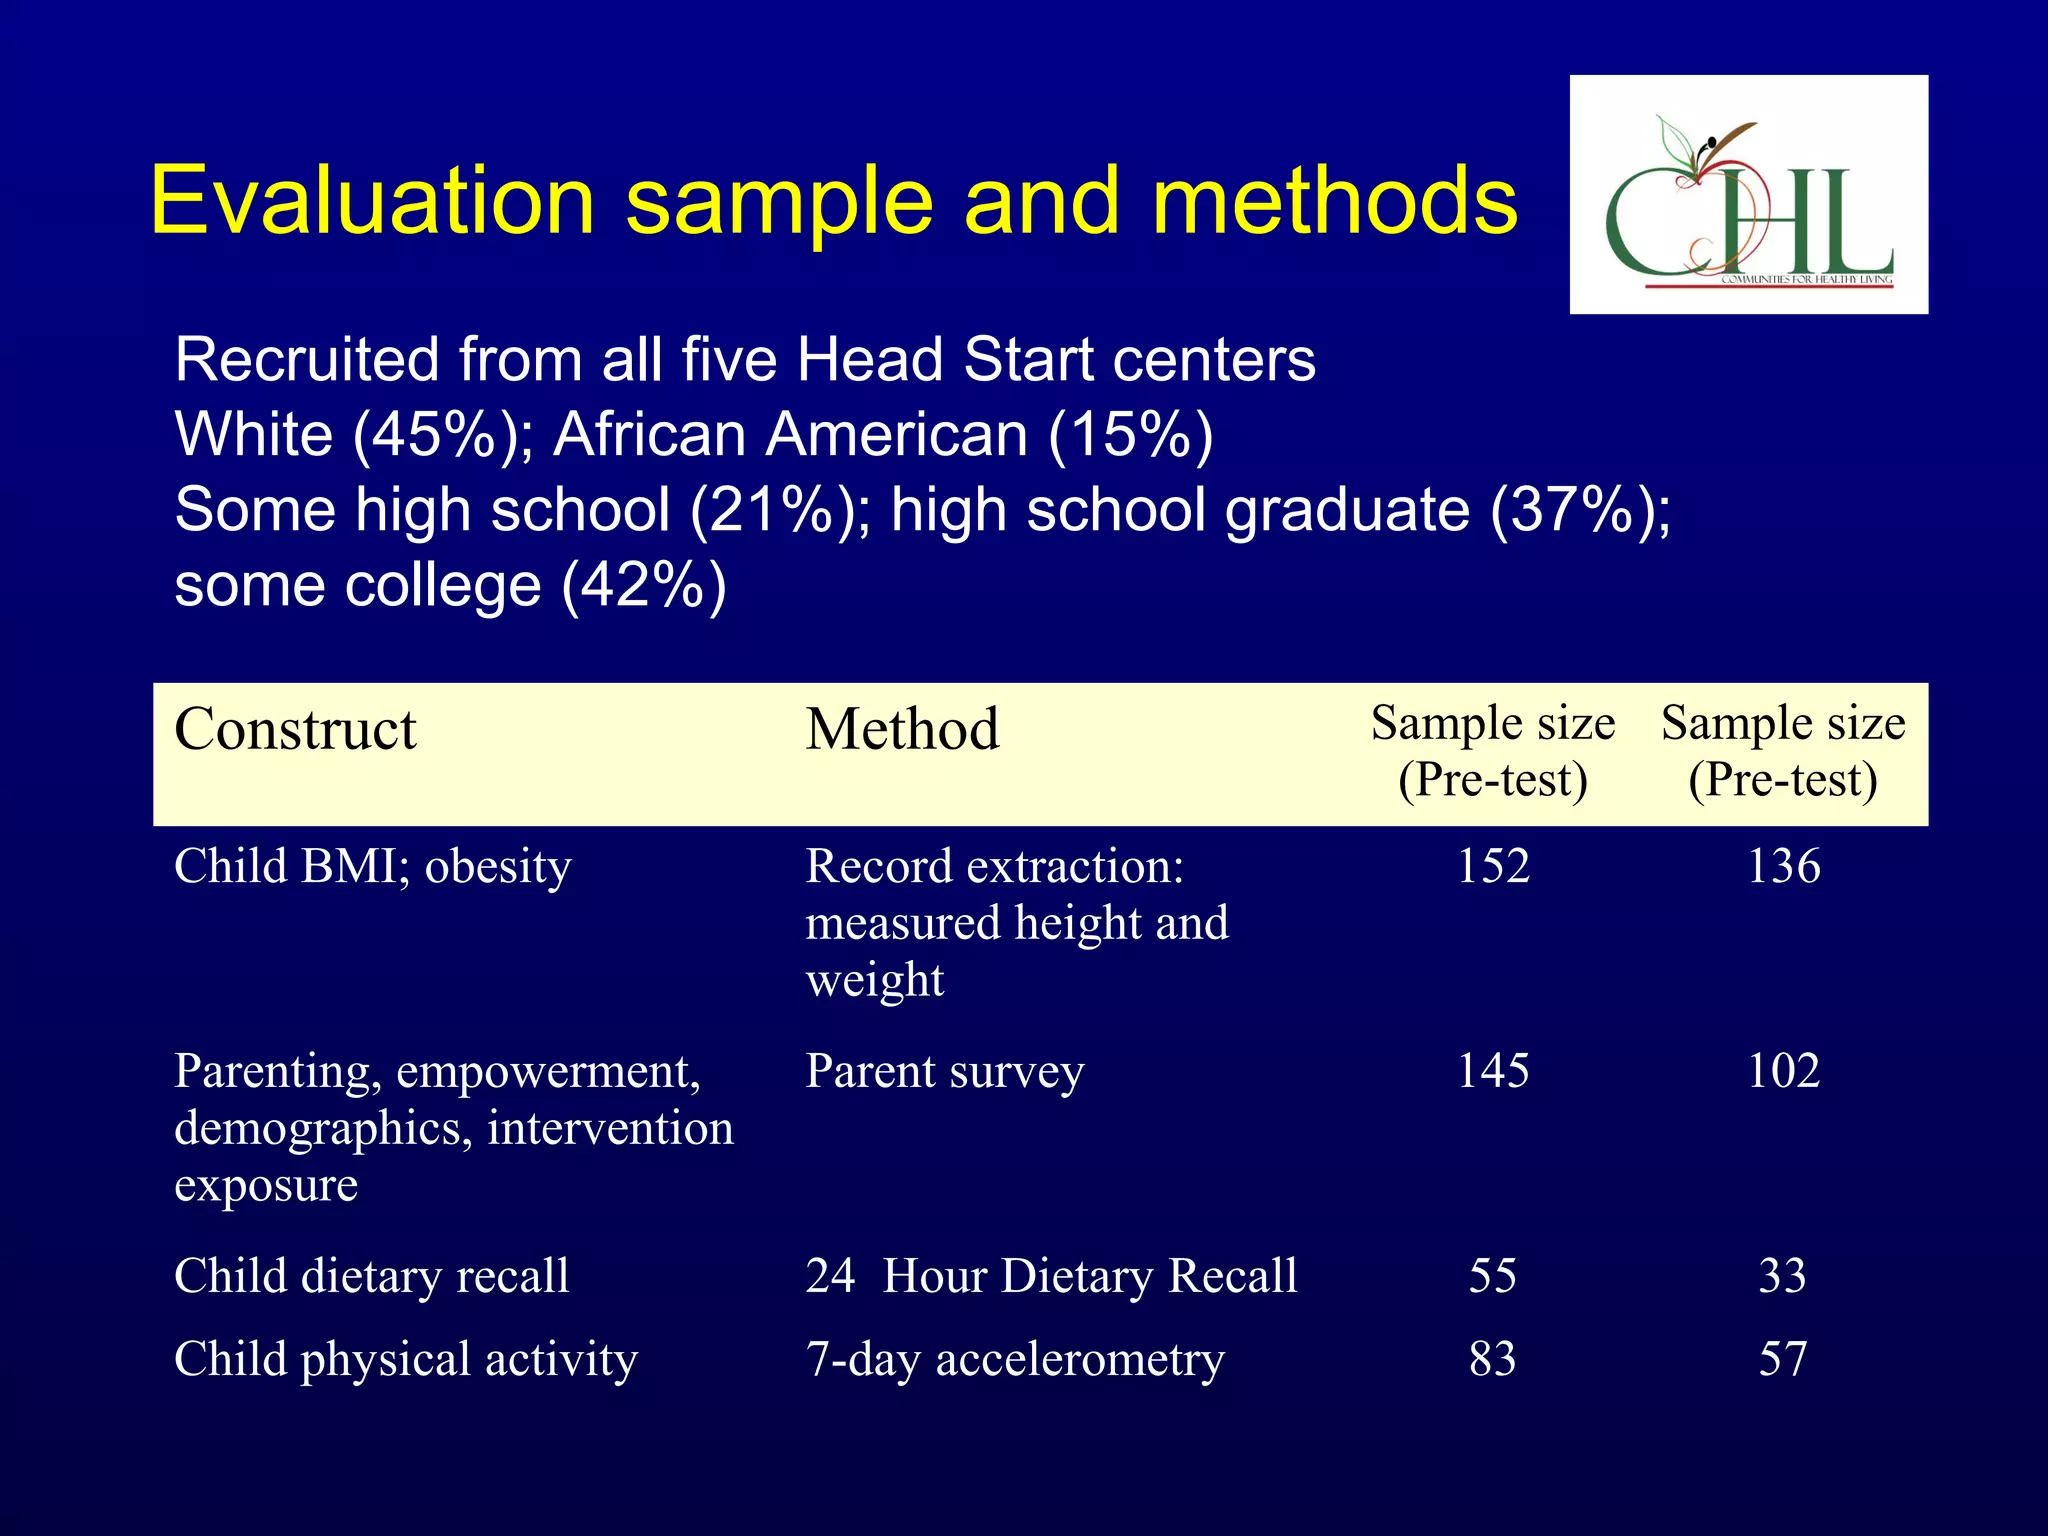
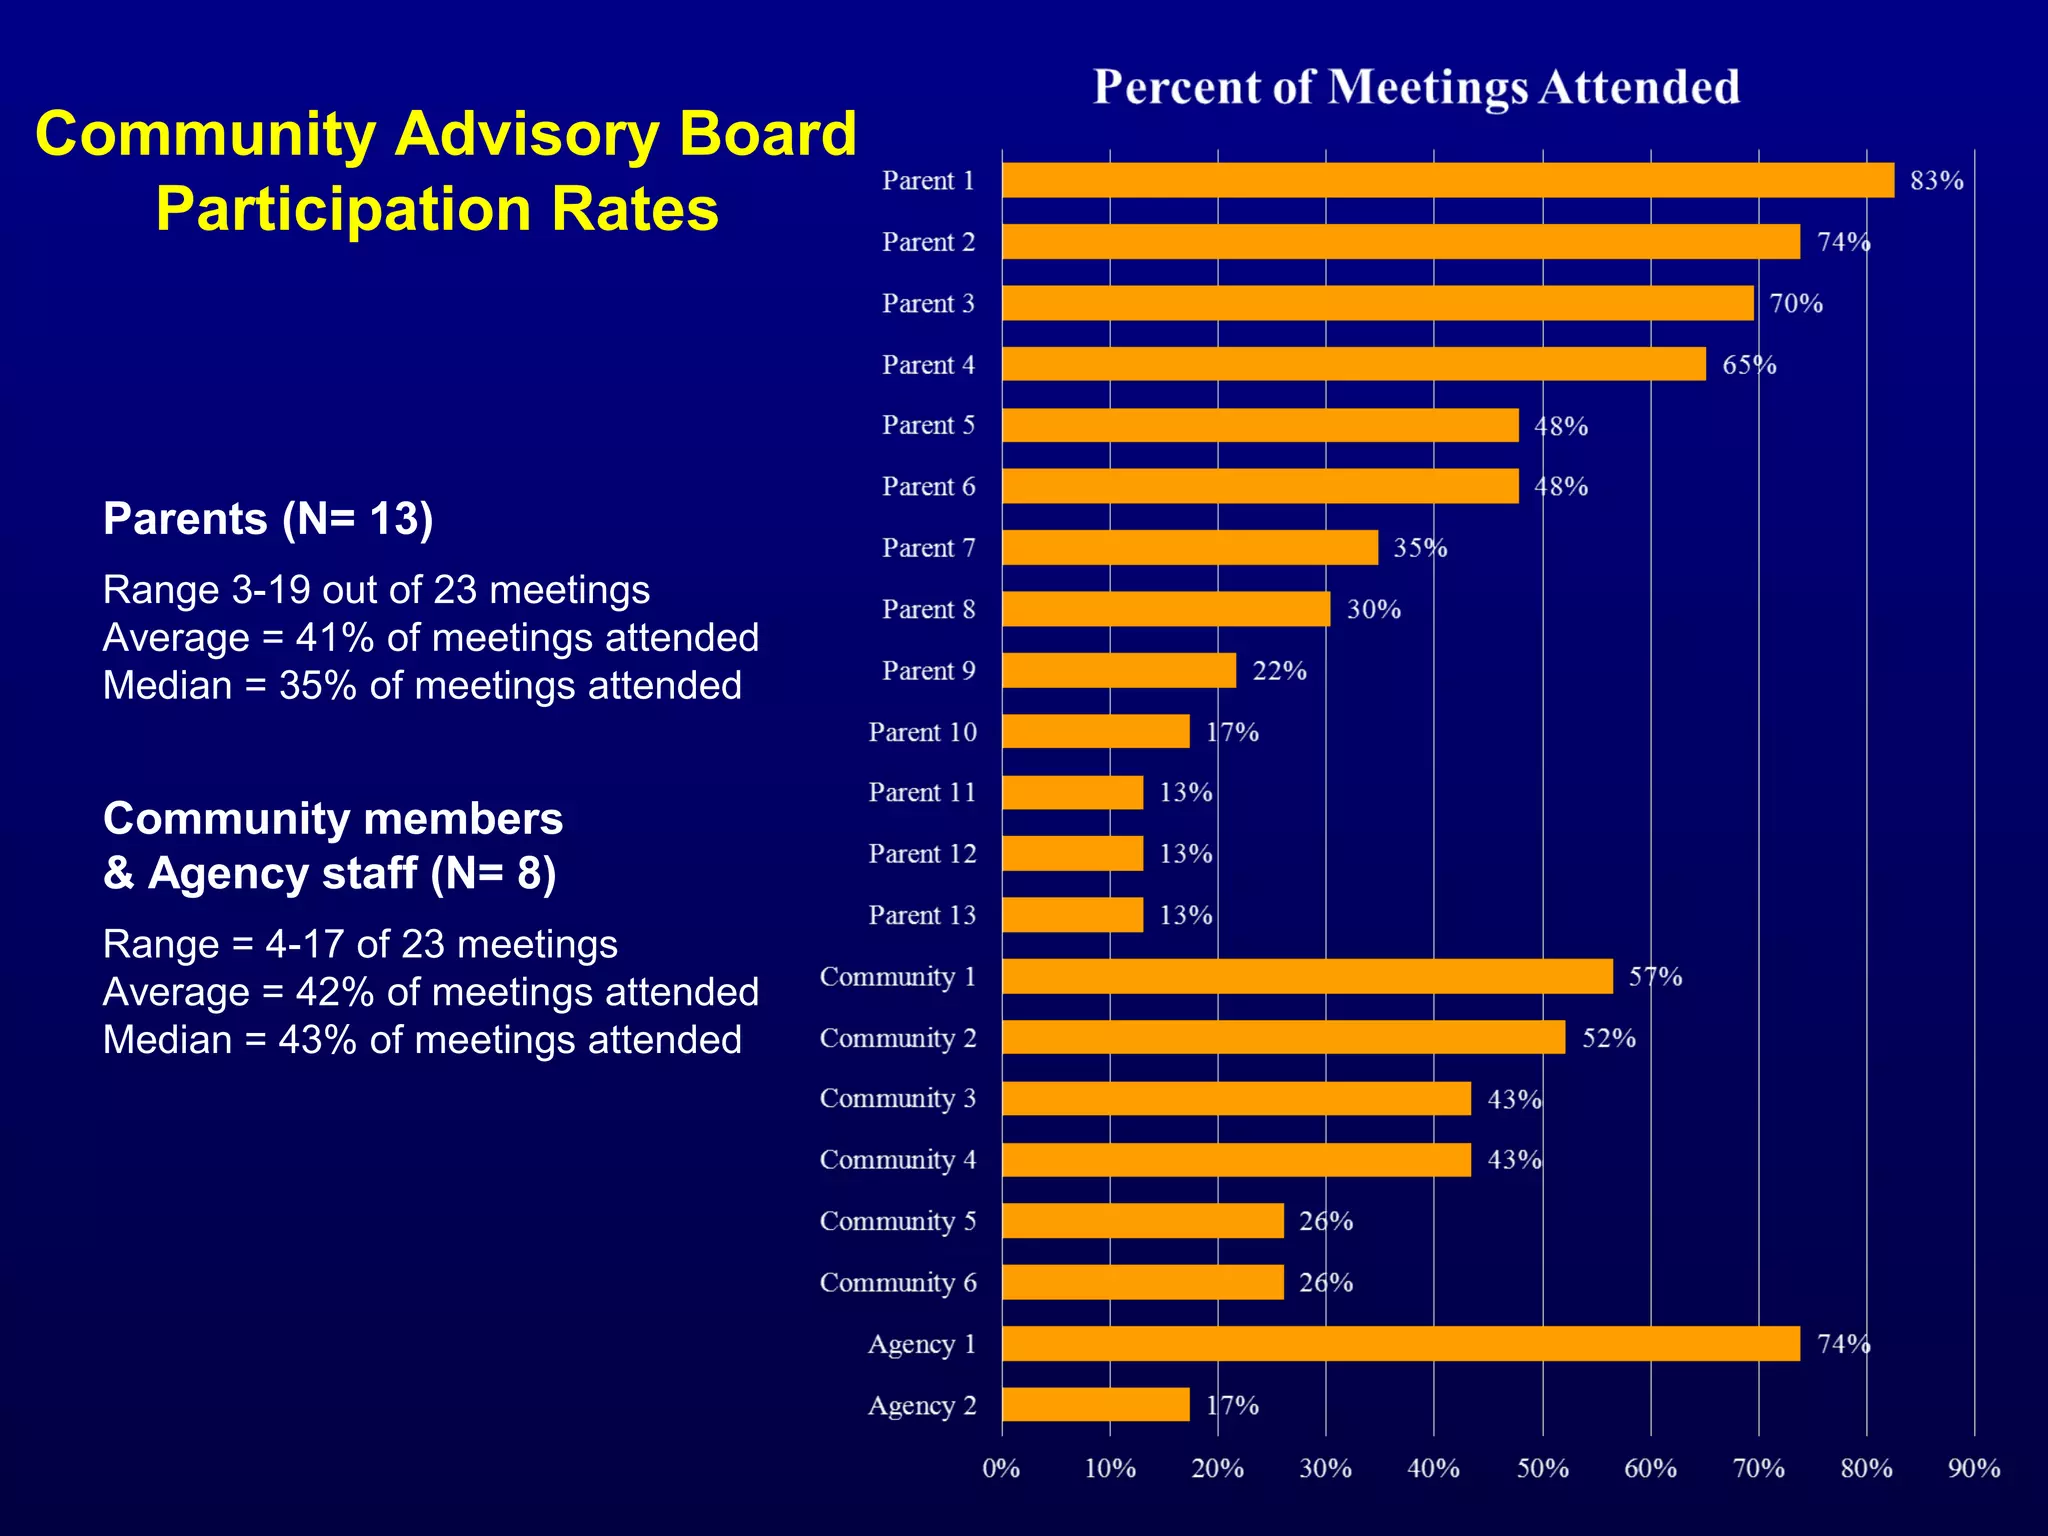
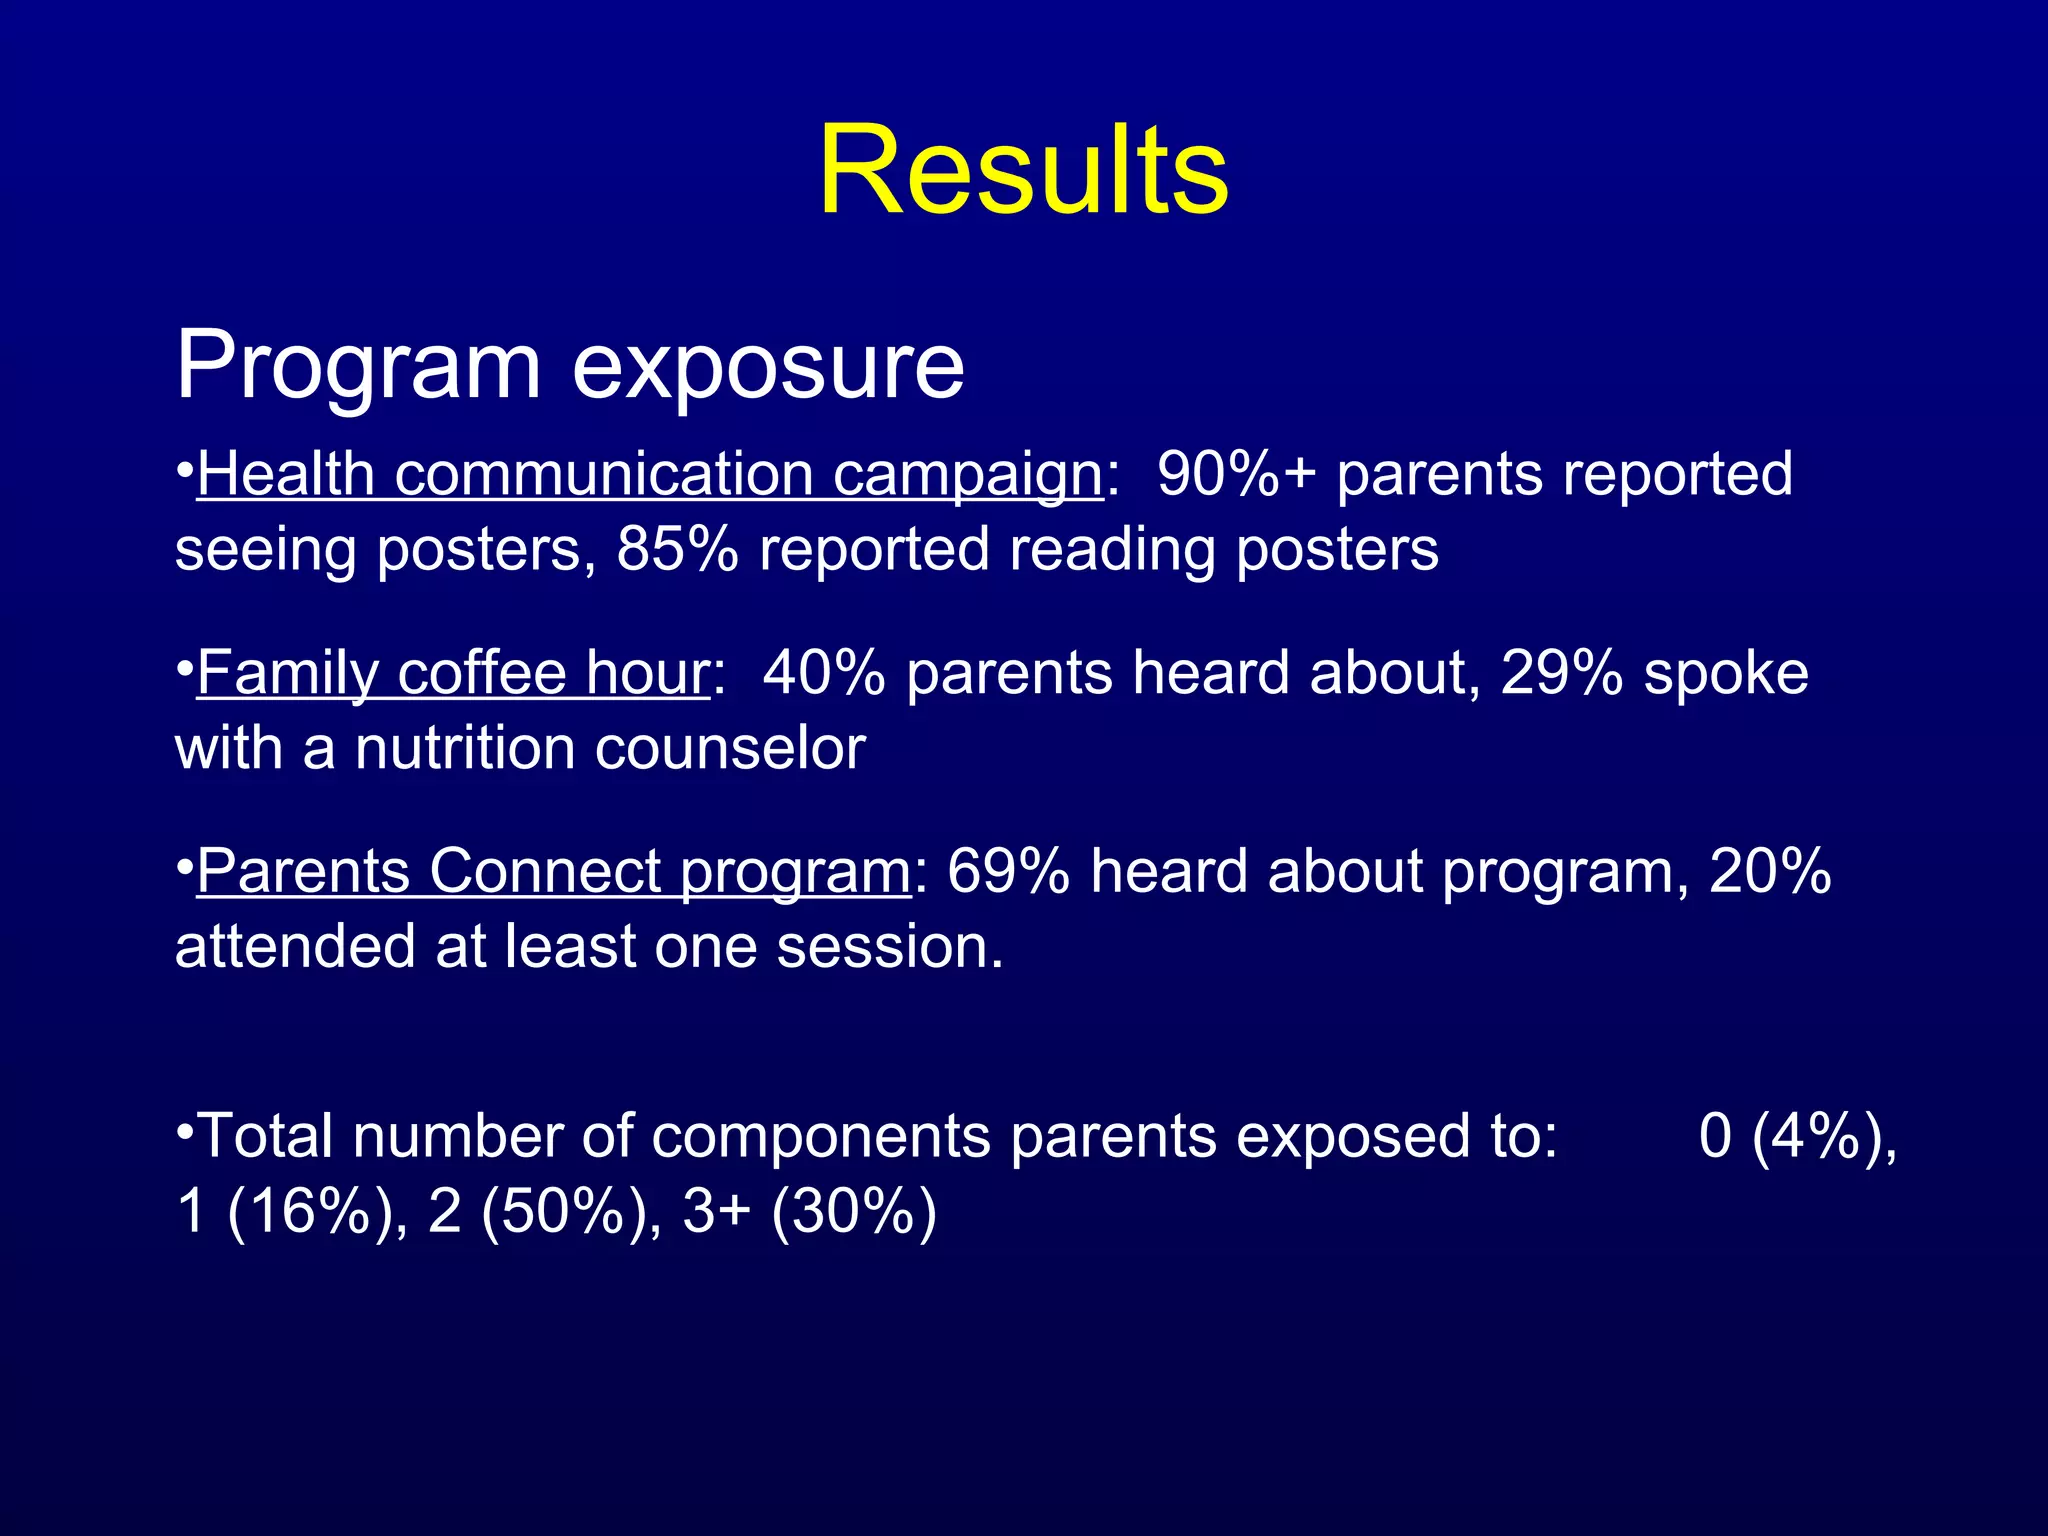
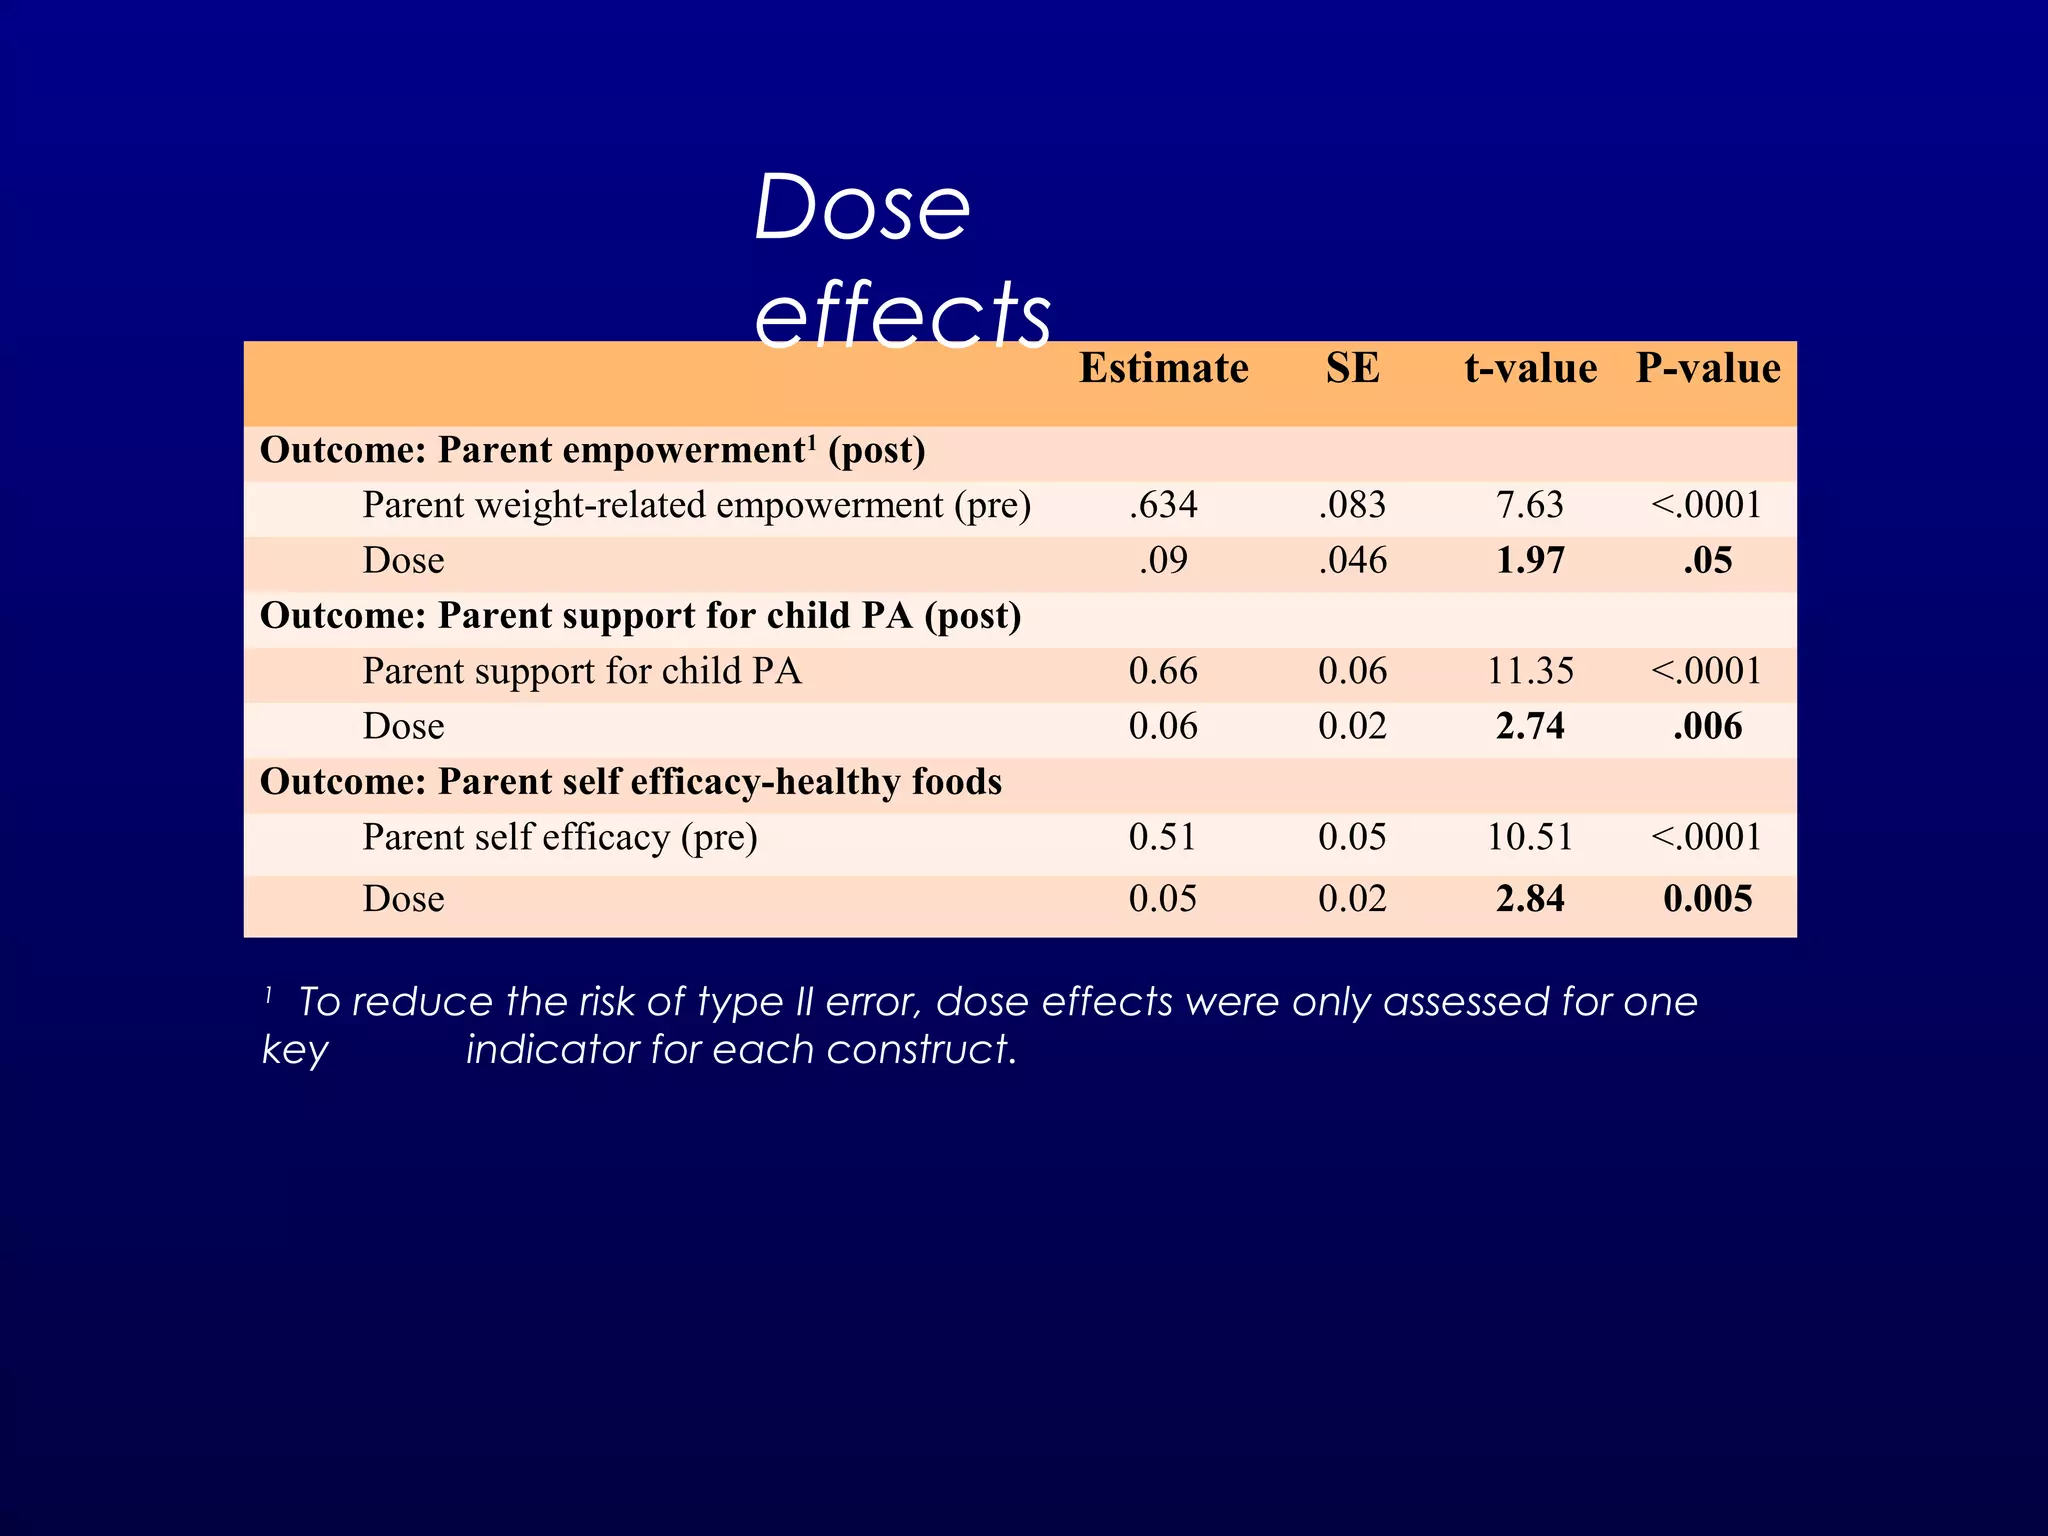
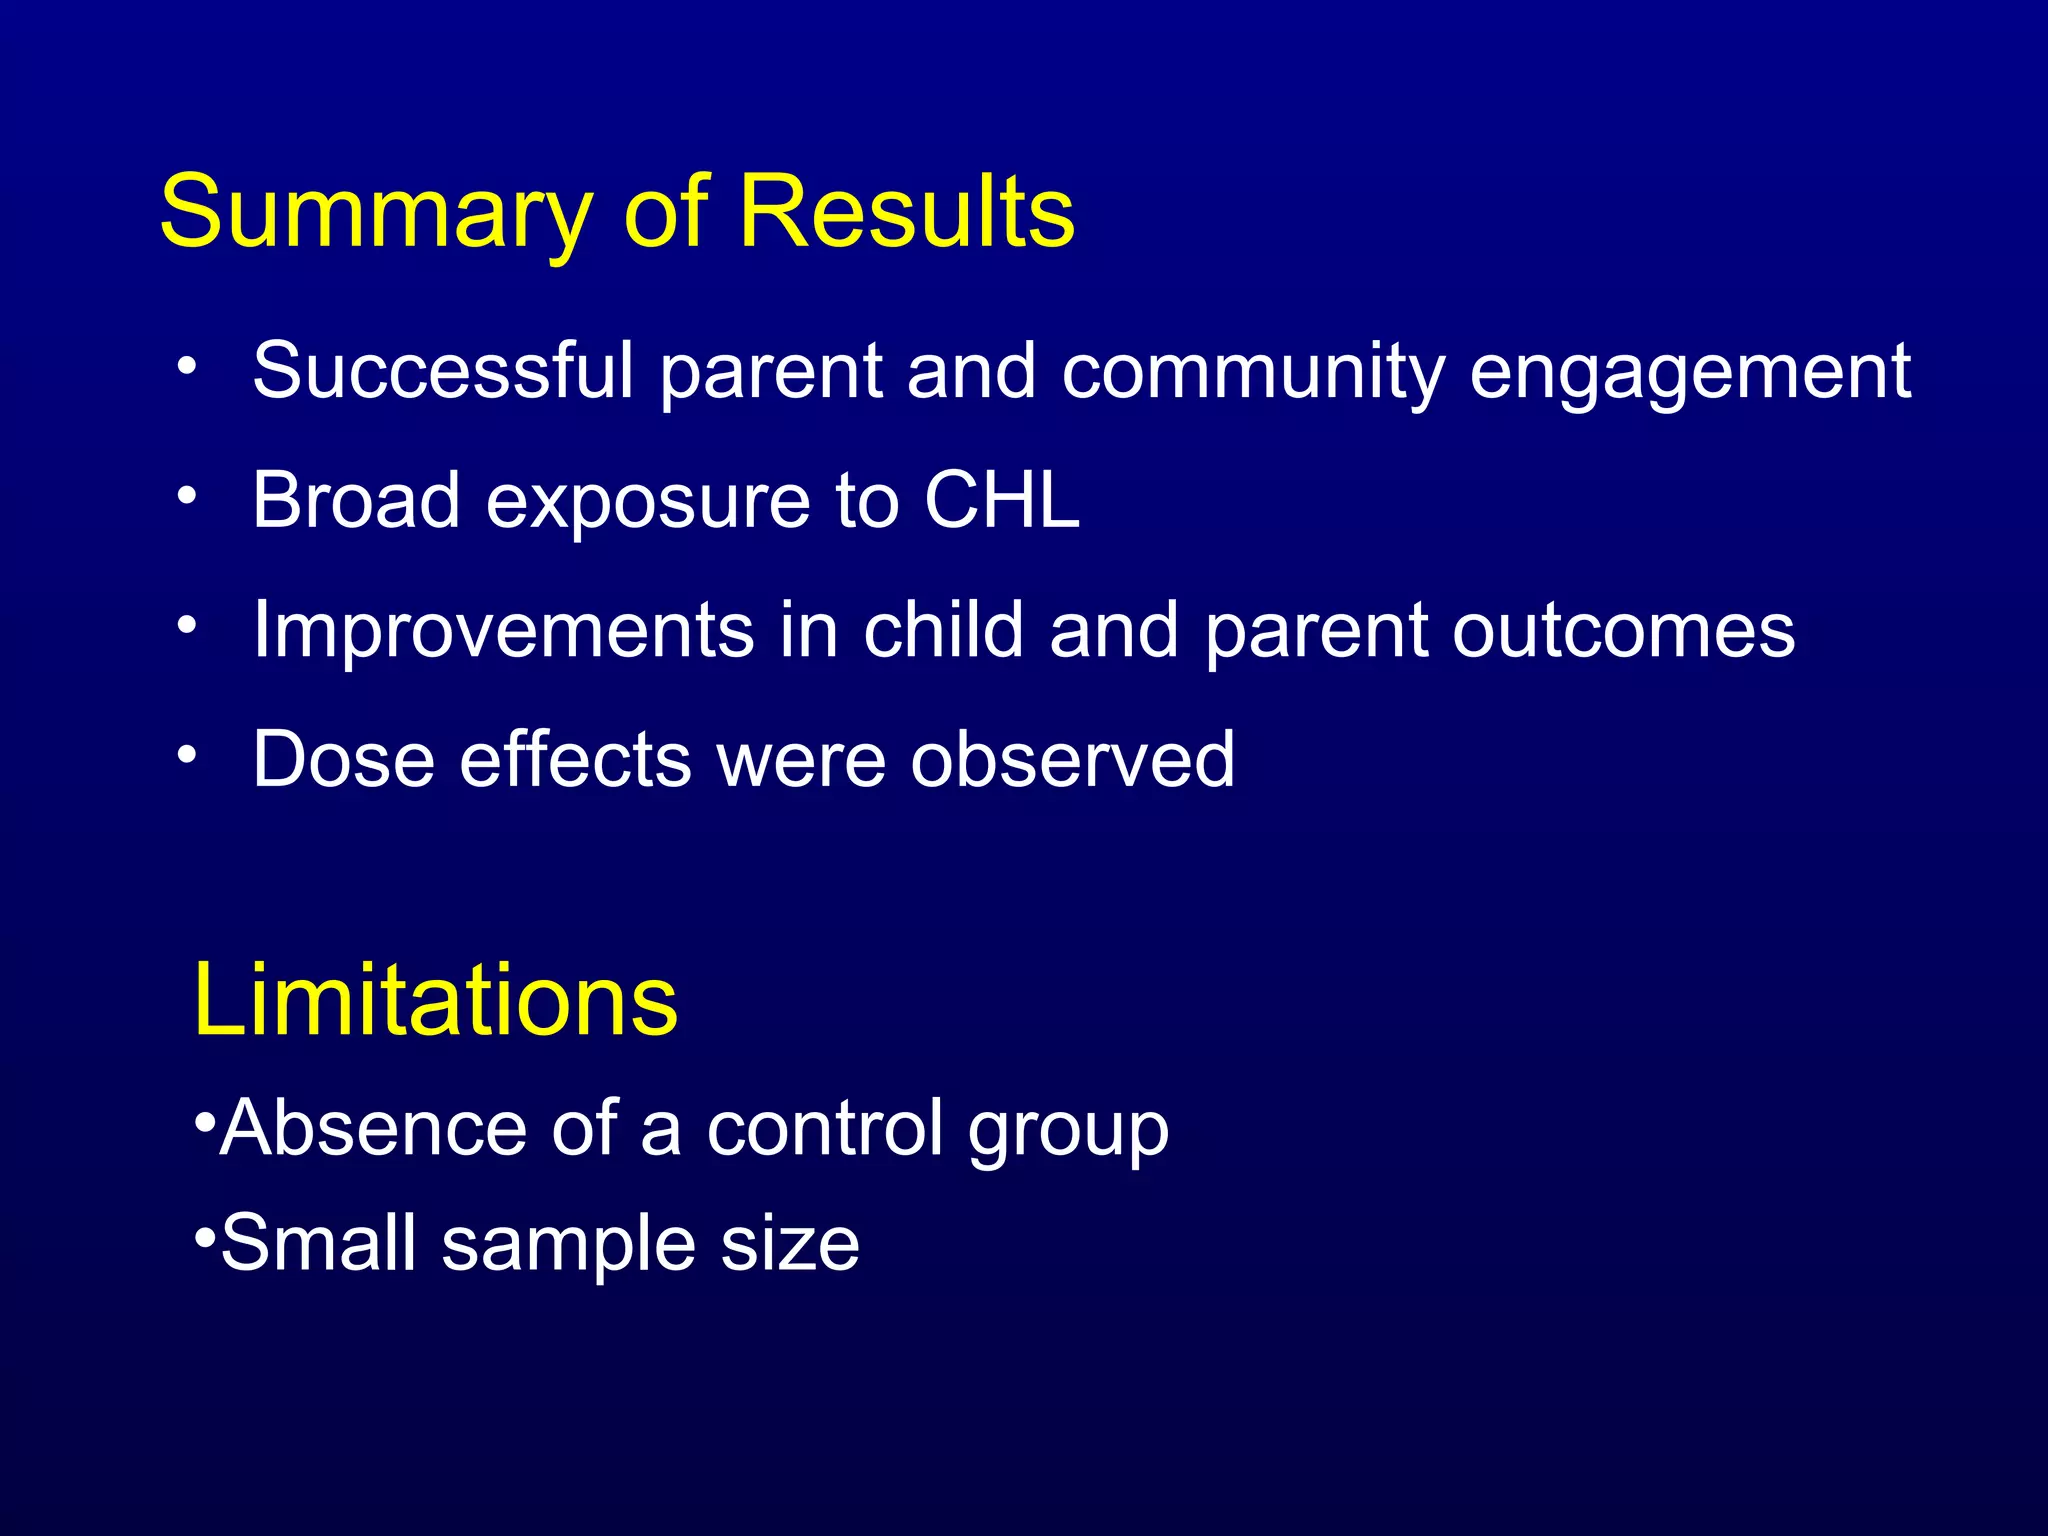
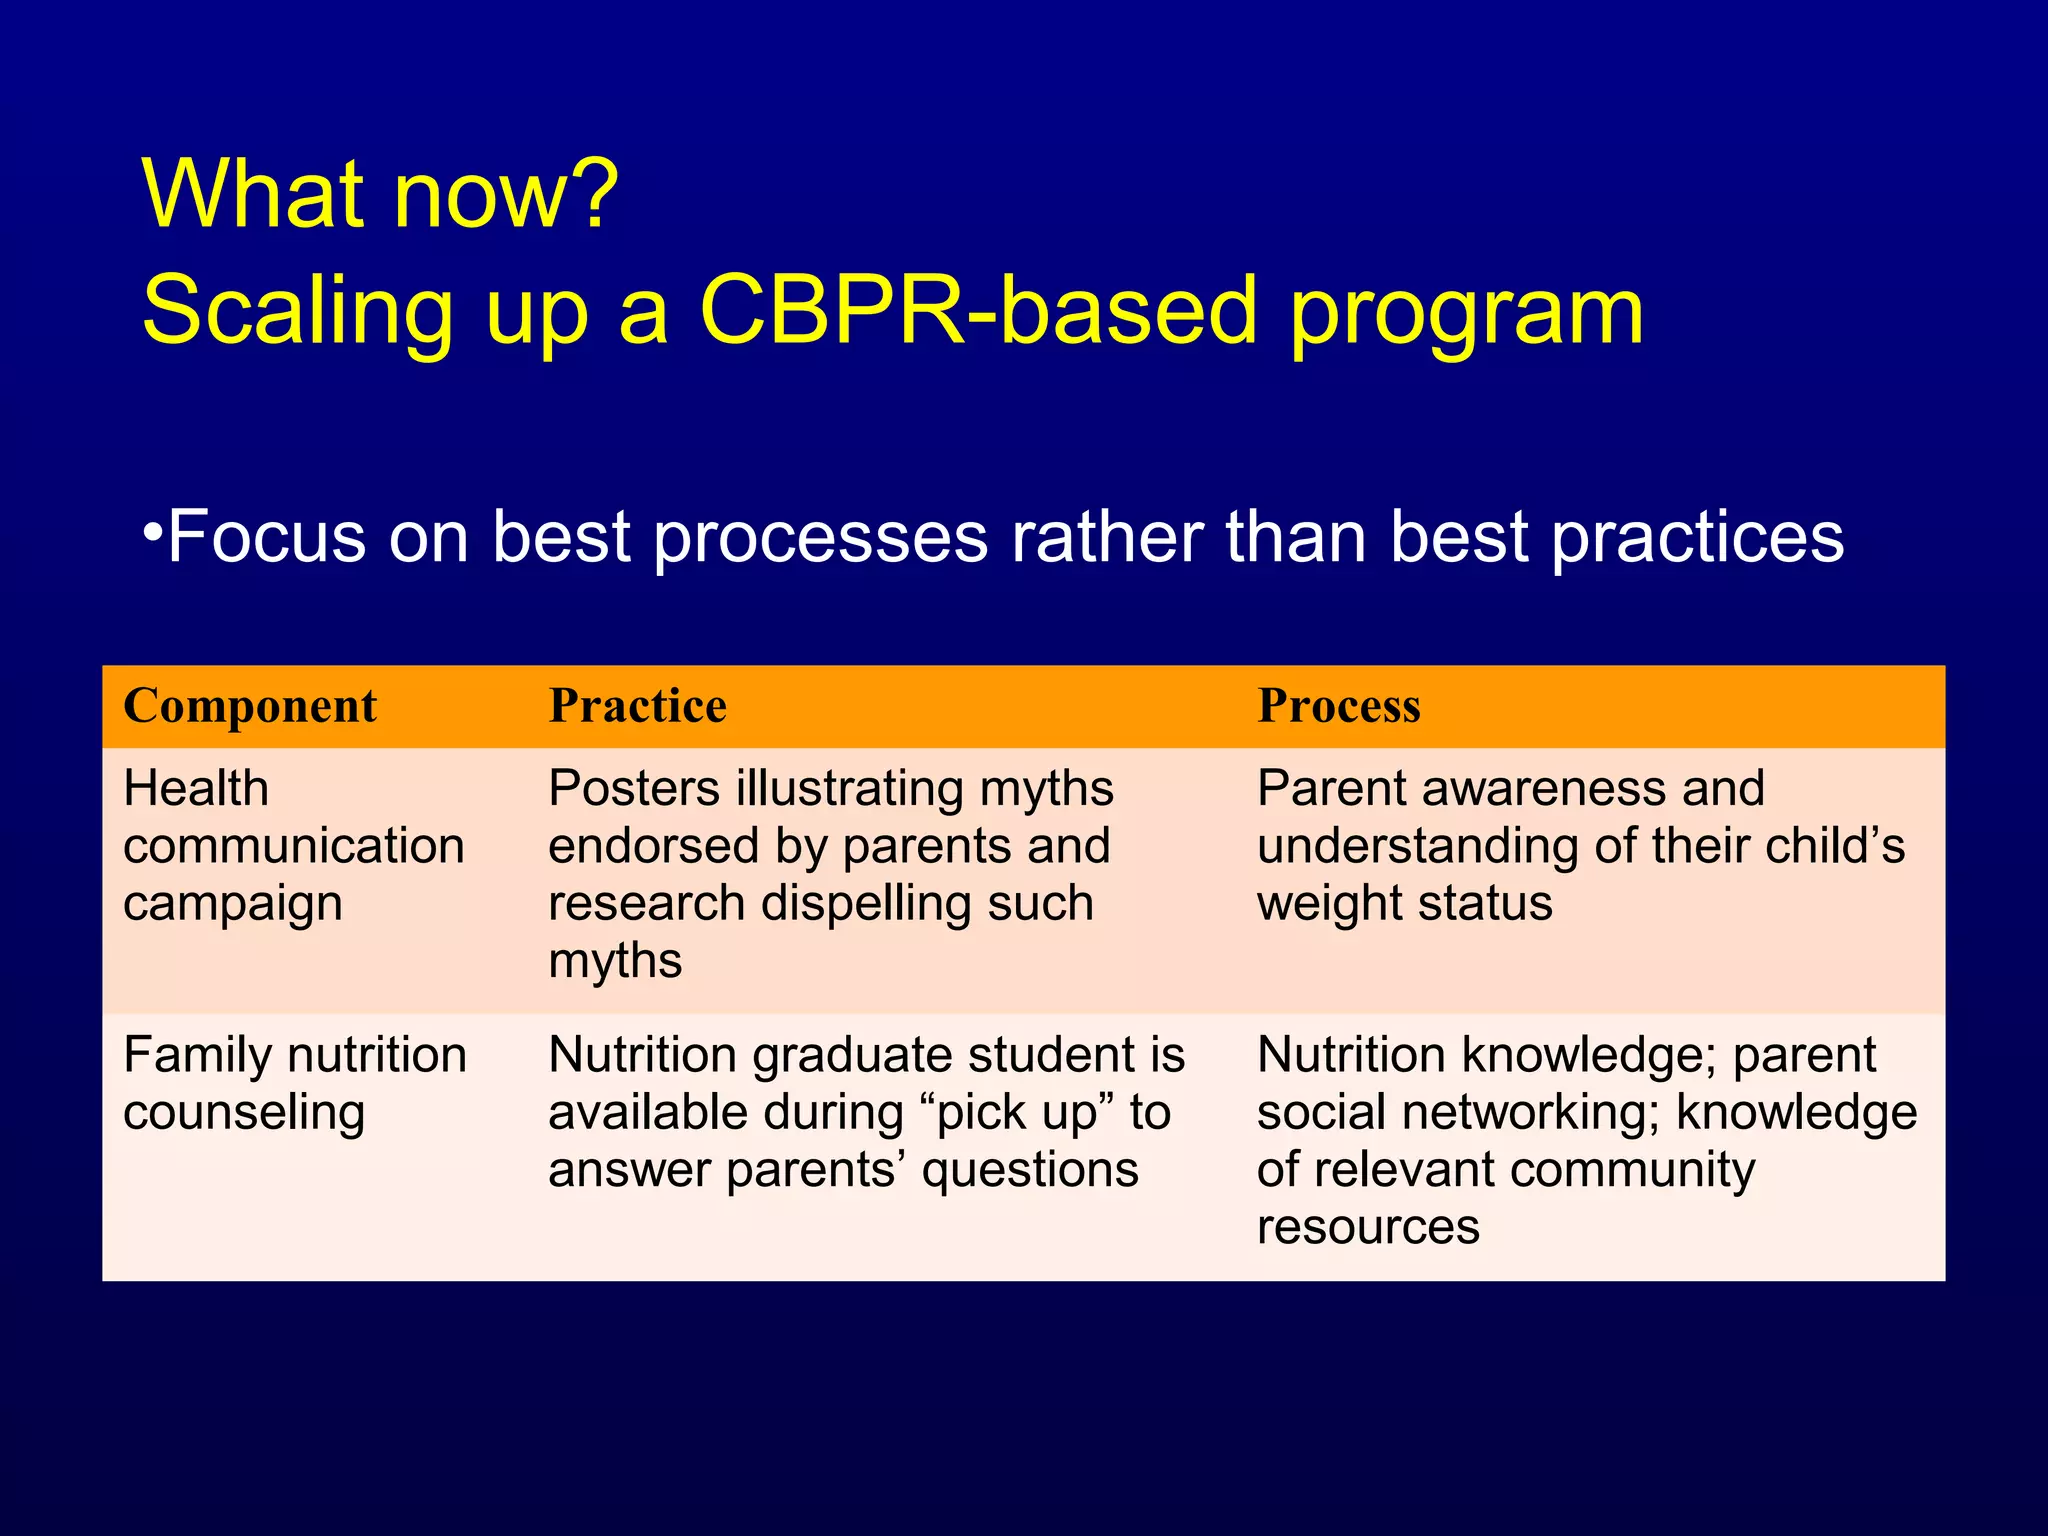


The document discusses a community-based participatory research project aimed at developing a family-centered obesity prevention program for children in Head Start, emphasizing the challenges of engaging families and aligning intervention priorities with their needs. Key findings reveal children's unhealthy lifestyles and parents' desires for advocacy and support, while multiple intervention components were piloted, showing improvements in child and parent outcomes. Limitations include a lack of a control group and a small sample size, with recommendations for scaling up the program and enhancing ecological validity in future research.


