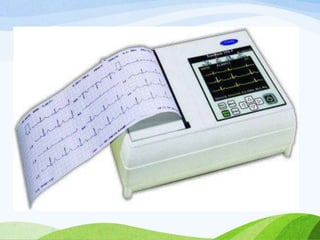
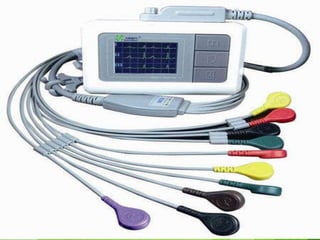
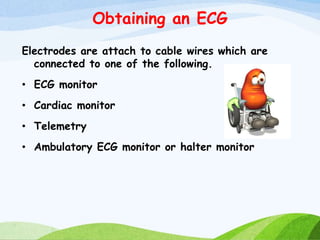
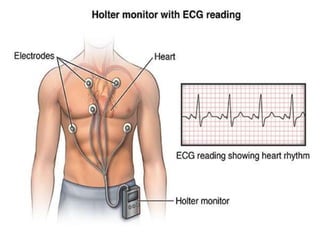
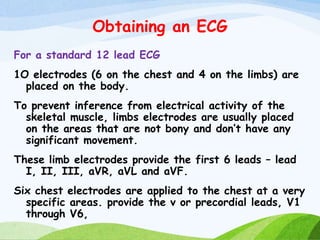
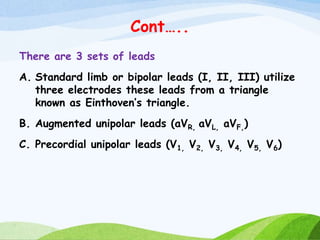
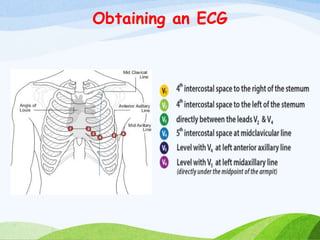
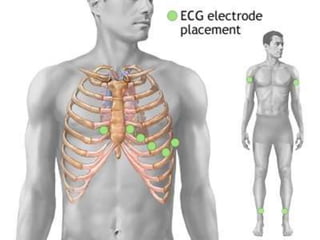
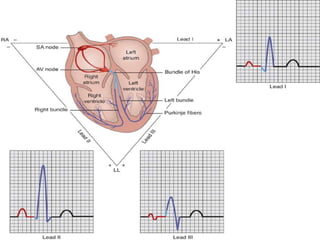
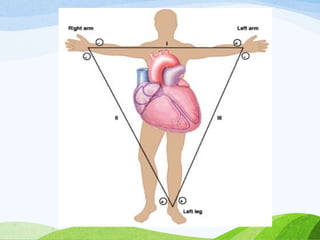
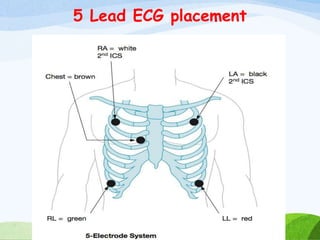
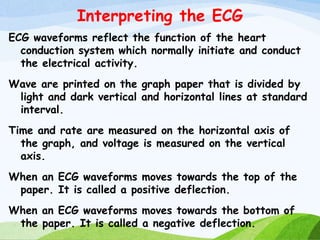
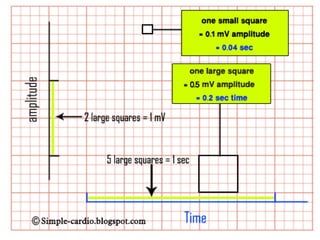
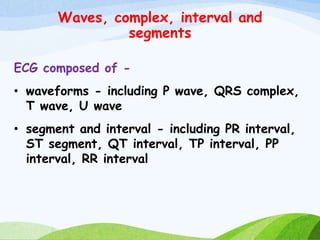
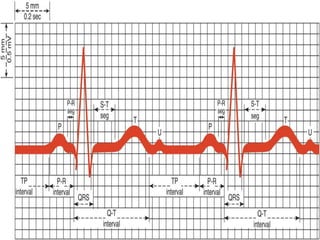
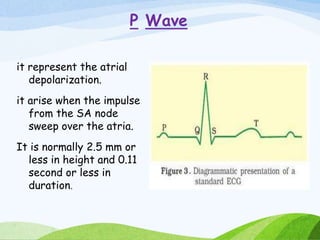
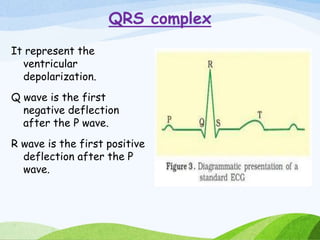
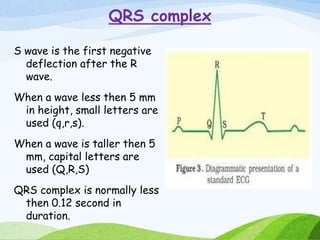
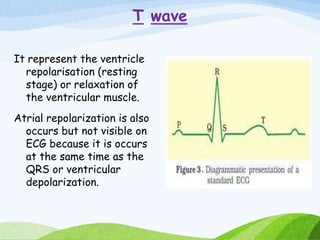
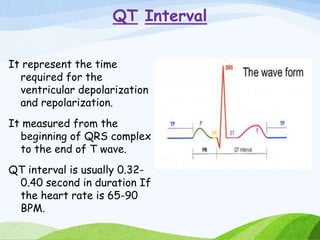
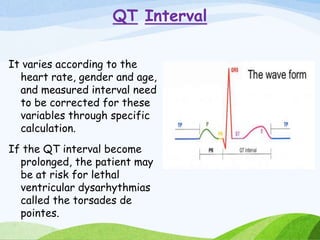
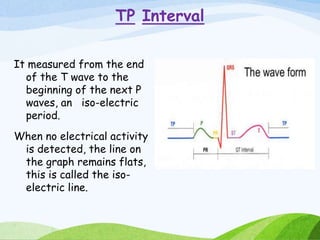
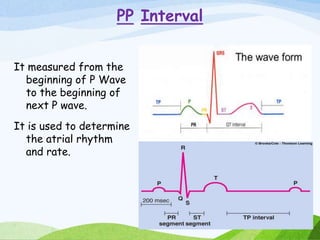
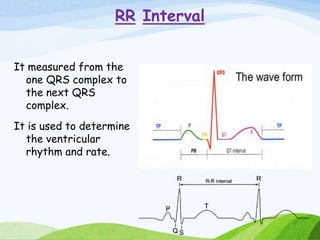
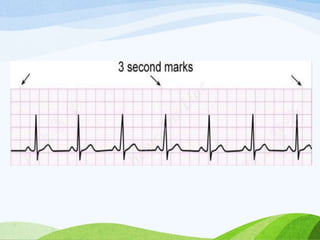
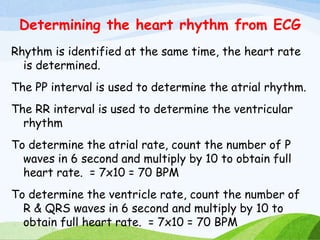
Practice
teaching
on
ECG
Interpretation
Presented by:
Ms. Hari singh nagar
M. Sc Nursing 1st year
Objectives
After completion of the class students will be able to
• Introduce the ECG interpretation.
• Define ECG interpretation.
• Explain about obtaining the ECG.
• Explain about the ECG interpretation.
 Explain about the waves. Complex, interval and
segments.
 Explain the strategies to determine the heart rate
from the ECG.
 Explain the strategies to determine the heart
rhythm from the ECG
Introduction
It is a process of recording the electrical
activity of the heart over a period of time
using the electrodes placed on the skin.
It is a test that checks the problems with the
electrical activity of the heart.
It show the electrical activity of the heart as
line tracing on the paper.
Waves - The spikes and dips in the tracing are
called the waves.
Definition
An electrocardiogram or ECG, records electrical activity
in the heart. An ECG machine records these
electrical signals across multiple heart beats and
produces an ECG strip that is interpreted by a
healthcare professional.
ECG also known as EKG.
Obtaining an ECG
Electrodes are attach to cable wires which are
connected to one of the following.
• ECG monitor
• Cardiac monitor
• Telemetry
• Ambulatory ECG monitor or halter monitor
Obtaining an ECG
For a standard 12 lead ECG
1O electrodes (6 on the chest and 4 on the limbs) are
placed on the body.
To prevent inference from electrical activity of the
skeletal muscle, limbs electrodes are usually placed
on the areas that are not bony and don’t have any
significant movement.
These limb electrodes provide the first 6 leads – lead
I, II, III, aVR, aVL and aVF.
Six chest electrodes are applied to the chest at a very
specific areas. provide the v or precordial leads, V1
through V6,
Cont…..
There are 3 sets of leads
A. Standard limb or bipolar leads (I, II, III) utilize
three electrodes these leads from a triangle
known as Einthoven’s triangle.
B. Augmented unipolar leads (aVR, aVL, aVF,)
C. Precordial unipolar leads (V1, V2, V3, V4, V5, V6)
Obtaining an ECG
5 Lead ECG placement
Interpreting the ECG
ECG waveforms reflect the function of the heart
conduction system which normally initiate and conduct
the electrical activity.
Wave are printed on the graph paper that is divided by
light and dark vertical and horizontal lines at standard
interval.
Time and rate are measured on the horizontal axis of
the graph, and voltage is measured on the vertical
axis.
When an ECG waveforms moves towards the top of the
paper. It is called a positive deflection.
When an ECG waveforms moves towards the bottom of
the paper. It is called a negative deflection.
Waves, complex, interval and
segments
ECG composed of -
• waveforms - including P wave, QRS complex,
T wave, U wave
• segment and interval - including PR interval,
ST segment, QT interval, TP interval, PP
interval, RR interval
P Wave
it represent the atrial
depolarization.
it arise when the impulse
from the SA node
sweep over the atria.
It is normally 2.5 mm or
less in height and 0.11
second or less in
duration.
QRS complex
It represent the
ventricular
depolarization.
Q wave is the first
negative deflection
after the P wave.
R wave is the first positive
deflection after the P
wave.
QRS complex
S wave is the first negative
deflection after the R
wave.
When a wave less then 5 mm
in height, small letters are
used (q,r,s).
When a wave is taller then 5
mm, capital letters are
used (Q,R,S)
QRS complex is normally less
then 0.12 second in
duration.
T wave
It represent the ventricle
repolarisation (resting
stage) or relaxation of
the ventricular muscle.
Atrial repolarization is also
occurs but not visible on
ECG because it is occurs
at the same time as the
QRS or ventricular
depolarization.
U wave
It represent the
repolarisation of the
purkinje fibres, but
sometime seen in patient
with hypokalemia, HTN,
heart disease.
If present, the U waves
follows the T wave and
usually smaller then the
P wave.
If tall, it may be mistaken
from an extra P wave.
PR Interval
It measured from beginning
of the P wave to the
beginning of QRS complex.
It represent the time
needed for sinus node
stimulation, Atrial
depolarization and
conduction through the
AV node before ventricle
depolarization.
The normal PR interval is
range from 0.12-.20
second in duration.
ST Segment
It measured from the
end of the QRS
complex to the
beginning of T wave.
It represent the early
ventricular
depolarization.
The beginning of T wave
identified by change in
the thickness at the
terminal portion of the
QRS complex.
ST Segment
The end of ST segment is
very difficult to
identify because it
merge into the T wave.
The ST segment is
normally iso-electric. It
is analyzed to identify
whether it is above or
below the iso-electric
line which may be sign
of cardiac ischemia.
QT Interval
It represent the time
required for the
ventricular depolarization
and repolarization.
It measured from the
beginning of QRS complex
to the end of T wave.
QT interval is usually 0.32-
0.40 second in duration If
the heart rate is 65-90
BPM.
QT Interval
It varies according to the
heart rate, gender and age,
and measured interval need
to be corrected for these
variables through specific
calculation.
If the QT interval become
prolonged, the patient may
be at risk for lethal
ventricular dysarhythmias
called the torsades de
pointes.
TP Interval
It measured from the end
of the T wave to the
beginning of the next P
waves, an iso-electric
period.
When no electrical activity
is detected, the line on
the graph remains flats,
this is called the iso-
electric line.
PP Interval
It measured from the
beginning of P Wave
to the beginning of
next P wave.
It is used to determine
the atrial rhythm
and rate.
RR Interval
It measured from the
one QRS complex to
the next QRS
complex.
It is used to determine
the ventricular
rhythm and rate.
Determining the heart rate from ECG
It can be obtained from the ECG strip by several
method.
1 minute strip contain 300 large boxes and 1500
small boxes.
An easy and accurate method to determine the
heart rate with a regular rhythm is to count
the number of small boxes within an RR interval
and divide 1500 by that number.
Example – 22 small boxes between the two “R”
waves. The heart rate is 1500/22 or 68 BPM.
Determining the heart rate from ECG
An alternative and less accurate ,method for
estimating heart rate, which is used when the
sinus rhythm is irregular, is to count the number
of RR interval in 6 seconds and multiply by the
10. = 6x10 = 60 BPM
The top of the paper is usually mark at 3 seconds
interval which is 15 large boxes horizontally, the
RR interval are counted rather then QRS
complexes.
Determining the heart rhythm from ECG
Rhythm is identified at the same time, the heart rate
is determined.
The PP interval is used to determine the atrial rhythm.
The RR interval is used to determine the ventricular
rhythm
To determine the atrial rate, count the number of P
waves in 6 second and multiply by 10 to obtain full
heart rate. = 7x10 = 70 BPM
To determine the ventricle rate, count the number of
R & QRS waves in 6 second and multiply by 10 to
obtain full heart rate. = 7x10 = 70 BPM
Determining the heart rhythm from ECG
If the interval are the same or if the difference
between the interval is less then the 0.8 second
throughout the strip, the rhythm is called
regular.
If the interval is different, the rhythm is called
the irregular.
Summary
An electrocardiogram or ECG, records electrical activity
in the heart. An ECG machine records these electrical
signals across multiple heart beats and produces an ECG
strip that is interpreted by a healthcare professional.
The following sub topics are –
1. How to obtain ECG
2. Interpreting the ECG
• Waves, complex, interval and segment - including P
Summary
wave, QRS complex, T wave, U wave, PR interval, ST
segment, QT interval, TP interval, PP interval, RR
interval
• Determining the heart rate from ECG
• Determining the heart rhythm from ECG
References
• “Brunner and suddarth’s” text book of medical
surgical nursing, Twelth edition, Wolters
publication, Page no. 721-725
• “Saunders” comprehensive review for the NCLEX
RN examination, fifth edition, elsevier publication,
page n0. 795-798
• “Lippin cott wiliams and wilkins” manual nursing
practice. 8th edition, lippin cott raven publishers,
page no- 333 -335

Ecg interpretations

  • 1.
  • 2.
    Objectives After completion ofthe class students will be able to • Introduce the ECG interpretation. • Define ECG interpretation. • Explain about obtaining the ECG. • Explain about the ECG interpretation.  Explain about the waves. Complex, interval and segments.  Explain the strategies to determine the heart rate from the ECG.  Explain the strategies to determine the heart rhythm from the ECG
  • 3.
    Introduction It is aprocess of recording the electrical activity of the heart over a period of time using the electrodes placed on the skin. It is a test that checks the problems with the electrical activity of the heart. It show the electrical activity of the heart as line tracing on the paper. Waves - The spikes and dips in the tracing are called the waves.
  • 4.
    Definition An electrocardiogram orECG, records electrical activity in the heart. An ECG machine records these electrical signals across multiple heart beats and produces an ECG strip that is interpreted by a healthcare professional. ECG also known as EKG.
  • 7.
    Obtaining an ECG Electrodesare attach to cable wires which are connected to one of the following. • ECG monitor • Cardiac monitor • Telemetry • Ambulatory ECG monitor or halter monitor
  • 10.
    Obtaining an ECG Fora standard 12 lead ECG 1O electrodes (6 on the chest and 4 on the limbs) are placed on the body. To prevent inference from electrical activity of the skeletal muscle, limbs electrodes are usually placed on the areas that are not bony and don’t have any significant movement. These limb electrodes provide the first 6 leads – lead I, II, III, aVR, aVL and aVF. Six chest electrodes are applied to the chest at a very specific areas. provide the v or precordial leads, V1 through V6,
  • 11.
    Cont….. There are 3sets of leads A. Standard limb or bipolar leads (I, II, III) utilize three electrodes these leads from a triangle known as Einthoven’s triangle. B. Augmented unipolar leads (aVR, aVL, aVF,) C. Precordial unipolar leads (V1, V2, V3, V4, V5, V6)
  • 12.
  • 17.
    5 Lead ECGplacement
  • 18.
    Interpreting the ECG ECGwaveforms reflect the function of the heart conduction system which normally initiate and conduct the electrical activity. Wave are printed on the graph paper that is divided by light and dark vertical and horizontal lines at standard interval. Time and rate are measured on the horizontal axis of the graph, and voltage is measured on the vertical axis. When an ECG waveforms moves towards the top of the paper. It is called a positive deflection. When an ECG waveforms moves towards the bottom of the paper. It is called a negative deflection.
  • 21.
    Waves, complex, intervaland segments ECG composed of - • waveforms - including P wave, QRS complex, T wave, U wave • segment and interval - including PR interval, ST segment, QT interval, TP interval, PP interval, RR interval
  • 24.
    P Wave it representthe atrial depolarization. it arise when the impulse from the SA node sweep over the atria. It is normally 2.5 mm or less in height and 0.11 second or less in duration.
  • 25.
    QRS complex It representthe ventricular depolarization. Q wave is the first negative deflection after the P wave. R wave is the first positive deflection after the P wave.
  • 26.
    QRS complex S waveis the first negative deflection after the R wave. When a wave less then 5 mm in height, small letters are used (q,r,s). When a wave is taller then 5 mm, capital letters are used (Q,R,S) QRS complex is normally less then 0.12 second in duration.
  • 27.
    T wave It representthe ventricle repolarisation (resting stage) or relaxation of the ventricular muscle. Atrial repolarization is also occurs but not visible on ECG because it is occurs at the same time as the QRS or ventricular depolarization.
  • 28.
    U wave It representthe repolarisation of the purkinje fibres, but sometime seen in patient with hypokalemia, HTN, heart disease. If present, the U waves follows the T wave and usually smaller then the P wave. If tall, it may be mistaken from an extra P wave.
  • 29.
    PR Interval It measuredfrom beginning of the P wave to the beginning of QRS complex. It represent the time needed for sinus node stimulation, Atrial depolarization and conduction through the AV node before ventricle depolarization. The normal PR interval is range from 0.12-.20 second in duration.
  • 30.
    ST Segment It measuredfrom the end of the QRS complex to the beginning of T wave. It represent the early ventricular depolarization. The beginning of T wave identified by change in the thickness at the terminal portion of the QRS complex.
  • 31.
    ST Segment The endof ST segment is very difficult to identify because it merge into the T wave. The ST segment is normally iso-electric. It is analyzed to identify whether it is above or below the iso-electric line which may be sign of cardiac ischemia.
  • 32.
    QT Interval It representthe time required for the ventricular depolarization and repolarization. It measured from the beginning of QRS complex to the end of T wave. QT interval is usually 0.32- 0.40 second in duration If the heart rate is 65-90 BPM.
  • 33.
    QT Interval It variesaccording to the heart rate, gender and age, and measured interval need to be corrected for these variables through specific calculation. If the QT interval become prolonged, the patient may be at risk for lethal ventricular dysarhythmias called the torsades de pointes.
  • 34.
    TP Interval It measuredfrom the end of the T wave to the beginning of the next P waves, an iso-electric period. When no electrical activity is detected, the line on the graph remains flats, this is called the iso- electric line.
  • 35.
    PP Interval It measuredfrom the beginning of P Wave to the beginning of next P wave. It is used to determine the atrial rhythm and rate.
  • 36.
    RR Interval It measuredfrom the one QRS complex to the next QRS complex. It is used to determine the ventricular rhythm and rate.
  • 37.
    Determining the heartrate from ECG It can be obtained from the ECG strip by several method. 1 minute strip contain 300 large boxes and 1500 small boxes. An easy and accurate method to determine the heart rate with a regular rhythm is to count the number of small boxes within an RR interval and divide 1500 by that number. Example – 22 small boxes between the two “R” waves. The heart rate is 1500/22 or 68 BPM.
  • 38.
    Determining the heartrate from ECG An alternative and less accurate ,method for estimating heart rate, which is used when the sinus rhythm is irregular, is to count the number of RR interval in 6 seconds and multiply by the 10. = 6x10 = 60 BPM The top of the paper is usually mark at 3 seconds interval which is 15 large boxes horizontally, the RR interval are counted rather then QRS complexes.
  • 40.
    Determining the heartrhythm from ECG Rhythm is identified at the same time, the heart rate is determined. The PP interval is used to determine the atrial rhythm. The RR interval is used to determine the ventricular rhythm To determine the atrial rate, count the number of P waves in 6 second and multiply by 10 to obtain full heart rate. = 7x10 = 70 BPM To determine the ventricle rate, count the number of R & QRS waves in 6 second and multiply by 10 to obtain full heart rate. = 7x10 = 70 BPM
  • 41.
    Determining the heartrhythm from ECG If the interval are the same or if the difference between the interval is less then the 0.8 second throughout the strip, the rhythm is called regular. If the interval is different, the rhythm is called the irregular.
  • 42.
    Summary An electrocardiogram orECG, records electrical activity in the heart. An ECG machine records these electrical signals across multiple heart beats and produces an ECG strip that is interpreted by a healthcare professional. The following sub topics are – 1. How to obtain ECG 2. Interpreting the ECG • Waves, complex, interval and segment - including P
  • 43.
    Summary wave, QRS complex,T wave, U wave, PR interval, ST segment, QT interval, TP interval, PP interval, RR interval • Determining the heart rate from ECG • Determining the heart rhythm from ECG
  • 44.
    References • “Brunner andsuddarth’s” text book of medical surgical nursing, Twelth edition, Wolters publication, Page no. 721-725 • “Saunders” comprehensive review for the NCLEX RN examination, fifth edition, elsevier publication, page n0. 795-798 • “Lippin cott wiliams and wilkins” manual nursing practice. 8th edition, lippin cott raven publishers, page no- 333 -335