WHAT IS ECG
Dignostic tool that records electrical activity of heart.
3.
TYPES OF ECG
1.12 Lead ECG :standard assessment tool that records the heart's
electrical activity from 12 different views of the heart and
provides a complete picture of electrical activity.
2. Rhythm strip :
records the heart's electrical activity from a single lead.
It's used to monitor a patient's heart rate and rhythm over a short
period of time.
A standard rhythm strip is 10 seconds long and is usually recorded
from lead II on a 12-lead ECG.
4.
Types of leads
LIMBLEADS
Standard limb leads
Lead I, II and III require a positive and negative electrode and are
hence called bipolar leads.
Augmented limb leads
aVR, aVF, aVL are augmented unipolar leads as they require only
positive electrode.
In these leads the small waveforms are enhanced or augmented.
The letter a stands for augmented and the letters R,L,F stands for
positive electrode position of lead.
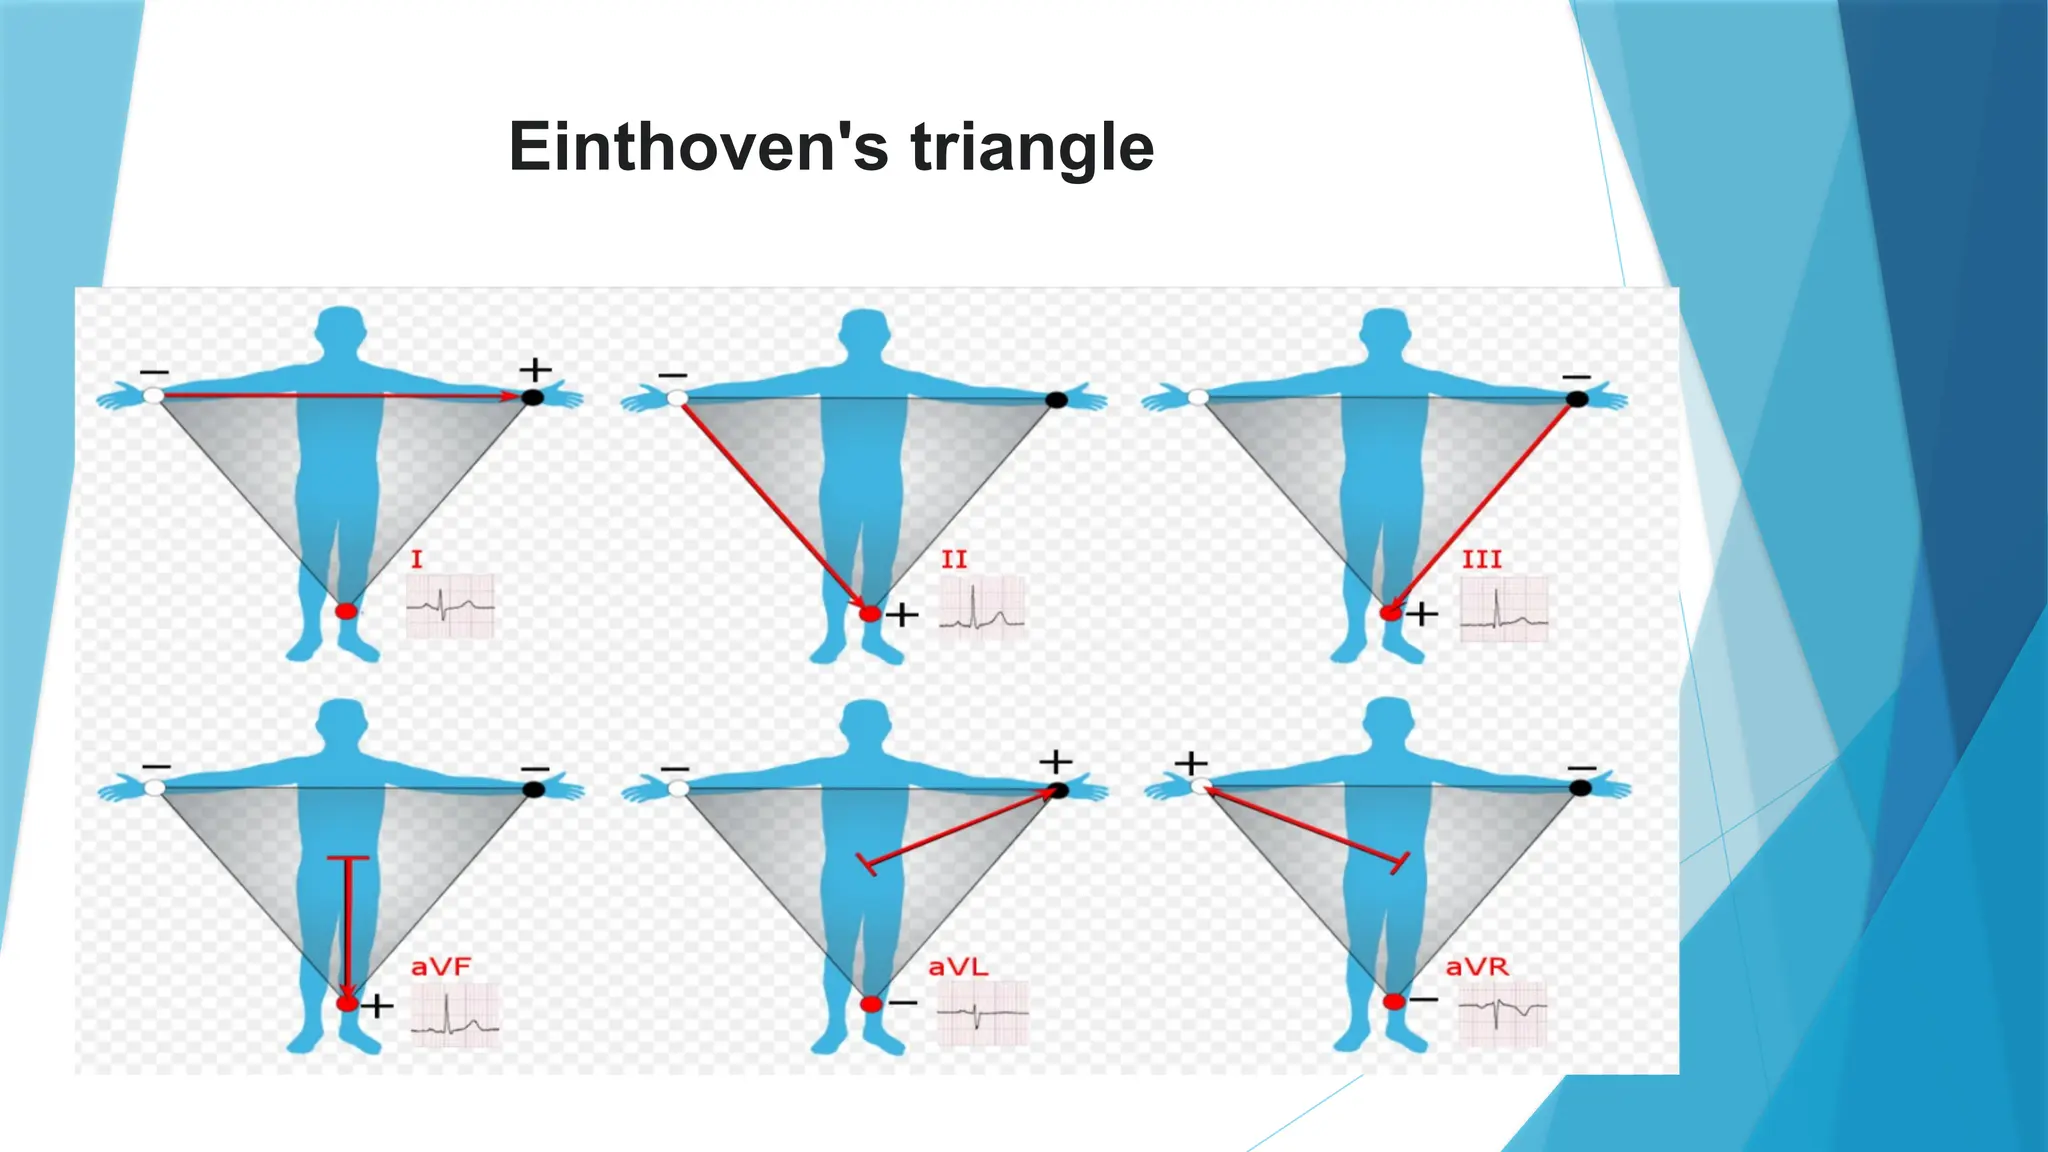
Electrodes placement is referred to as Einthoven’s triangle.
Einthoven's triangleis an imaginary formation of three limb leads in a triangle .The
shape forms an inverted equilateral triangle with the heart at the center. It is named
after Willem Einthoven, who theorized its existence.
Lead placements
Lead I — This axis goes from shoulder to shoulder, with the negative electrode placed
on the right shoulder and the positive electrode placed on the left shoulder. This results
in a 0-degree angle of orientation
I = LA-RA
Lead II — This axis goes from the right arm to the left leg, with the negative electrode on
the shoulder and the positive one on the leg. This results in a +60 degree angle of
orientation.
II = LL-RA
Lead III — This axis goes from the left shoulder (negative electrode) to the right or left
leg (positive electrode). This results in a + 120 degree angle of orientation.
III =LL-LA
7.
Chest orprecordial leads
V1, V2, V3, V4, V5 and V6 are unipolar leads as only positive electrode is required for
generating a waveform.
The negative electrode being the center of the heart.
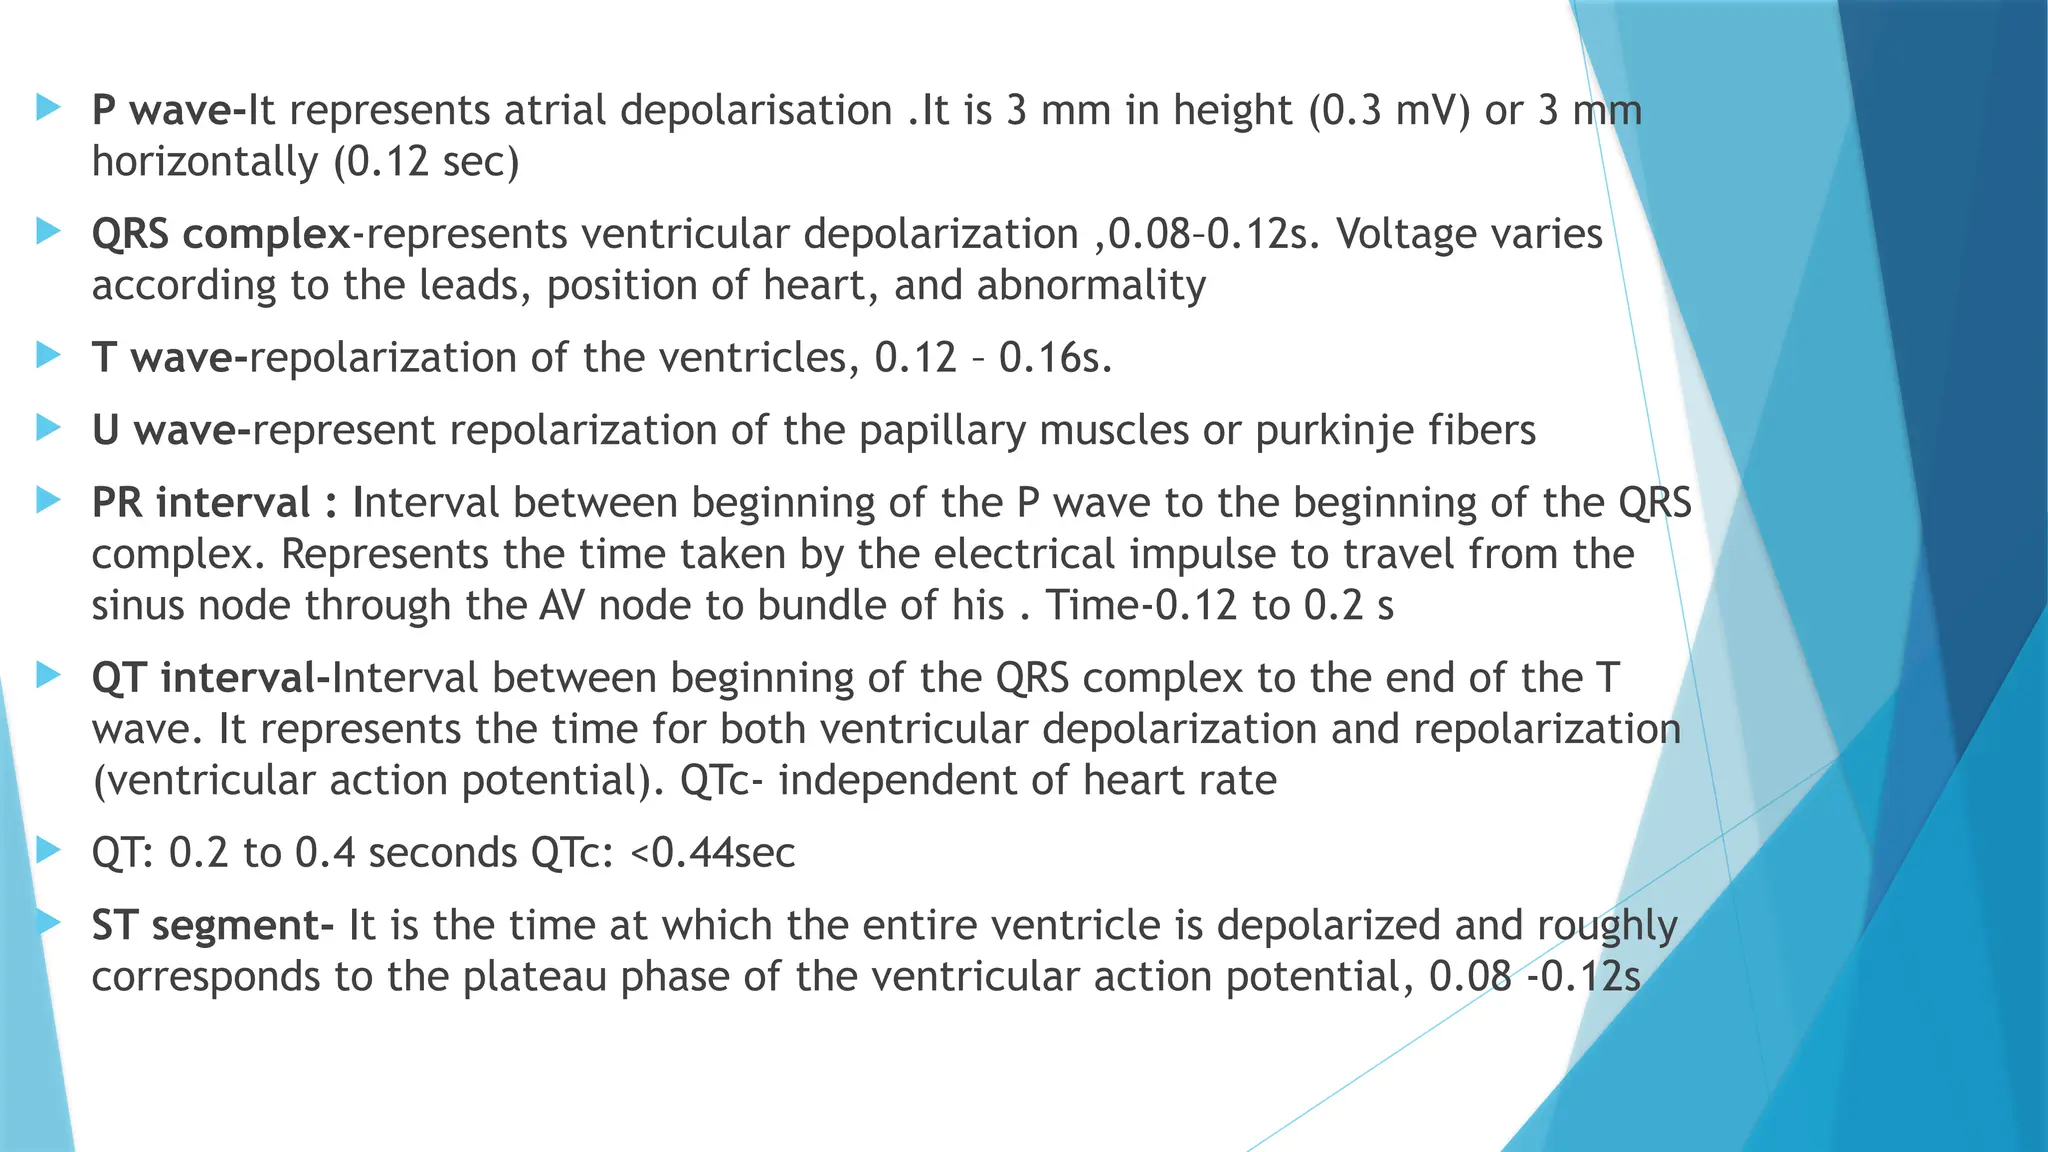
P wave-Itrepresents atrial depolarisation .It is 3 mm in height (0.3 mV) or 3 mm
horizontally (0.12 sec)
QRS complex-represents ventricular depolarization ,0.08–0.12s. Voltage varies
according to the leads, position of heart, and abnormality
T wave-repolarization of the ventricles, 0.12 – 0.16s.
U wave-represent repolarization of the papillary muscles or purkinje fibers
PR interval : Interval between beginning of the P wave to the beginning of the QRS
complex. Represents the time taken by the electrical impulse to travel from the
sinus node through the AV node to bundle of his . Time-0.12 to 0.2 s
QT interval-Interval between beginning of the QRS complex to the end of the T
wave. It represents the time for both ventricular depolarization and repolarization
(ventricular action potential). QTc- independent of heart rate
QT: 0.2 to 0.4 seconds QTc: <0.44sec
ST segment- It is the time at which the entire ventricle is depolarized and roughly
corresponds to the plateau phase of the ventricular action potential, 0.08 -0.12s
13.
The Pwave
o First component of a normal ECG waveform.
o It represents atrial depolarization.
characteristics:
o Location—precedes the QRS complex
o Amplitude—2 to 3 mm high
o Duration—0.06 to 0.12 second
o Configuration—usually rounded and upright
o Deflection—positive or upright in leads I, II, aVF, and V2 to V6;
o Usually positive but variable in leads III and aVL;
o Negative or inverted in lead aVR; biphasic or variable in lead V1.
14.
If thedeflection and configuration of a P wave are normal and if the P wave
precedes each QRS complex, we can assume that this electrical impulse originated
in the sinoatrial (SA) node.
Peaked, notched, or enlarged P waves may represent atrial hypertrophy or
enlargement associated with chronic obstructive pulmonary disease, pulmonary
emboli, valvular disease, or heart failure.
Inverted P waves may signify retrograde or reverse conduction from the
atrioventricular (AV) junction toward the atria.
Varying P waves indicate that the impulse may be coming from different sites, as
with a wandering pacemaker rhythm, irritable atrial tissue, or damage near the SA
node.
Absent P waves may signify conduction by a route other than the SA node, as with a
junctional or atrial fibrillation rhythm.
15.
PR interval
PRinterval tracks the atrial impulse from the atria through the AV node, bundle of His, and
right and left bundle branches.
Location—from the beginning of the P wave to the beginning of the QRS complex
Duration—0.12 to 0.20 second.
When evaluating a PR interval, look especially at its duration.
Changes in the PR interval indicate an altered impulse formation or a conduction delay, as
seen in AV block
Short PR intervals (less than 0.12 second) indicate that the impulse originated somewhere
other than the SA node.
This variation is associated with junctional arrhythmias and preexcitation syndromes.
Prolonged PR intervals (greater than 0.20 second) may represent a conduction delay through
the atria or AV junction due to digoxin toxicity or heart block—slowing related to ischemia or
conduction tissue disease
16.
The QRS complex
The QRS complex follows the P wave and represents depolarization of the ventricles.
characteristics:
• location—follows the PR interval
• amplitude—5 to 30 mm high but differs for each lead used.
• duration—0.06 to 0.10 second, or half of the PR interval.
• Duration is measured from the beginning of the Q wave to the end of the S wave or from the
beginning of the R wave if the Q wave is absent.
• QRS complex represents intraventricular conduction time. If no P wave appears with the QRS
complex, then the impulse may have originated in the ventricles, indicating a ventricular
arrhythmia.
17.
Configuration—
Q wave-the first negative deflection after the P wave
R wave- the first positive deflection after the P wave or the Q wave
S wave -the first negative deflection after the R wave .
The ventricles depolarize quickly, minimizing contact time between the stylus and the
ECG paper, so the QRS complex typically appears thinner than other ECG components.
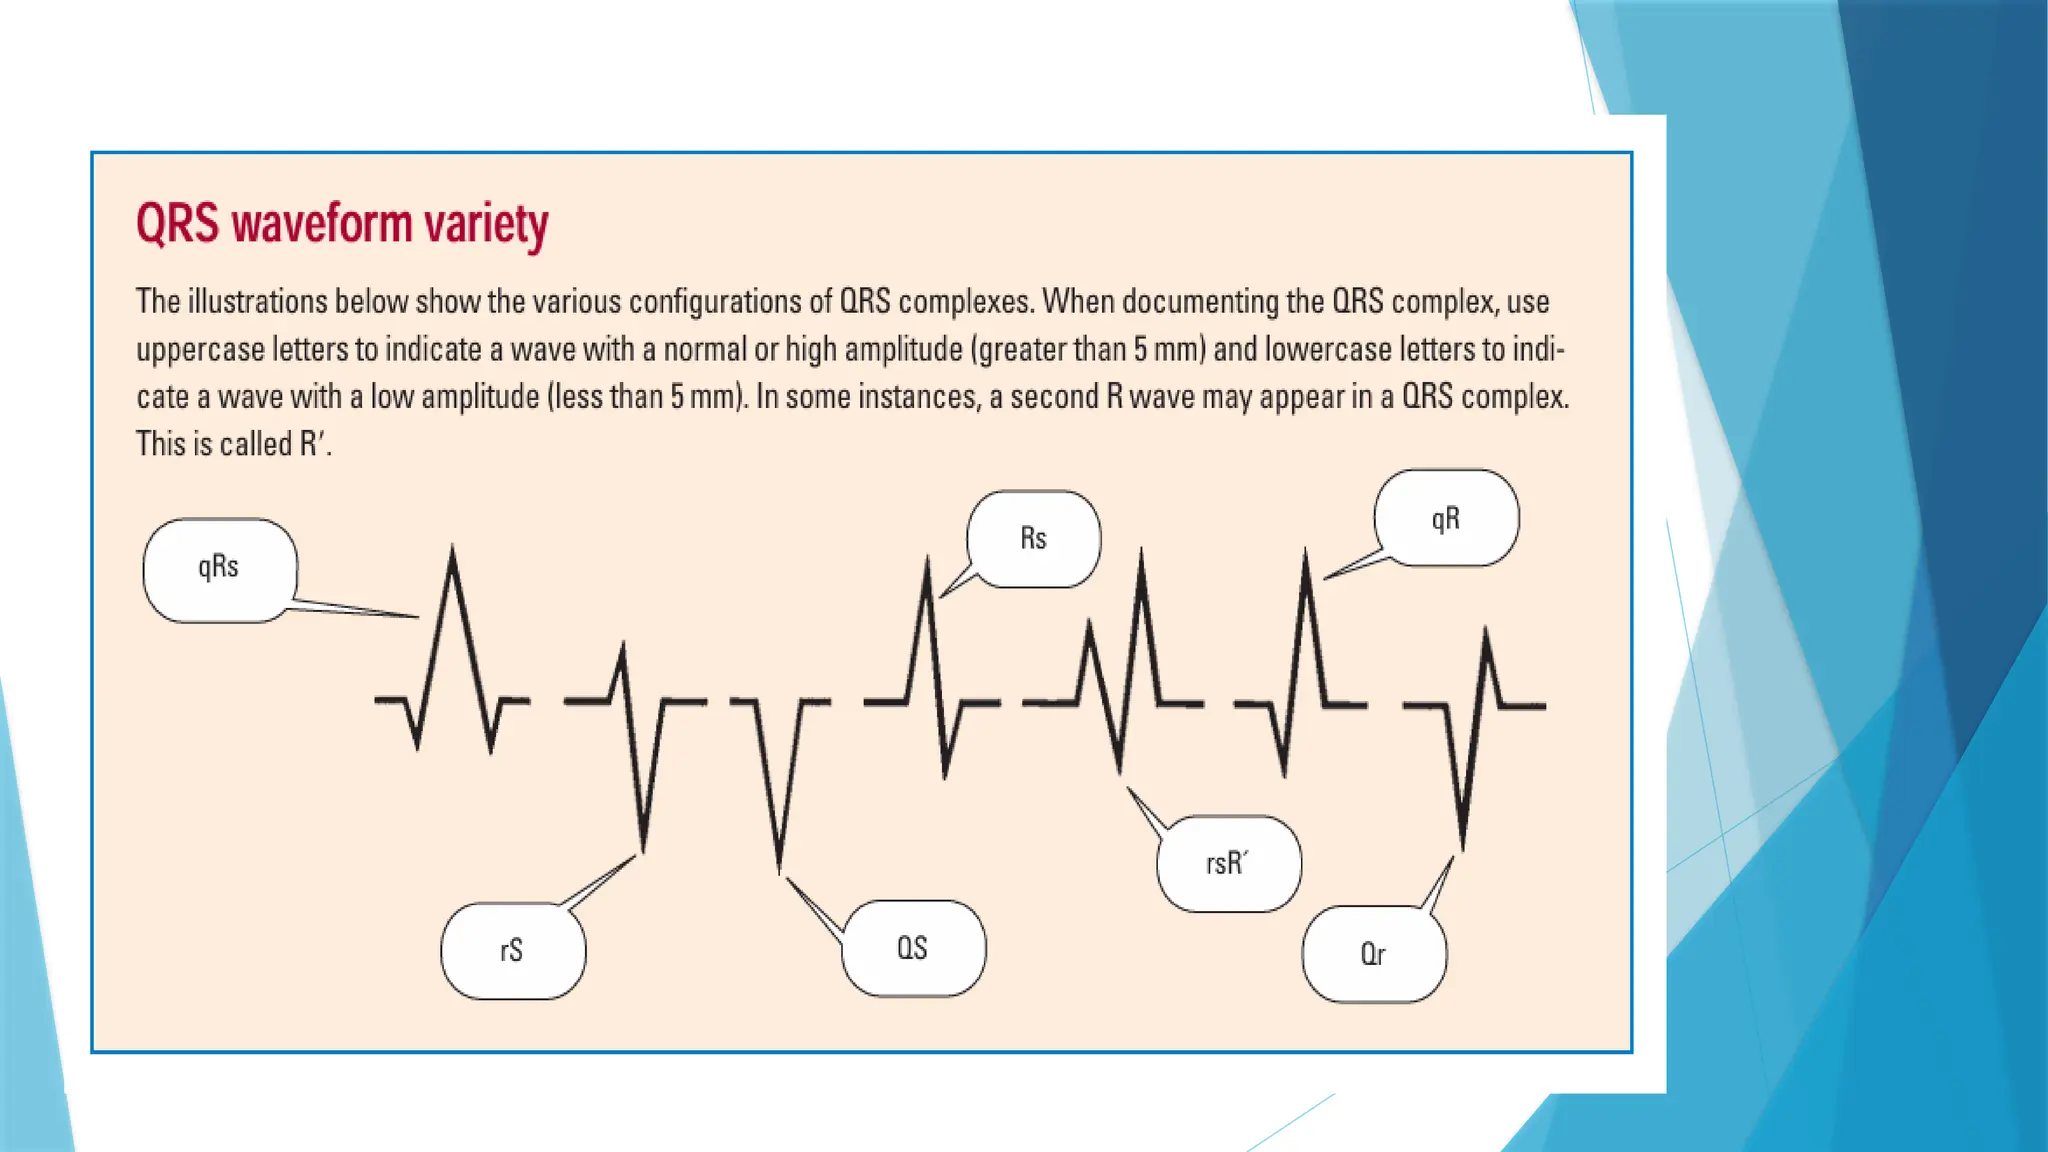
It may also look different in each lead. (See QRS waveform variety.
Deflection—positive in leads I, II, III, aVL, aVF, and V4 to V6 and negative in leads aVR
and V1 to V3
Deep and wide Q waves may represent myocardial infarction. In this case, the Q-wave
amplitude is 25% of the R-wave amplitude, or the duration of the Q wave is 0.04 second
or more.
A notched R wave may signify a bundle-branch block.
A widened QRS complex (greater than 0.12 second) may signify a ventricular conduction
delay.
A missing QRS complex may indicate AV block or ventricular standstill.
20.
The ST segment
represents the end of ventricular conduction or
depolarization and the beginning of ventricular
recovery or repolarization.
The point that marks the end of the QRS
complex and the beginning of the ST segment
is known as the J point.
Location—extends from the S wave to the
beginning of the T wave
Deflection—usually isoelectric (neither positive
nor negative);
may vary from –0.5 to +1 mm in some
precordial leads.
21.
A change inthe ST segment may indicate myocardial damage.
ST-segment depression - when it’s
0.5 mm or more below the base
line.
May indicate myocardial ischemia
or digoxin toxicity.
ST-segment elevation - when it’s 1
mm or more above the base line.
may indicate myocardial injury.
23.
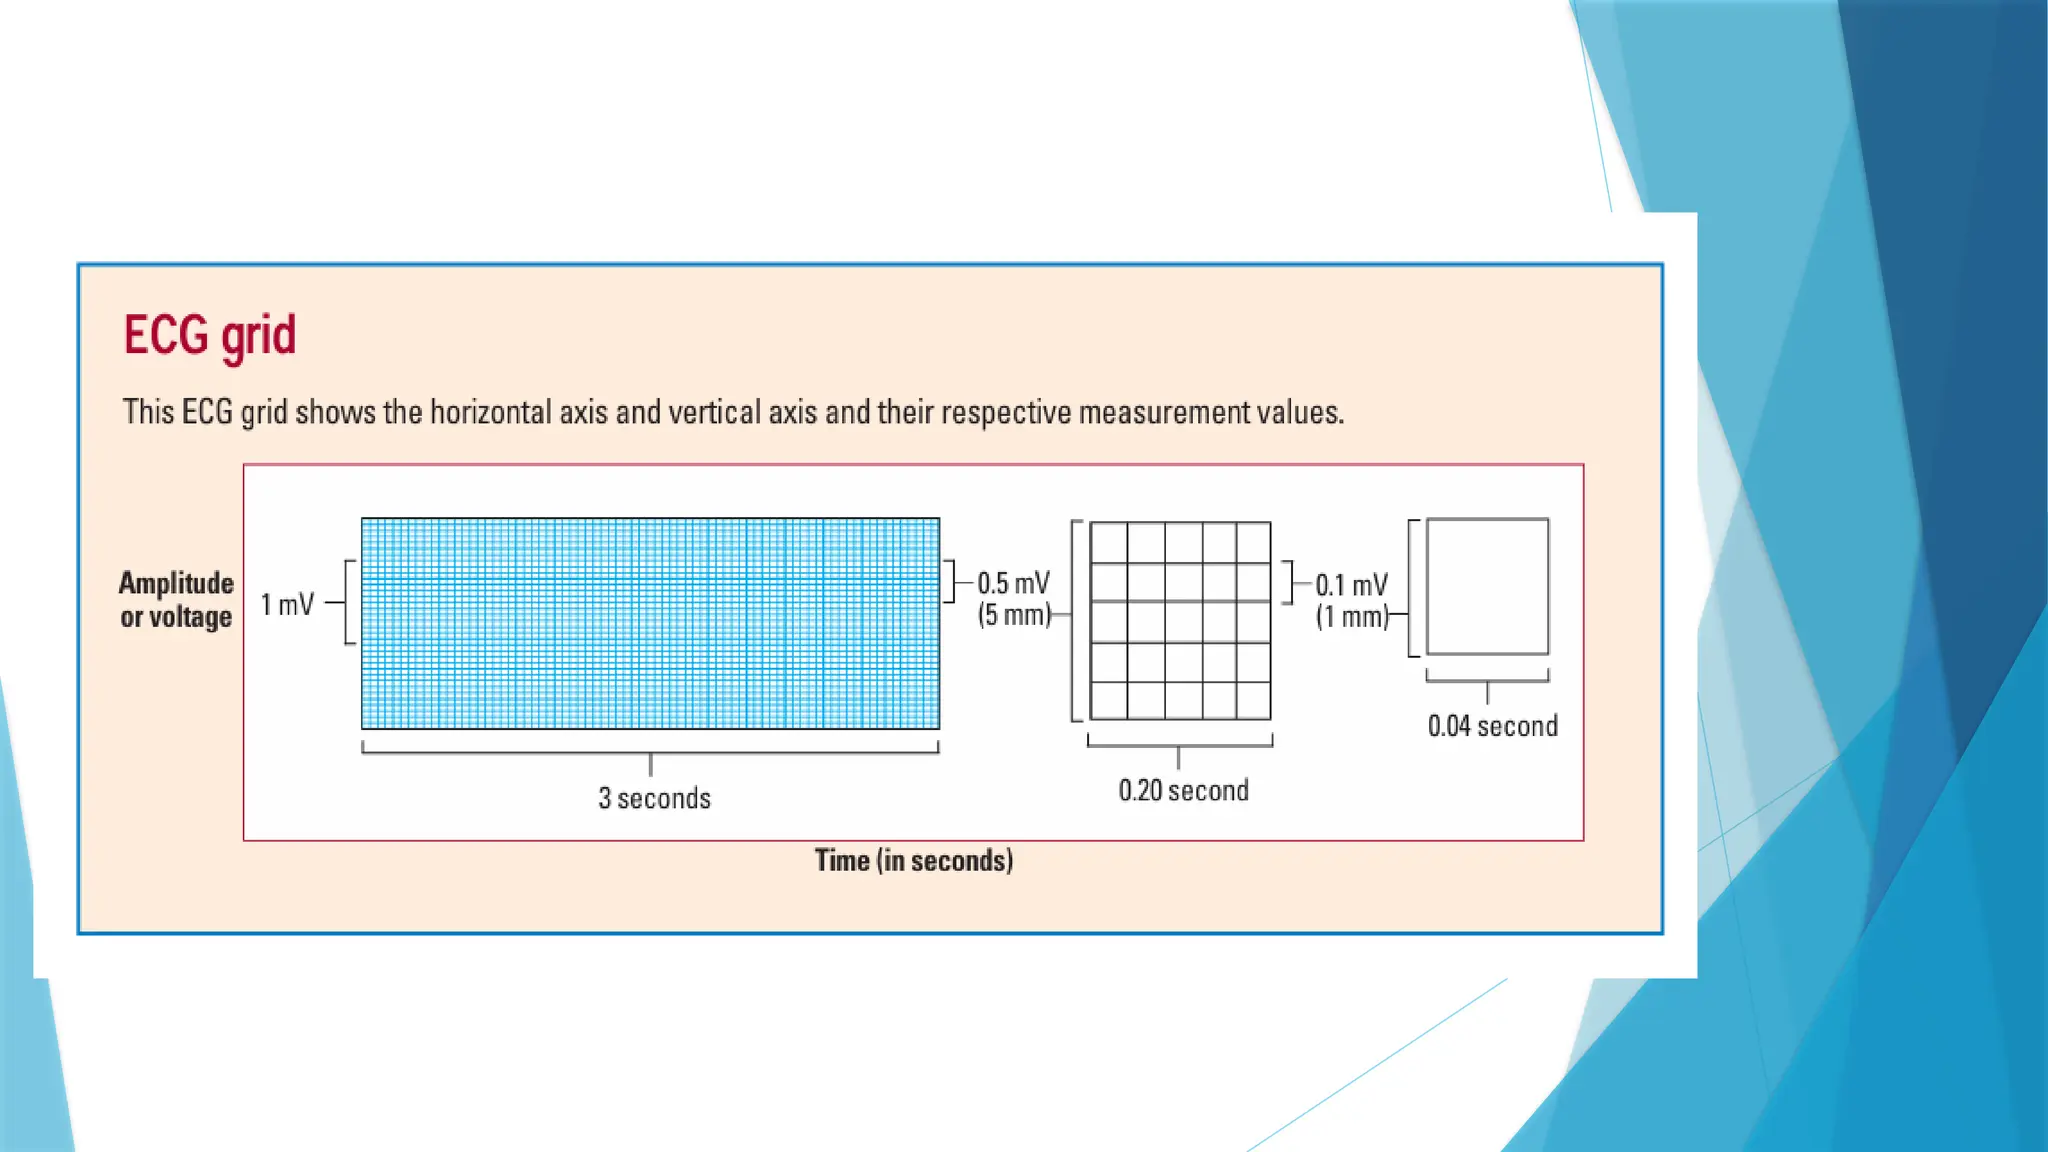
CALIBRATION
A standardsignal of 1 millivolt (mV) should move the stylus vertically 1 cm (two large squares),
and this ‘calibration’ signal should be included with every record.
24.
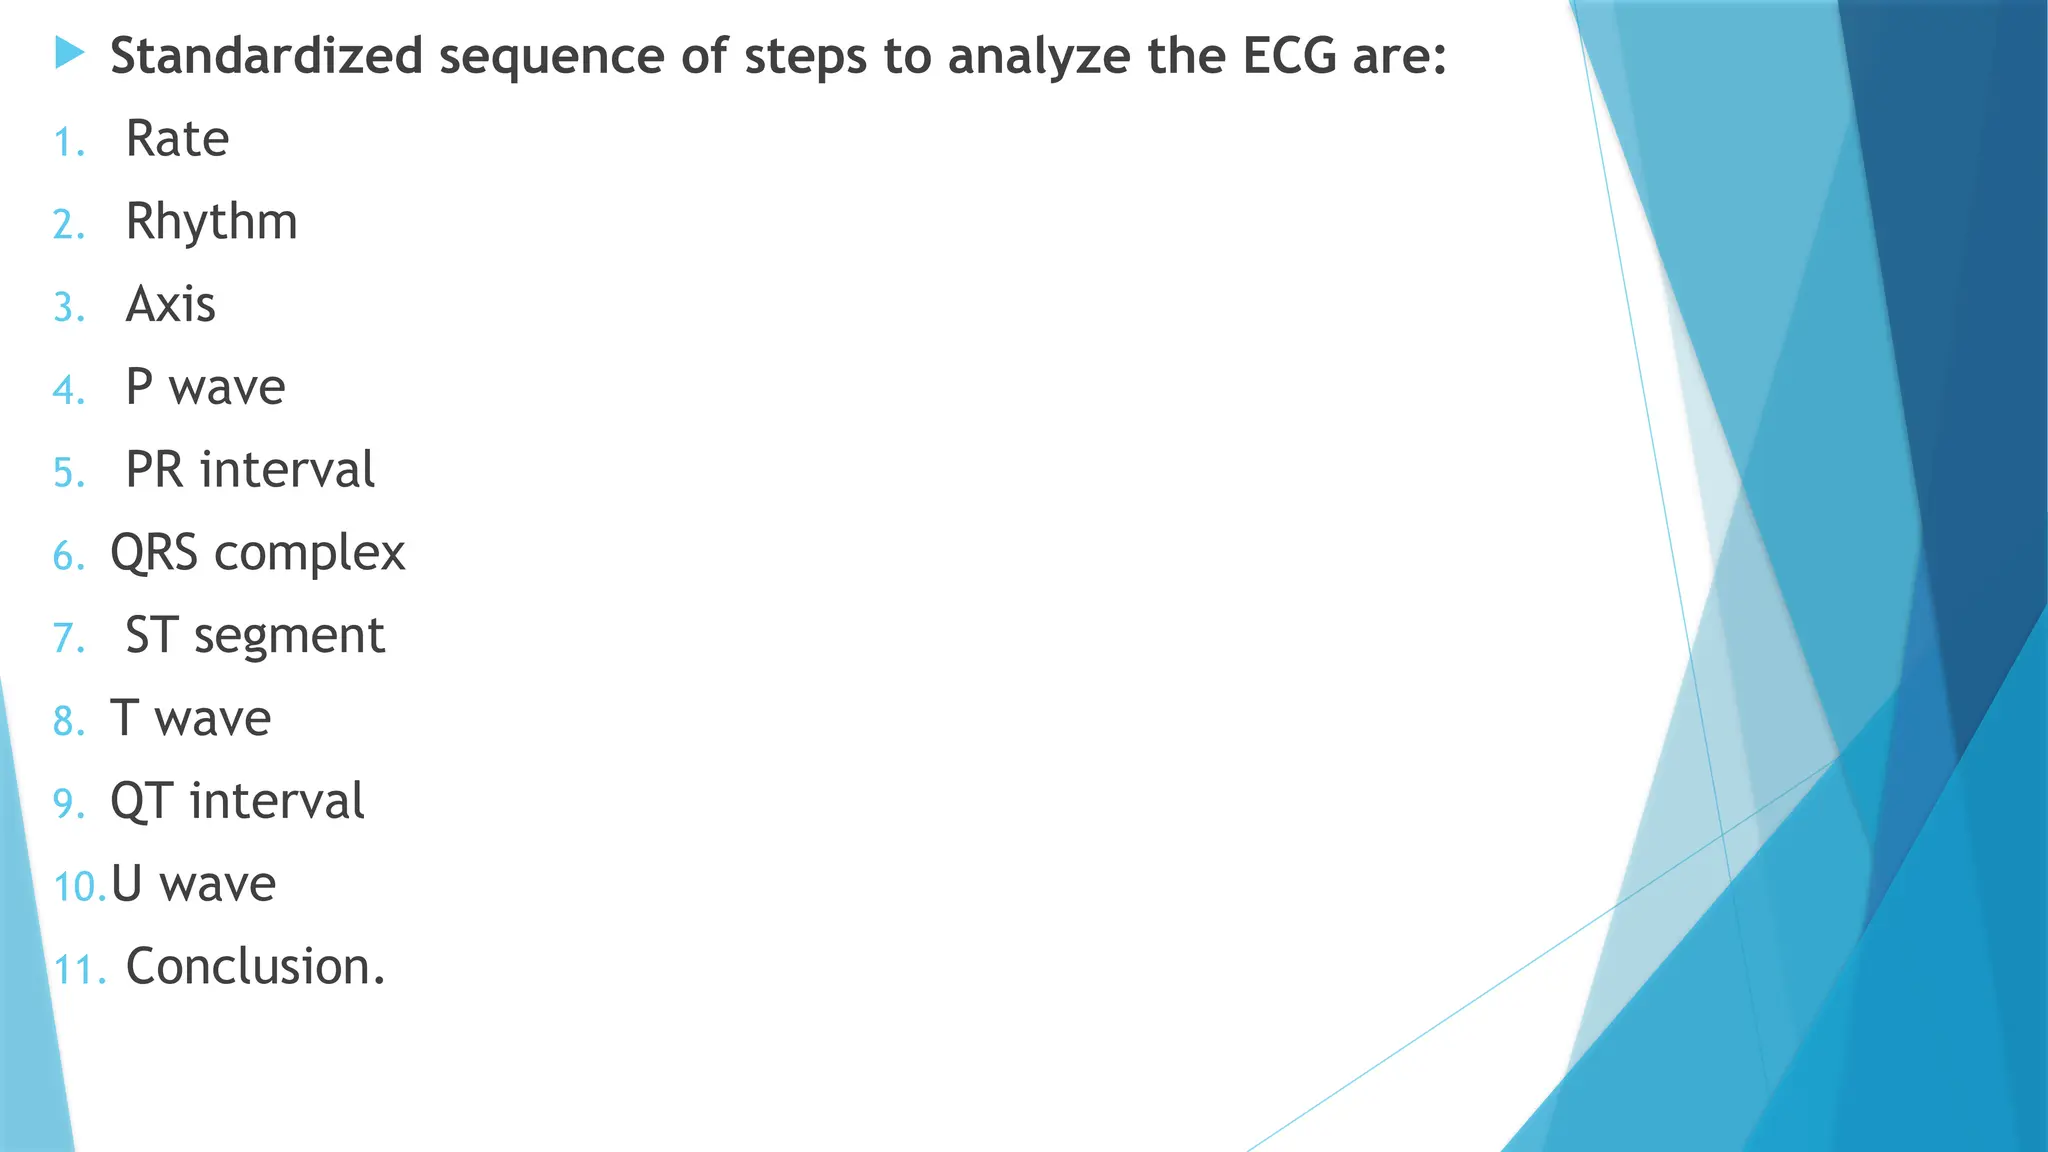
Standardized sequenceof steps to analyze the ECG are:
1. Rate
2. Rhythm
3. Axis
4. P wave
5. PR interval
6. QRS complex
7. ST segment
8. T wave
9. QT interval
10.U wave
11. Conclusion.
25.
1.RATE :
TIMES ANDSPEEDS
ECG machines record changes in electrical activity by drawing a trace on a moving paper
strip.
ECG machines run at a standard rate of 25 mm/s and use paper with standard-sized
squares. Each large square (5 mm) represents 0.2 second (s), i.e. 200 milliseconds (ms)
Therefore, there are five large squares per second, and 300 per minute. So an ECG event,
such as a QRS complex, occurring once per large square is occurring at a rate of 300/min.
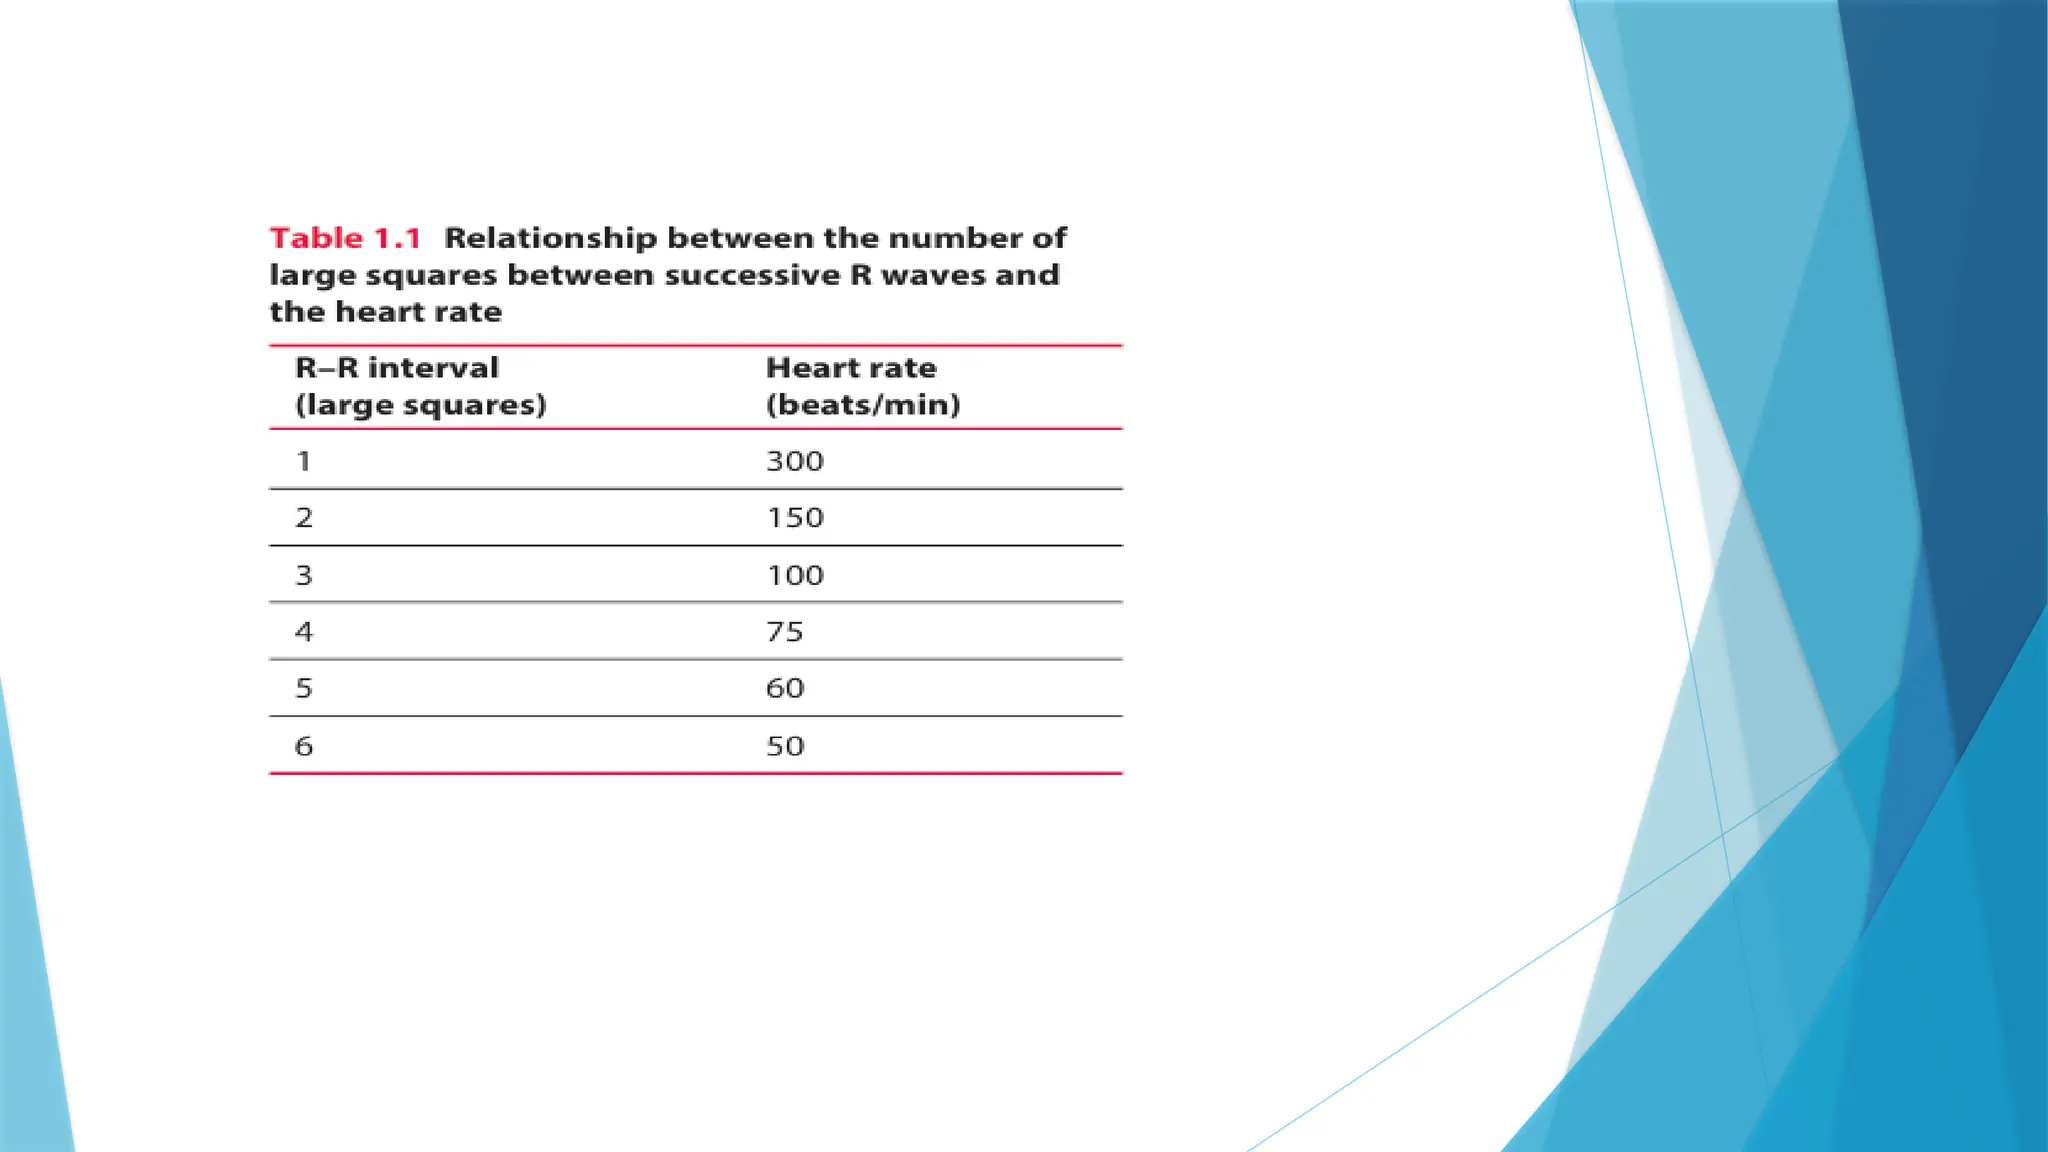
CALCULATION OF RATE
When rhythm is regular one can calculate rate by either:
1. Dividing 1500 by the number of small squares between one R-R interval
2. Dividing 300 by number of large squares between one R-R interval.
When rhythm is irregular one can calculate rate by:–
1. Counting the number of R-R intervals in 3 sec (15 large squares) and multiplying by 20.
Example: Heart Rate = 300/4=75
27.
2 .RHYTHM :
A regular rhythm is when the distance between R waves on an ECG is equal
An irregular rhythm is when the distance between R waves varies.
Sinus rhythm (which is the normal rhythm) has the following characteristics:
(1) heart rate 50–100 beats per minute;
(2) P-wave precedes every QRS complex;
(3) the P wave is positive in lead II.
(4) the PR interval is constant.
Regularly irregular rhythm
Irregularly irregular rhythm
28.
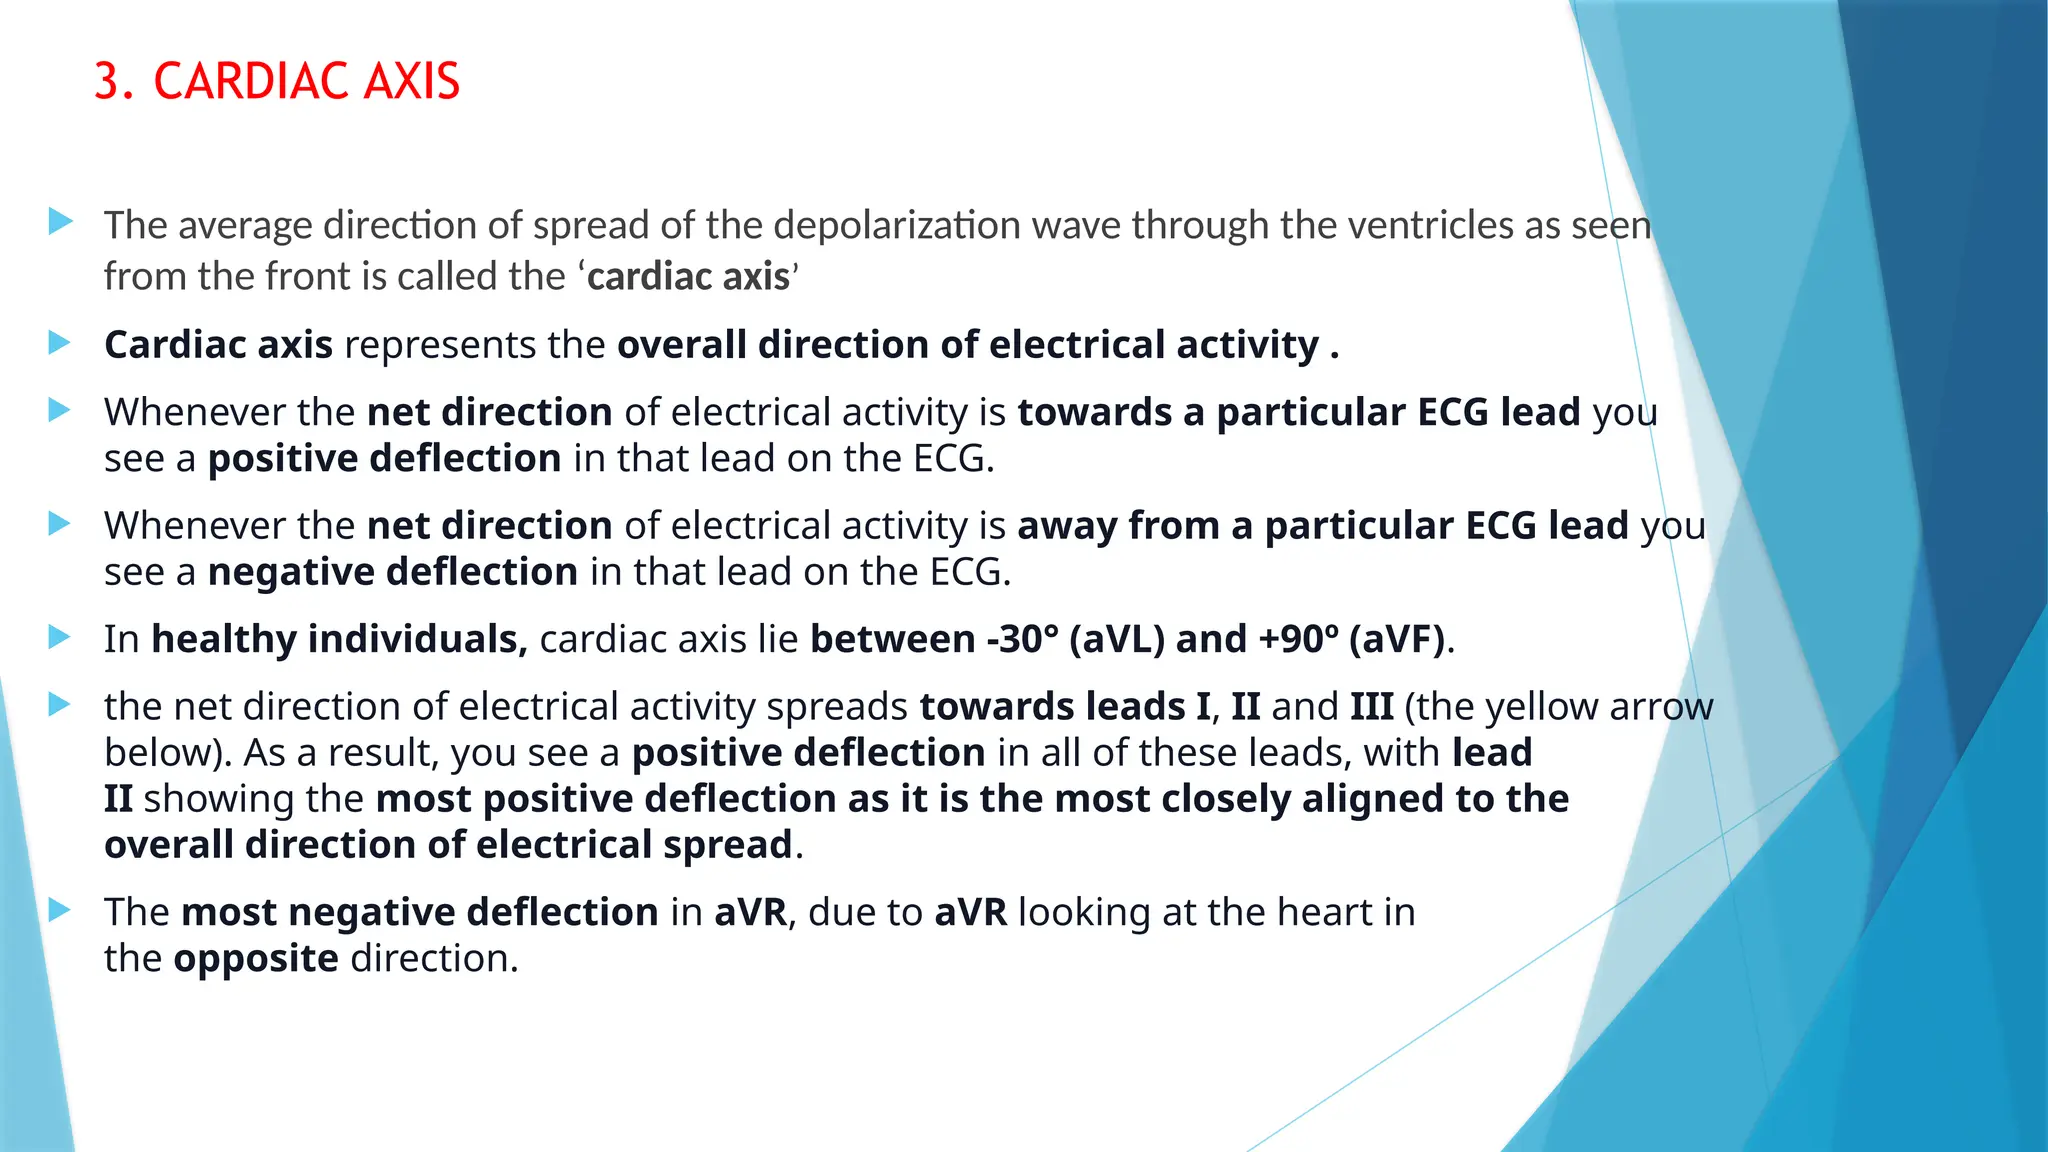
3. CARDIAC AXIS
The average direction of spread of the depolarization wave through the ventricles as seen
from the front is called the ‘cardiac axis’
Cardiac axis represents the overall direction of electrical activity .
Whenever the net direction of electrical activity is towards a particular ECG lead you
see a positive deflection in that lead on the ECG.
Whenever the net direction of electrical activity is away from a particular ECG lead you
see a negative deflection in that lead on the ECG.
In healthy individuals, cardiac axis lie between -30° (aVL) and +90º (aVF).
the net direction of electrical activity spreads towards leads I, II and III (the yellow arrow
below). As a result, you see a positive deflection in all of these leads, with lead
II showing the most positive deflection as it is the most closely aligned to the
overall direction of electrical spread.
The most negative deflection in aVR, due to aVR looking at the heart in
the opposite direction.
30.
The axisis calculated (to the nearest degree) by the ECG machine.
The axis can also be approximated manually by judging the net direction of the QRS
complex in leads I and II.
The following rules apply:
• Normal axis: Net positive QRS complex in leads I and II.
• Right axis deviation: Net negative QRS complex in lead I but positive in lead II.
• Left axis deviation: Net positive QRS complex in lead I but negative in lead II.
• Extreme axis deviation (–90°to 180°): Net negative QRS complex in leads I and II.
31.
Right axisdeviation
The direction of depolarisation being distorted to the right (between +90º and +180º).
The most common cause of RAD is right ventricular hypertrophy.
Extra right ventricular tissue results in a stronger electrical signal being generated by
the right side of the heart.
This causes the deflection in lead I to become negative and the deflection in lead
aVF/III to be more positive.
RAD is commonly associated with conditions which result in the development of right
ventricular hypertrophy such as pulmonary hypertension.
RAD can, however, be a normal finding in very tall individuals.
33.
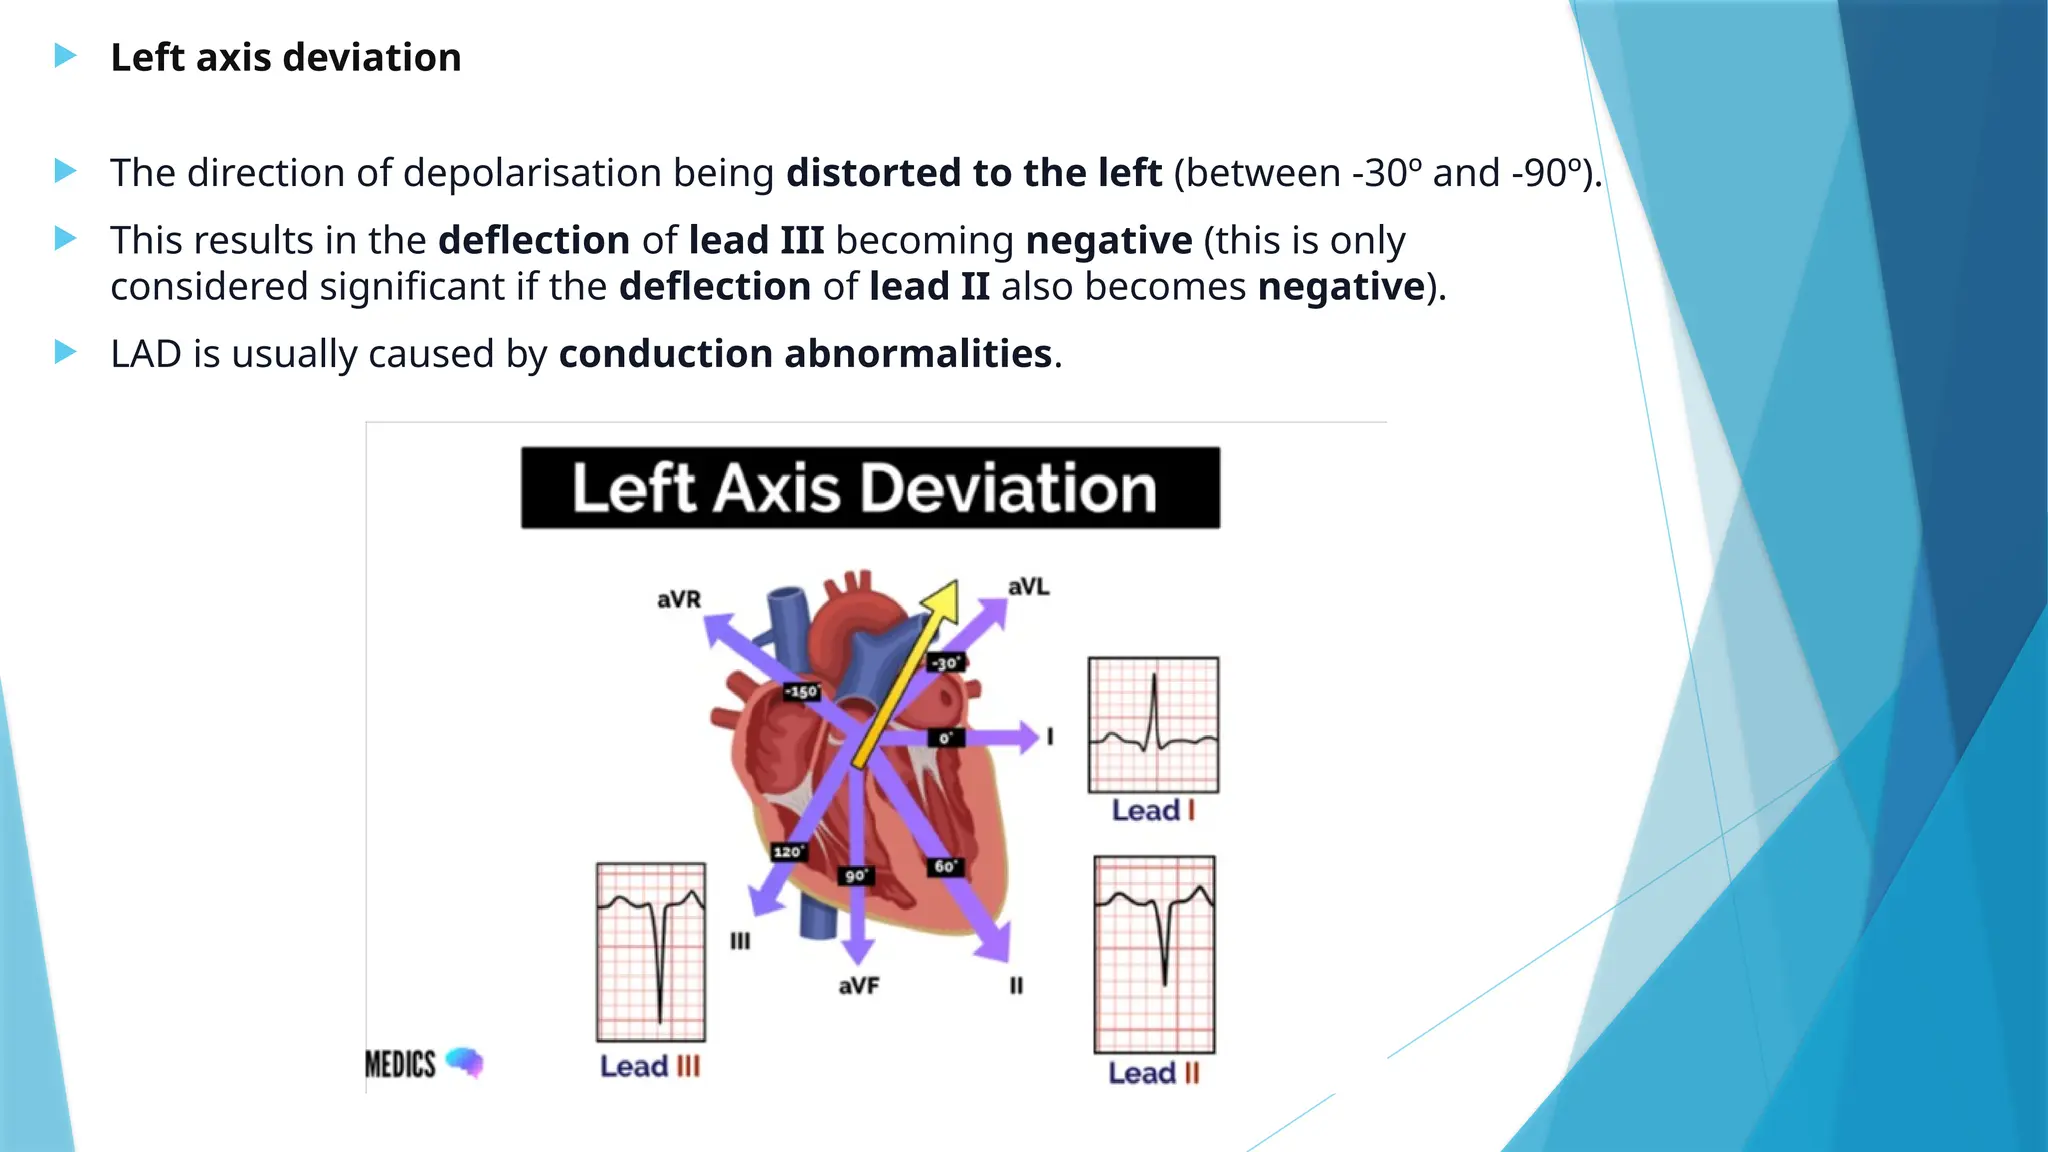
Left axisdeviation
The direction of depolarisation being distorted to the left (between -30º and -90º).
This results in the deflection of lead III becoming negative (this is only
considered significant if the deflection of lead II also becomes negative).
LAD is usually caused by conduction abnormalities.
34.
4. P WAVE
P-wave always positive in lead II, III and Avf
P-wave duration should be < 0.12 in all leads.
3 mm in height (0.3 mV) or 3 mm horizontally (0.12 sec).
Abnormalities
1.Absent –Atrial fibrillation–Sino-atrial block–Nodal rhythm
2.Inverted–Dextrocardia–Incorrect electrode placement
3.Wide and notched P-mitrale—left atrial enlargement
4.Tall and peaked–P-pulmonale—in right atrial enlargement
35.
5.PR INTERVAL
PRinterval must be 0.12–0.22 s (all leads).
PR interval >0.22 s: first-degree AV block.
PR interval < 0,12 s: Pre-excitation (WPW syndrome)
36.
6.QRS COMPLEX
QRSduration -0.08–0.12s.
There must be at least one limb lead with R-wave amplitude >5 mm and at least one
chest (precordial) lead with R-wave amplitude >10 mm; otherwise there is low voltage.
High voltage exists if the amplitudes are too high, i.e if the following condition is
satisfied: S wave V1 or V2 + R-wave V5 >35 mm.
Wide QRS complex (QRS duration ≥0.12 s):
Left bundle branch block.
Right bundle branch block.
Nonspecific intraventricular conduction disturbance.
Hyperkalemia.
Class I antiarrhythmic drugs.
Ventricular rhythms and ventricular extrasystoles (premature complexes).
Artificial pacemaker which stimulates in the ventricle.
37.
Short QRSduration: no clinical relevance.
High voltage:
Hypertrophy (any lead).
Left bundle branch block (leads V5, V6, I, aVL).
Right bundle branch block (V1 V3).
Normal variant in younger and slender individuals.
Low voltage:
Normal variant.
Misplaced leads.
Cardiomyopathy.
Chronic obstructive pulmonary disease.
Perimyocarditis.
Pneumothorax.
Extensive myocardial infarction. Obesity.
Pericardial effusion,Pleural effusion.
Amyloidosis.
38.
Q wavesare considered pathological if:
• > 40 ms (1 mm) wide
• > 2 mm deep
• > 25% of depth of QRS complex
• Seen in leads V1-3
Pathological Q waves usually indicate current or prior myocardial infarction.
Differential diagnosis:
Left-sided pneumothorax.
Dextrocadia.
Perimyocarditis.
Cardiomyopathy.
Amyloidosis.
Bundle branch blocks.
.Ventricular hypertrophy.