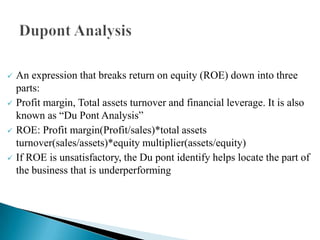
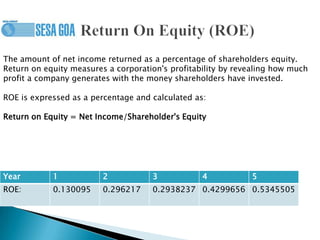
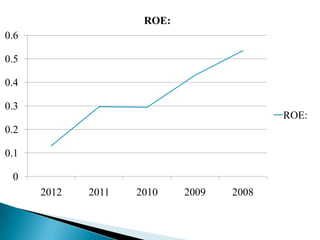
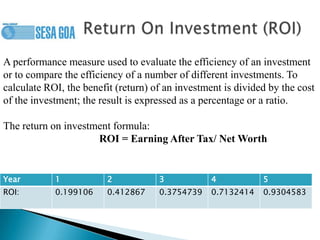
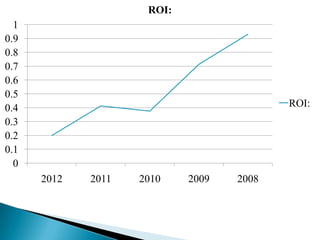
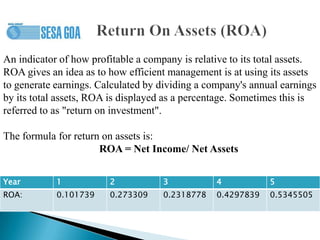
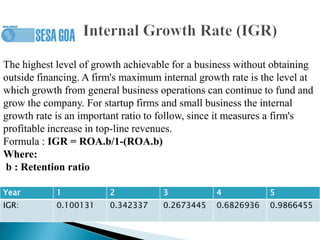
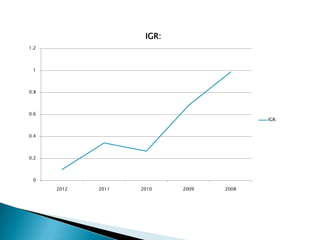
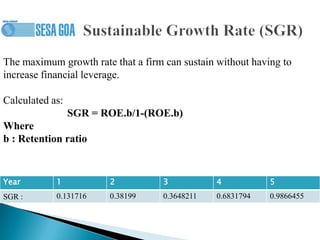
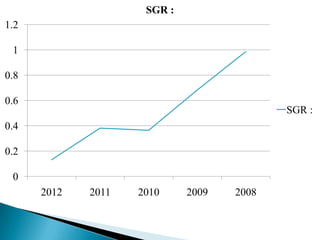
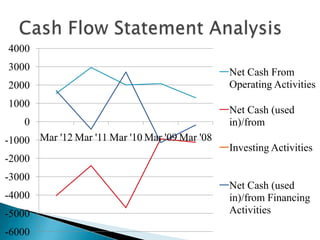
Introduction to DuPont model. This presentation tries to understand the DuPont equation and explain its components. Author Sagnik Monga is Research Intern with Adroit Research.
DuPont analysis is a useful technique to break down the different return on equity (ROE) generators. The ROE decomposition helps investors to concentrate separately on key indicators of financial success to define strengths and weaknesses.
Three main financial metrics drive equity return (ROE): operating performance, asset usage performance, and financial leverage. Operating output is a net profit margin or a net income separated by overall revenue or profits.
The efficiency of asset usage is determined by the turnover ratio of the assets. Leverage is calculated by the equity multiplier, equal to average assets divided by average equities.
The component parts of a firm's return on equity (ROE) are calculated using a DuPont analysis. This allows an investor to assess, which financial activities contribute the most to the ROE changes
This PPT contains the full detail of topic leverage in financial management
it covers following topics :-
Meaning of Leverage
Types of Leverage
Operating Leverage
Financial Leverage
Difference between Operating & Financial Leverage
Combined Leverage
Illustrations
Exercise
This ppt covers the following points :-
1. introduction of management accounting
2. Definition of management accounting
3. Nature, objective, tools and techniques, significance and limitations of management accounting
4. difference between financial and management accounting and also includes difference between cost and management accounting
5. management accountant and its roles
6. Management accounting organisation
,
capital budgeting
,
concept of capital budgeting
,
the capital budgeting process
,
significance of capital budgeting
,
classification of investment project proposals
,
techniques of capital budgeting
,
types of project
Investment Decision — Capital Budgeting Techniques — Pay Back Method — Accounting Rate Of Return — NPV — IRR — Discounted Pay Back Method — Capital Rationing — Risk Adjusted Techniques Of Capital Budgeting. — Capital Budgeting Practices
Introduction to ratio analysis. This slide show is an analysis of accounting ratios to introduce students and those interested in taking accounting as their future career into ratio analysis. It's been simplified and made concise. The writer is a lecturer in engineering and a financial engineer. You can always follow the writer on LinkedIn, Twitter of Facebook. You comments are also welcome for future work.
12Walt Disney Company Financial Ratios Calculation 201ChantellPantoja184
1
2
Walt Disney Company Financial Ratios Calculation 2019
Walt Disney Company Financial Ratios Calculation 2020
Walt Disney Company Financial Ratios Comparison
DuPont Analysis
In the context of the study of economic and financial performance, a very useful tool in the specialized literature and practice is the DuPont model. The analysis by the DuPont model is realized through the decomposition rate of return ROE (Return on Equity) according to other rates of return, such as ROS (Return on Sales), ROA (Return on Assets) or Equity Multiplier.
Decomposition of Net Profit Margin
Two-component Disaggregation of ROA
Four-component Disaggregation of ROA
Two-component Disaggregation of ROE
ROE = ROA * Financial Leverage
Year
ROE
ROA
Financial Leverage
2020
-3.43%
-1.42%
2.41
2019
12.44%
5.70%
2.18
Three-component Disaggregation of ROE
2019
2020
Debt Ratio
0.46(Stronger)
0.51(Weaker)
Gross Profit margin
39.6%(Stronger)
32.9%(Weaker)
Free cash flow
1.6%(Stronger)
1.5%(Weaker)
Times interest earned
12.19(Less risk)
-0.06(More risk)
Accounts receivable turnover
4.49(Slower)
5.15(Quicker)
Inventory turnover
9.4(Quicker)
8.8(Slower)
Return on Sales
15.89%(Stronger)
-4.38%(Weaker)
Asset Turnover
0.36(Quicker)
0.32(Slower)
Return on Assets
5.7%(Stronger)
-1.42%(Weaker)
Financial Leverage
2.18(Less Risk)
2.41(More risk)
Return on Equity
12.4%(Stronger)
-3.4%(Weaker)
This paper discusses the trends within the financial performance of Walt Disney, supported the 2 financial years, 2019 and 2020 discussing different aspects of the firm that include
liquidity, efficiency, profitability and solvency.
Profitability
The return on sales of Walt Disney deteriorated in 2020 because it was at -4.38% compared to 15.89% that was achieved in 2019. this might be attributed to numerous issues chief among them increased administration costs and increased.
The ratio of Walt Disney deteriorated in 2020. The profit margin shows the power of the corporate to hold the prices related to the sales low. The return on assets of the firm deteriorated from 5.7% in 2019 to -1.42% in 2020. The return on assets indicates the management’s ability to form sales using total assets. The deterioration of the ROA ratio indicates that there is downswing in efficiency of assets.
Lastly, the Return on Equity also deteriorated because it reduced from 12.4% to -3.4%. The
return on equity indicated the use of shareholders equity in creating income. The breakdown of ROE into its three components, financial leverage, margin of profit, and asset turnover show us the productive aspects of the Walt Disney. The return on assets indicates the management’s ability to form sales using total assets. While there was a rise in financial leverage and asset turnover in 2020, there was a decrease within the margin of profit, which decreased the overall ROE. The profitability of Walt Disney, considering the profit ratios, is deteriorating, with key factor being the decreas ...
12Walt Disney Company Financial Ratios Calculation 201CicelyBourqueju
1
2
Walt Disney Company Financial Ratios Calculation 2019
Walt Disney Company Financial Ratios Calculation 2020
Walt Disney Company Financial Ratios Comparison
DuPont Analysis
In the context of the study of economic and financial performance, a very useful tool in the specialized literature and practice is the DuPont model. The analysis by the DuPont model is realized through the decomposition rate of return ROE (Return on Equity) according to other rates of return, such as ROS (Return on Sales), ROA (Return on Assets) or Equity Multiplier.
Decomposition of Net Profit Margin
Two-component Disaggregation of ROA
Four-component Disaggregation of ROA
Two-component Disaggregation of ROE
ROE = ROA * Financial Leverage
Year
ROE
ROA
Financial Leverage
2020
-3.43%
-1.42%
2.41
2019
12.44%
5.70%
2.18
Three-component Disaggregation of ROE
2019
2020
Debt Ratio
0.46(Stronger)
0.51(Weaker)
Gross Profit margin
39.6%(Stronger)
32.9%(Weaker)
Free cash flow
1.6%(Stronger)
1.5%(Weaker)
Times interest earned
12.19(Less risk)
-0.06(More risk)
Accounts receivable turnover
4.49(Slower)
5.15(Quicker)
Inventory turnover
9.4(Quicker)
8.8(Slower)
Return on Sales
15.89%(Stronger)
-4.38%(Weaker)
Asset Turnover
0.36(Quicker)
0.32(Slower)
Return on Assets
5.7%(Stronger)
-1.42%(Weaker)
Financial Leverage
2.18(Less Risk)
2.41(More risk)
Return on Equity
12.4%(Stronger)
-3.4%(Weaker)
This paper discusses the trends within the financial performance of Walt Disney, supported the 2 financial years, 2019 and 2020 discussing different aspects of the firm that include
liquidity, efficiency, profitability and solvency.
Profitability
The return on sales of Walt Disney deteriorated in 2020 because it was at -4.38% compared to 15.89% that was achieved in 2019. this might be attributed to numerous issues chief among them increased administration costs and increased.
The ratio of Walt Disney deteriorated in 2020. The profit margin shows the power of the corporate to hold the prices related to the sales low. The return on assets of the firm deteriorated from 5.7% in 2019 to -1.42% in 2020. The return on assets indicates the management’s ability to form sales using total assets. The deterioration of the ROA ratio indicates that there is downswing in efficiency of assets.
Lastly, the Return on Equity also deteriorated because it reduced from 12.4% to -3.4%. The
return on equity indicated the use of shareholders equity in creating income. The breakdown of ROE into its three components, financial leverage, margin of profit, and asset turnover show us the productive aspects of the Walt Disney. The return on assets indicates the management’s ability to form sales using total assets. While there was a rise in financial leverage and asset turnover in 2020, there was a decrease within the margin of profit, which decreased the overall ROE. The profitability of Walt Disney, considering the profit ratios, is deteriorating, with key factor being the decreas ...
Return on Capital Employed (ROCE) and Return on Equity (ROE)Rajat Kumar
Return on Capital Employed (ROCE) and Return on Equity (ROE) or Return on Net Worth (RONW) are both used to measure the profitability of a company based on the funds with which the company conducts its business. Know about.
Analysing in terms of-
Liquidity Ratio
1. Current Ratio (Current Assets / Current Liabilities)
2. Liquid Ratio (Cash + Marketable Securities + Account Receivables) / Current Liabilities
Profitability Ratio
1. Gross Margin (Gross profit / Sales)
2. Net Profit Ratio (Net Profit / Net Sales)
3. ROE (PAT / Equity)
4. ROCE (EBIT/Capital Employed)
Solvency Ratio
1. Debt/Equity
2. Debt/TA
This presentation poster infographic delves into the multifaceted impacts of globalization through the lens of Nike, a prominent global brand. It explores how globalization has reshaped Nike's supply chain, marketing strategies, and cultural influence worldwide, examining both the benefits and challenges associated with its global expansion.
PPrreesseenntteedd bbyy:: GGrroouupp 66
GGlloobbaalliizzaattiioonn
o f
PP
oo
ll
yy
ee
ss
tt
ee
rr
RR
uu
bb
bb
ee
rr
EE
tt
hh
yy
ll
ee
nn
ee
VV
ii
nn
yy
ll
AA
cc
ee
tt
aa
tt
ee
GG
ee
nn
uu
ii
nn
ee
LL
ee
aa
tt
hh
ee
rr
SS
yy
nn
tt
hh
ee
tt
ii
cc
LL
ee
aa
tt
hh
ee
rr
CC
oo
tt
tt
oo
nn
C
o
u
n
t
r
i
e
s
I
n
v
o
l
v
e
d
Ni
k
e
h
a
s
m
o
r
e
t
h
a
n
7
0
0
s
h
o
p
s
i
n
c
o
n
t
r
a
c
t
w
i
t
h
w
o
r
l
d
w
i
d
e,
w
h
e
r
e
i
n
t
h
e
i
r
offi
c
e
s
a
n
d
i
n
d
e
p
e
n
d
e
n
t
fa
c
t
o
r
y
o
u
t
l
e
t
s
a
r
e
fo
u
n
d
w
i
t
h
i
n
t
h
e
p
r
e
m
i
s
e
s
of
ap
p
r
o
x
i
m
a
t
e
l
y
4
5
c
o
u
n
t
r
i
e
s.
AAuussttrraalliiaa
China
India
IInnddoonneessiiaa
TThhaaiillaanndd
TTuurrkkeeyy
USA
VViieettnnaamm
NNiikkee SSuuppppllyy CChhaaiinn
RRuubbbbeerr,, FFaabbrriicc
aanndd ootthheerr rraaww
mmaatteerriiaallss
Shoe
MMaannuuffaaccttuurriinngg
aanndd AAsssseemmbbllyy
MMaarrkkeettiinngg
SSppoorrttiinngg ggooooddss,,
ddeevveellooppmmeenntt
aanndd SShhooee ssttoorreess
OOnnlliinnee,, CCaattaalloogg
aanndd ootthheerr rreettaaiill
NNiikkee bbrraannddeedd
shoes
PPrroodduucctt
ddeevveellooppmmeenntt
CCuussttoommeerr nneeeeddss//wwaannttss ffeeeeddbbaacckk
NNiikk
Nike Supply Chain
Globalization of Nike
Nike Manufacturing Process
Rubber Materials Nike
Ethylene Vinyl Acetate Nike
Genuine Leather Nike
Synthetic Leather Nike
Cotton in Nike Apparel
Nike Shops Worldwide
Nike Manufacturing Countries
Cold Cement Assembly Nike
3D Printing Nike Shoes
Nike Product Development
Nike Marketing Strategies
Nike Customer Feedback
Nike Distribution Centers
Automation in Nike Manufacturing
Nike Consumer Direct Acceleration
Nike Logistics and Transport
Understanding how timely GST payments influence a lender's decision to approve loans, this topic explores the correlation between GST compliance and creditworthiness. It highlights how consistent GST payments can enhance a business's financial credibility, potentially leading to higher chances of loan approval.
The secret way to sell pi coins effortlessly.DOT TECH
Well as we all know pi isn't launched yet. But you can still sell your pi coins effortlessly because some whales in China are interested in holding massive pi coins. And they are willing to pay good money for it. If you are interested in selling I will leave a contact for you. Just what'sapp this number below. I sold about 3000 pi coins to him and he paid me immediately.
+12349014282
how to sell pi coins effectively (from 50 - 100k pi)DOT TECH
Anywhere in the world, including Africa, America, and Europe, you can sell Pi Network Coins online and receive cash through online payment options.
Pi has not yet been launched on any exchange because we are currently using the confined Mainnet. The planned launch date for Pi is June 28, 2026.
Reselling to investors who want to hold until the mainnet launch in 2026 is currently the sole way to sell.
Consequently, right now. All you need to do is select the right pi network provider.
Who is a pi merchant?
An individual who buys coins from miners on the pi network and resells them to investors hoping to hang onto them until the mainnet is launched is known as a pi merchant.
debuts.
I'll provide you the what'sapp number.
+12349014282
when will pi network coin be available on crypto exchange.DOT TECH
There is no set date for when Pi coins will enter the market.
However, the developers are working hard to get them released as soon as possible.
Once they are available, users will be able to exchange other cryptocurrencies for Pi coins on designated exchanges.
But for now the only way to sell your pi coins is through verified pi vendor.
Here is the what'sapp contact of my personal pi vendor
+12349014282
BYD SWOT Analysis and In-Depth Insights 2024.pptxmikemetalprod
Indepth analysis of the BYD 2024
BYD (Build Your Dreams) is a Chinese automaker and battery manufacturer that has snowballed over the past two decades to become a significant player in electric vehicles and global clean energy technology.
This SWOT analysis examines BYD's strengths, weaknesses, opportunities, and threats as it competes in the fast-changing automotive and energy storage industries.
Founded in 1995 and headquartered in Shenzhen, BYD started as a battery company before expanding into automobiles in the early 2000s.
Initially manufacturing gasoline-powered vehicles, BYD focused on plug-in hybrid and fully electric vehicles, leveraging its expertise in battery technology.
Today, BYD is the world’s largest electric vehicle manufacturer, delivering over 1.2 million electric cars globally. The company also produces electric buses, trucks, forklifts, and rail transit.
On the energy side, BYD is a major supplier of rechargeable batteries for cell phones, laptops, electric vehicles, and energy storage systems.
where can I find a legit pi merchant onlineDOT TECH
Yes. This is very easy what you need is a recommendation from someone who has successfully traded pi coins before with a merchant.
Who is a pi merchant?
A pi merchant is someone who buys pi network coins and resell them to Investors looking forward to hold thousands of pi coins before the open mainnet.
I will leave the what'sapp contact of my personal pi merchant to trade with
+12349014282
BONKMILLON Unleashes Its Bonkers Potential on Solana.pdfcoingabbar
Introducing BONKMILLON - The Most Bonkers Meme Coin Yet
Let's be real for a second – the world of meme coins can feel like a bit of a circus at times. Every other day, there's a new token promising to take you "to the moon" or offering some groundbreaking utility that'll change the game forever. But how many of them actually deliver on that hype?
Turin Startup Ecosystem 2024 - Ricerca sulle Startup e il Sistema dell'Innov...Quotidiano Piemontese
Turin Startup Ecosystem 2024
Una ricerca de il Club degli Investitori, in collaborazione con ToTeM Torino Tech Map e con il supporto della ESCP Business School e di Growth Capital
2. Sesa Goa Limited is multinational iron-ore producer and exporter with
operations in the states of Goa and Karnataka in India and
in Liberia, West Africa. It is India's largest producer and exporter of iron
ore in the private sector, with production of above 21 million tonnes of
iron ore in fiscal year 2010.
3. An expression that breaks return on equity (ROE) down into three
parts:
Profit margin, Total assets turnover and financial leverage. It is also
known as “Du Pont Analysis”
ROE: Profit margin(Profit/sales)*total assets
turnover(sales/assets)*equity multiplier(assets/equity)
If ROE is unsatisfactory, the Du pont identify helps locate the part of
the business that is underperforming
4. The amount of net income returned as a percentage of shareholders equity.
Return on equity measures a corporation's profitability by revealing how much
profit a company generates with the money shareholders have invested.
ROE is expressed as a percentage and calculated as:
Return on Equity = Net Income/Shareholder's Equity
Year 1 2 3 4 5
ROE: 0.130095 0.296217 0.2938237 0.4299656 0.5345505
6. A performance measure used to evaluate the efficiency of an investment
or to compare the efficiency of a number of different investments. To
calculate ROI, the benefit (return) of an investment is divided by the cost
of the investment; the result is expressed as a percentage or a ratio.
The return on investment formula:
ROI = Earning After Tax/ Net Worth
Year 1 2 3 4 5
ROI: 0.199106 0.412867 0.3754739 0.7132414 0.9304583
8. An indicator of how profitable a company is relative to its total assets.
ROA gives an idea as to how efficient management is at using its assets
to generate earnings. Calculated by dividing a company's annual earnings
by its total assets, ROA is displayed as a percentage. Sometimes this is
referred to as "return on investment".
The formula for return on assets is:
ROA = Net Income/ Net Assets
Year 1 2 3 4 5
ROA: 0.101739 0.273309 0.2318778 0.4297839 0.5345505
10. The percent of earnings credited to retained earnings. In other
words, the proportion of net income that is not paid out as
dividends.
Calculated as:
Net Income – Dividend/ Net Income
11. The highest level of growth achievable for a business without obtaining
outside financing. A firm's maximum internal growth rate is the level at
which growth from general business operations can continue to fund and
grow the company. For startup firms and small business the internal
growth rate is an important ratio to follow, since it measures a firm's
profitable increase in top-line revenues.
Formula : IGR = ROA.b/1-(ROA.b)
Where:
b : Retention ratio
Year 1 2 3 4 5
IGR: 0.100131 0.342337 0.2673445 0.6826936 0.9866455
13. The maximum growth rate that a firm can sustain without having to
increase financial leverage.
Calculated as:
SGR = ROE.b/1-(ROE.b)
Where
b : Retention ratio
Year 1 2 3 4 5
SGR : 0.131716 0.38199 0.3648211 0.6831794 0.9866455