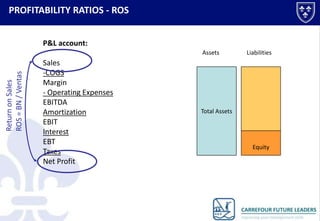
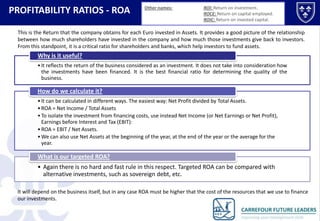
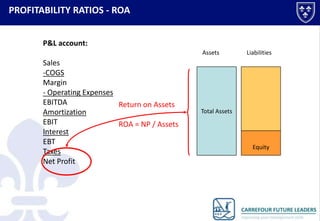
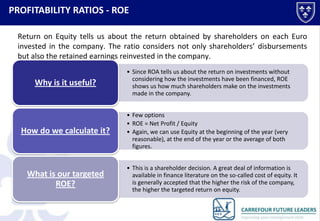
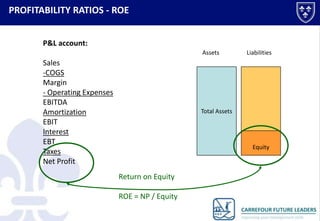
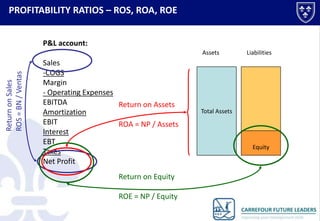
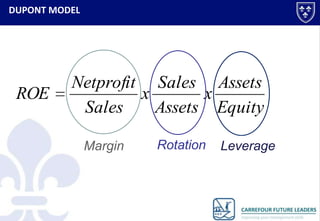
© Instituto Internacional San Telmo, 2012

DU PONT AND OTHER RATIOS
PROFITABILITY RATIOS

Profit and Loss account ratios
How can we compare net profit?
– We can compare it with Sales: Return on Sales (ROS)
– We can compare it with Assets: Return on Assets (ROA)
– We can compare it with Equity: Return on Equity (ROE)
PROFITABILITY RATIOS - ROS
Return on Sales is the ratio between Profit and Sales or, in other
words, the percentage of each sale finally obtained as profit.
Why is it useful?

• ROS can be considered as a good approximation of average
return.
• ROS shows us how far/close we are to losing money, i.e. if
small deviations in income or expenses can take the company
to a net loss position.

How do we calculate it?

• The most common formula is to use Net profit over sales
• ROS = Net profit / Sales
• Another option would be to use Profit Before Interest and
Taxes if we want to focus on the business without taking into
consideration the cost of debt and taxes.

What should our targeted
ROS be?

• There are no fixed rules. It will depend on the risk of the
business; the higher the risk, the higher the targeted ROS.

It is very common to compare the company’s ROS
with that of its competitors or benchmark.
PROFITABILITY RATIOS - ROS
P&L account:

Return on Sales
ROS = BN / Ventas

Assets

Sales
-COGS
Margin
- Operating Expenses
EBITDA
Amortization
EBIT
Interest
EBT
Taxes
Net Profit

Liabilities

Total Assets

Equity
PROFITABILITY RATIOS - ROA

Other names:

ROI: Return on investment.
ROCE: Return on capital employed.
ROIC: Return on invested capital.

This is the Return that the company obtains for each Euro invested in Assets. It provides a good picture of the relationship
between how much shareholders have invested in the company and how much those investments give back to investors.
From this standpoint, it is a critical ratio for shareholders and banks, which help investors to fund assets.

Why is it useful?
• It reflects the return of the business considered as an investment. It does not take into consideration how
the investments have been financed. It is the best financial ratio for determining the quality of the
business.

How do we calculate it?
• It can be calculated in different ways. The easiest way: Net Profit divided by Total Assets.
• ROA = Net Income / Total Assets
• To isolate the investment from financing costs, use instead Net Income (or Net Earnings or Net Profit),
Earnings before Interest and Tax (EBIT):
• ROA = EBIT / Net Assets.
• We can also use Net Assets at the beginning of the year, at the end of the year or the average for the
year.

What is our targeted ROA?
• Again there is no hard and fast rule in this respect. Targeted ROA can be compared with
alternative investments, such as sovereign debt, etc.
It will depend on the business itself, but in any case ROA must be higher that the cost of the resources that we use to finance
our investments.
PROFITABILITY RATIOS - ROA
P&L account:
Assets

Sales
-COGS
Margin
- Operating Expenses
EBITDA
Return on Assets
Amortization
EBIT
ROA = NP / Assets
Interest
EBT
Taxes
Net Profit

Liabilities

Total Assets

Equity
PROFITABILITY RATIOS - ROE
Return on Equity tells us about the return obtained by shareholders on each Euro
invested in the company. The ratio considers not only shareholders’ disbursements
but also the retained earnings reinvested in the company.

Why is it useful?

• Since ROA tells us about the return on investments without
considering how the investments have been financed, ROE
shows us how much shareholders make on the investments
made in the company.

How do we calculate it?

• Few options
• ROE = Net Profit / Equity
• Again, we can use Equity at the beginning of the year (very
reasonable), at the end of the year or the average of both
figures.

What is our targeted
ROE?

• This is a shareholder decision. A great deal of information is
available in finance literature on the so-called cost of equity. It
is generally accepted that the higher the risk of the company,
the higher the targeted return on equity.
PROFITABILITY RATIOS - ROE
P&L account:
Assets

Sales
-COGS
Margin
- Operating Expenses
EBITDA
Amortization
EBIT
Interest
EBT
Taxes
Net Profit

Liabilities

Total Assets

Equity

Return on Equity
ROE = NP / Equity
PROFITABILITY RATIOS – ROS, ROA, ROE
P&L account:

Return on Sales
ROS = BN / Ventas

Assets

Sales
-COGS
Margin
- Operating Expenses
EBITDA
Return on Assets
Amortization
EBIT
ROA = NP / Assets
Interest
EBT
Taxes
Net Profit
Return on Equity
ROE = NP / Equity

Liabilities

Total Assets

Equity
DUPONT MODEL

ROE

Netprofit Sales Assets
x
x
Sales
Assets Equity
Margin

Rotation

Leverage
© Instituto Internacional San Telmo, 2012

B2 - Du pont and other ratios

  • 1.
    © Instituto InternacionalSan Telmo, 2012 DU PONT AND OTHER RATIOS
  • 2.
    PROFITABILITY RATIOS Profit andLoss account ratios How can we compare net profit? – We can compare it with Sales: Return on Sales (ROS) – We can compare it with Assets: Return on Assets (ROA) – We can compare it with Equity: Return on Equity (ROE)
  • 3.
    PROFITABILITY RATIOS -ROS Return on Sales is the ratio between Profit and Sales or, in other words, the percentage of each sale finally obtained as profit. Why is it useful? • ROS can be considered as a good approximation of average return. • ROS shows us how far/close we are to losing money, i.e. if small deviations in income or expenses can take the company to a net loss position. How do we calculate it? • The most common formula is to use Net profit over sales • ROS = Net profit / Sales • Another option would be to use Profit Before Interest and Taxes if we want to focus on the business without taking into consideration the cost of debt and taxes. What should our targeted ROS be? • There are no fixed rules. It will depend on the risk of the business; the higher the risk, the higher the targeted ROS. It is very common to compare the company’s ROS with that of its competitors or benchmark.
  • 4.
    PROFITABILITY RATIOS -ROS P&L account: Return on Sales ROS = BN / Ventas Assets Sales -COGS Margin - Operating Expenses EBITDA Amortization EBIT Interest EBT Taxes Net Profit Liabilities Total Assets Equity
  • 5.
    PROFITABILITY RATIOS -ROA Other names: ROI: Return on investment. ROCE: Return on capital employed. ROIC: Return on invested capital. This is the Return that the company obtains for each Euro invested in Assets. It provides a good picture of the relationship between how much shareholders have invested in the company and how much those investments give back to investors. From this standpoint, it is a critical ratio for shareholders and banks, which help investors to fund assets. Why is it useful? • It reflects the return of the business considered as an investment. It does not take into consideration how the investments have been financed. It is the best financial ratio for determining the quality of the business. How do we calculate it? • It can be calculated in different ways. The easiest way: Net Profit divided by Total Assets. • ROA = Net Income / Total Assets • To isolate the investment from financing costs, use instead Net Income (or Net Earnings or Net Profit), Earnings before Interest and Tax (EBIT): • ROA = EBIT / Net Assets. • We can also use Net Assets at the beginning of the year, at the end of the year or the average for the year. What is our targeted ROA? • Again there is no hard and fast rule in this respect. Targeted ROA can be compared with alternative investments, such as sovereign debt, etc. It will depend on the business itself, but in any case ROA must be higher that the cost of the resources that we use to finance our investments.
  • 6.
    PROFITABILITY RATIOS -ROA P&L account: Assets Sales -COGS Margin - Operating Expenses EBITDA Return on Assets Amortization EBIT ROA = NP / Assets Interest EBT Taxes Net Profit Liabilities Total Assets Equity
  • 7.
    PROFITABILITY RATIOS -ROE Return on Equity tells us about the return obtained by shareholders on each Euro invested in the company. The ratio considers not only shareholders’ disbursements but also the retained earnings reinvested in the company. Why is it useful? • Since ROA tells us about the return on investments without considering how the investments have been financed, ROE shows us how much shareholders make on the investments made in the company. How do we calculate it? • Few options • ROE = Net Profit / Equity • Again, we can use Equity at the beginning of the year (very reasonable), at the end of the year or the average of both figures. What is our targeted ROE? • This is a shareholder decision. A great deal of information is available in finance literature on the so-called cost of equity. It is generally accepted that the higher the risk of the company, the higher the targeted return on equity.
  • 8.
    PROFITABILITY RATIOS -ROE P&L account: Assets Sales -COGS Margin - Operating Expenses EBITDA Amortization EBIT Interest EBT Taxes Net Profit Liabilities Total Assets Equity Return on Equity ROE = NP / Equity
  • 9.
    PROFITABILITY RATIOS –ROS, ROA, ROE P&L account: Return on Sales ROS = BN / Ventas Assets Sales -COGS Margin - Operating Expenses EBITDA Return on Assets Amortization EBIT ROA = NP / Assets Interest EBT Taxes Net Profit Return on Equity ROE = NP / Equity Liabilities Total Assets Equity
  • 10.
    DUPONT MODEL ROE Netprofit SalesAssets x x Sales Assets Equity Margin Rotation Leverage
  • 11.