This document discusses various methods for valuing a corporate business, including:
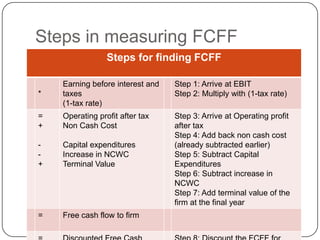
1. The discounted cash flow method, which values a business based on its future free cash flows discounted at the firm's weighted average cost of capital.
2. Relative valuation methods like comparable company analysis and comparable transaction analysis, which derive valuation multiples from similar public companies or M&A transactions.
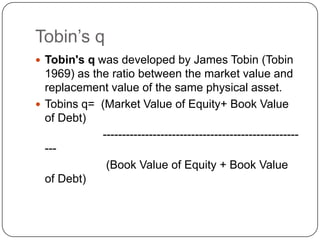
3. Other methods like the net asset value approach and Tobin's Q, which value a business based on its asset book values.
The document provides steps and considerations for each method to determine a company's economic worth based on its financials, industry, and investment characteristics.
Corporate Valuations “Techniques & Application”: A compilation of research oriented valuation articles.
Contents: Business valuation, Relative valuation, Sum of the parts valuation and value creation, ESOP valuation, Discounted Cash Flow Valuation, Enterprise Valuation etc.
This presentation is an overview of Capital Structure Theories.
Dr. Soheli Ghose ( Ph.D (University of Calcutta), M.Phil, M.Com, M.B.A., NET (JRF), B. Ed).
Assistant Professor, Department of Commerce,St. Xavier's College, Kolkata.
Guest Faculty, M.B.A. Finance, University of Calcutta, Kolkata
This analysis is an important tool used to optimize the capital structure for highest earnings for shareholders
It helps in understanding the sensitivity of EPS at given level of Earning before Interest & Tax under different sources of financing
It helps in analyzing how capital structure decision is important to raise the value of firm
An optimal financing structure minimizes the cost of capital and maximizes the earnings
Earning Per Share under different Capital structure plans
Plan 1 ( Only Equity Shares )
EPS = (EBIT (1−Tax rate))/(No. of Outstanding Shares)
Plan 2 ( Equity Shares & Debt )
EPS = ((EBIT −Interest) (1−Tax rate))/(No. of Outstanding Shares)
Plan 3 (Equity, Debt & Preference Shares)
EPS = ((EBIT −Interest) (1−Tax rate)−Pref. Dividend)/(No. of Outstanding Shares)
Plan 4 (Equity shares & Preference Shares)
EPS = (EBIT (1−Tax rate)−Pref. Dividend)/(No. of Outstanding Shares)
Thank You For Waching
Subscribe to DevTech Finance
A dividend is a payment made by a corporation to its shareholders, usually as a distribution of profits. Dividends are important for more than income generation: they also provide a way for investors to assess a company as an investment prospect. Dividend and market price of shares are interrelated. However, there are two schools of thought: while one school of thought opines that dividend has an impact on the value of the firm, another school argues that the amount of dividend paid has no effect on the valuation of firm.
The first school of thought refers to the Relevance of dividend while the other one relates to the Irrelevance of dividend.
Relevance includes: 1. Walter Valuation Model 2.GORDON’S MODEL.
Business Valuation PowerPoint Presentation SlidesSlideTeam
Presenting this set of slides with name - Business Valuation PowerPoint Presentation Slides. The stages in this process are Business Valuation, Financial Analysis, Economic Valuation.
Company 1Company #1Income StatementBalance SheetAll numbers in thoLynellBull52
Company 1Company #1Income StatementBalance SheetAll numbers in thousandsAll numbers in thousandsRevenue20182017Period Ending20182017Total Revenue14,134,73212,866,757Current AssetsCost of Revenue9,510,2388,668,505Cash And Cash Equivalents1,290,2941,111,599Gross Profit4,624,4944,198,252Short Term Investments512-Operating ExpensesNet Receivables87,86875,154Selling General and Administrative2,576,0982,395,608Inventory1,641,7351,512,886Total Operating Expenses12,086,33611,064,113Other Current Assets11,84713,642Operating Income or Loss2,048,3961,802,644Total Current Assets3,151,1572,813,049Income from Continuing OperationsLong Term Investments7121,288Total Other Income/Expenses Net-7,676-16,488Property Plant and Equipment2,382,4642,328,048Earnings Before Interest and Taxes2,048,3961,802,644Other Assets187,718166,966Interest Expense-18,847-19,569Deferred Long Term Asset Charges--Income Before Tax2,040,7201,786,156Total Assets5,722,0515,309,351Income Tax Expense677,967668,502Current LiabilitiesNet Income1,362,7531,117,654Accounts Payable1,059,8441,021,735Short/Current Long Term Debt84,973-Other Current Liabilities9,90224,559Total Current Liabilities1,926,4021,752,506Long Term Debt311,994396,493Other Liabilities434,347412,335Total Liabilities2,672,7432,561,334Stockholders' EquityPreferred Stock--Common Stock3,7963,919Retained Earnings2,071,4001,801,138Treasury Stock-318,252-272,755Capital Surplus1,292,3911,215,806Total Stockholder Equity3,049,3082,748,017Net Tangible Assets3,049,3082,748,017
Company 2Company #2Income StatementBalance SheetAll numbers in thousandsAll numbers in thousandsRevenue20182017Period Ending20182017Total Revenue38,972,93435,864,664Current AssetsCost of Revenue27,831,17725,502,167Cash And Cash Equivalents3,030,2002,758,477Gross Profit11,141,75710,362,497Short Term Investments-506,165Operating ExpensesNet Receivables860,000327,166Selling General and Administrative6,923,5646,375,071Inventory4,579,0004,187,243Total Operating Expenses34,754,74131,877,238Other Current Assets-12,217Operating Income or Loss4,218,1933,987,426Total Current Assets8,469,2008,485,727Income from Continuing OperationsLong Term Investments--Total Other Income/Expenses Net-44,982-130,838Property Plant and Equipment5,255,2005,006,053Earnings Before Interest and Taxes4,218,1933,987,426Goodwill97,600100,069Interest Expense-8,860-64,295Intangible Assets-144,900Income Before Tax4,173,2113,856,588Other Assets504,000321,266Income Tax Expense1,113,4131,248,640Deferred Long Term Asset Charges-6,558Net Income3,059,7982,607,948Total Assets14,326,00014,058,015Current LiabilitiesAccounts Payable2,644,1002,488,373Short/Current Long Term Debt--Other Current Liabilities-1,429,136Total Current Liabilities5,531,3005,125,537Long Term Debt2,233,6002,230,607Other Liabilities1,512,5001,331,645Total Liabilities9,277,4008,909,706Stockholders' EquityPreferred Stock--Common Stock5,048,600628,009Retained Earnings-4,962,159Treasury Stock--441,859Capital Surplus--Other Stockholder Equity--4 ...
Compute IRR and NPV in Microsoft Excel 1.IRR Function .docxmccormicknadine86
Compute IRR and NPV in Microsoft Excel
1.IRR Function
Description:
The Microsoft Excel IRR function returns the internal rate of return for a series of cash flows. The cash
flows must occur at regular intervals, but do not have to be the same amounts for each interval.
Syntax
The syntax for the IRR function in Microsoft Excel is:
IRR(range, [estimated_irr] )
Parameters or Arguments
range
A range of cells that represent the series of cash flows.
estimated_irr
Optional. It is your guess at the internal rate of return. If this parameter is omitted, it
assumes an estimated_irr of 0.1 or 10%
Example (as Worksheet Function)
Let's look at some Excel IRR function examples and explore how to use the IRR function as a
worksheet function in Microsoft Excel:
Based on the Excel spreadsheet above:
This first example returns an internal rate of return of 28%. It assumes that you start a
business at a cost of $7,500. You net the following income for the first four years: $3,000,
$5,000, $1,200, and $4,000.
This next example returns an internal rate of return of 5%. It assumes that you start a
business at a cost of $10,000. You net the following income for the first three years: $3,400,
$6,500, and $1,000.
=IRR(B1:B4)
Result: 5%
2.NPV Function
Description
The Microsoft Excel NPV function returns the net present value of an investment.
Syntax
The syntax for the NPV function in Microsoft Excel is:
NPV( discount_rate, value1, [value2, ... value_n] )
Parameters or Arguments
discount_rate
The discount rate for the period.
value1, value2, ... value_n
The future payments and income for the investment (ie: cash flows). There can be up
to 29 values entered.
Note
Microsoft Excel's NPV function does not account for the intial cash outlay, or may account for
it improperly depending on the version of Excel. However, there is a workaround.
This workaround requires that you NOT include the initial investment in the future
payments/income for the investment (ie: value1, value2, ... value_n), but instead, you need to
subtract from the result of the NPV function, the amount of the initial investment.
The workaround formula is also different depending on whether the cash flows occur at the
end of the period (EOP) or at the beginning of the period (BOP).
If the cash flows occur at the end of the period (EOP), you would use the following formula:
=NPV( discount_rate, value1, value2, ... value_n ) - Initial Investment
If the cash flows occur at the beginning of the period (BOP), ou would use the following
formula:
=NPV( discount_rate, value2, ... value_n ) - Initial Investment + value1
Example (as Worksheet Function)
Let's look at some NPV examples and explore how to use the NPV function as a worksheet
function in Microsoft Excel:
This first example returns a net present value of $3,457.19. It assumes that you pay $7,500
as an initial investment . You then receive the following in ...
Compute IRR and NPV in Microsoft Excel 1.IRR Function .docxpatricke8
Compute IRR and NPV in Microsoft Excel
1.IRR Function
Description:
The Microsoft Excel IRR function returns the internal rate of return for a series of cash flows. The cash
flows must occur at regular intervals, but do not have to be the same amounts for each interval.
Syntax
The syntax for the IRR function in Microsoft Excel is:
IRR(range, [estimated_irr] )
Parameters or Arguments
range
A range of cells that represent the series of cash flows.
estimated_irr
Optional. It is your guess at the internal rate of return. If this parameter is omitted, it
assumes an estimated_irr of 0.1 or 10%
Example (as Worksheet Function)
Let's look at some Excel IRR function examples and explore how to use the IRR function as a
worksheet function in Microsoft Excel:
Based on the Excel spreadsheet above:
This first example returns an internal rate of return of 28%. It assumes that you start a
business at a cost of $7,500. You net the following income for the first four years: $3,000,
$5,000, $1,200, and $4,000.
This next example returns an internal rate of return of 5%. It assumes that you start a
business at a cost of $10,000. You net the following income for the first three years: $3,400,
$6,500, and $1,000.
=IRR(B1:B4)
Result: 5%
2.NPV Function
Description
The Microsoft Excel NPV function returns the net present value of an investment.
Syntax
The syntax for the NPV function in Microsoft Excel is:
NPV( discount_rate, value1, [value2, ... value_n] )
Parameters or Arguments
discount_rate
The discount rate for the period.
value1, value2, ... value_n
The future payments and income for the investment (ie: cash flows). There can be up
to 29 values entered.
Note
Microsoft Excel's NPV function does not account for the intial cash outlay, or may account for
it improperly depending on the version of Excel. However, there is a workaround.
This workaround requires that you NOT include the initial investment in the future
payments/income for the investment (ie: value1, value2, ... value_n), but instead, you need to
subtract from the result of the NPV function, the amount of the initial investment.
The workaround formula is also different depending on whether the cash flows occur at the
end of the period (EOP) or at the beginning of the period (BOP).
If the cash flows occur at the end of the period (EOP), you would use the following formula:
=NPV( discount_rate, value1, value2, ... value_n ) - Initial Investment
If the cash flows occur at the beginning of the period (BOP), ou would use the following
formula:
=NPV( discount_rate, value2, ... value_n ) - Initial Investment + value1
Example (as Worksheet Function)
Let's look at some NPV examples and explore how to use the NPV function as a worksheet
function in Microsoft Excel:
This first example returns a net present value of $3,457.19. It assumes that you pay $7,500
as an initial investment . You then receive the following in.
BlueBookAcademy.com - Value companies using Discounted Cash Flow Valuationbluebookacademy
In this slideshow on valuing companies using discounted cash flows (DCF), we'll run through the most popular valuation tool used by investment bankers, traders and investors to compute the value of a company's shares and make stock recommendations.
As a fundamental concept in finance, DCF models have wider applications in valuing bonds (fixed income) and in project appraisal.
Financial Statement Analysis Project
Valuation
Valuation
The last step of the project is to valuate the company and determine the buy price
We are going to introduce two valuation systems:
Margin of Safety price
Buy price based on Owner Earnings
2
Margin of Safety (MOS) Price
Step 1: EPS Trailing 12 month (EPS TTM)
Sum of EPS from the most recent 4 quarters (from Yahoo Finance or 10-Q)
Step 2: Future Growth Rate (FGR) – Key Parameter
You have calculated annual growth rates of Book Value, EPS, CFO, and Sales per share
Use these growth rates to come up your estimate of FGR (you just need to ball park a FGR, and it will be a rough estimate)
Your estimated FGR should be <= Analysts’ forecast of future growth
Step 3: Future EPS=EPS TTM × (1+FGR)10
Projected EPS in 10 years
Margin of Safety (MOS) Price
Step 4: Future P/E Ratio= 2 × FGR
Should be capped at historical high P/E ratio
Step 5: Future Value= Future EPS × Future P/E Ratio
Projected firm value in 10 years
Step 6: Fair Price= Future Value ÷ 4
Company’s fair value today
We want our money to double up every 5 years
Step 7: MOS Price= Fair price × 50%
I can help you with analysts’ forecast of FGR and historical high P/E ratio, as it can be challenging for you to find out
Buy Price based on Owner Earnings
This is the valuation method Buffett uses and explained in his 1986 Letter to Berkshire’s shareholders
We think of businesses like many people think of a real estate investment – a money making machine based on net profits generated
One way to look at a business is by analyzing cash flow generated after certain expenses. If you can keep a good profit after expenses and expect it to continue in the future, you have a good deal.
Buffett defines this cash flow as “Owner Earnings.”
We are looking to buy a great company at a price that will earn a 10% return (=Owner earnings) every year
Compute Owner Earnings
Pretax Income
+ Depreciation and Amortization
+/- Changes in Accounts Receivable
+/- Changes in Inventories
+/- Changes in Accounts Payable
- Maintenance CapEx (Total CapEx with Growth CapEx taken out)
----------------------
= Owner Earnings
Maintenance CapEx
Maintenance CapEx is the money the company spent to replace worn out property and equipment for the last fiscal year.
In real estate, this is like replacement of roof, countertop, carpet, and furnaces, etc.
The money spent on acquiring more real estate properties is Growth CapEx.
Most companies, however, do not separately report maintenance CapEx.
So we need to read 10-K to help us identify the maintenance CapEx.
Entry Point
Now you have two buy prices calculated. If your company is a great company you would like to own for the next 10 years, wait now until an event puts the company on sale
Great companies are often priced high (e.g., Costco, Chipotle, Ulta), and we don’t chase the stock
An event is an incident that causes the company’s stock price to decline sharply and puts the comp.
Related to chp 13 of fundamental of financial management . The Chapter is about cashflows of corporation. It helps to calculate initial, interim and Terminal cashflows. Later IRR and NPV method is applied. Helps you to easily understand chapter numerical. Is a guide to prepare for exam in a last minute. The Chapter includes self exercise and problems
2. Basic Concept
Business Valuation is the process of
determining the "Economic Worth" of a
Company based on its Business Model and
External environment and supported with
reasons and empirical evidence.
Corporate valuation depends upon
1. Purpose of valuation
2. Stage of Business
3. Past financials
4. Expected financial results
5. Industry scenario
3. Approach to Valuation
Discounted free cash flow method
Relative Valuation (Comparable company market
multiple method)
Comparable Transactions (Mergers & Acquisition)
Multiple (CTM) method
Price of recent investment method
Net asset value method (NAV)
4. Discounted Free Cash Flow
Method
Two alternative approach can be used
1. Measuring the discounted cash flow to the firm
2. Measuring the discounted cash flow to equity
Discounted Free Cash flow to the firm
The DFCF to firm method expresses the present
value of the business attributable to all claimants
(like equity shareholders, debt holders, preference
shareholders, warrants etc) as a function of its
future cash earning capacity.
This methodology work on the premise that the
value of business is measured in terms of future
cash flow streams, discounted to the present time at
appropriate discount rate
This approach seeks to measure the intrinsic ability
of the business to generate cash attributable to all
the claimants.
5. Discounted Free Cash Flow
Method
Discounted Free Cash flow to equity
The DFCF to firm method expresses the present
value of the business attributable to equity
shareholders as a function of its future cash
earning capacity.
The value of equity is arrived at by estimating the
free cash flow to equity and discounting the same
at the cost of equity
6. Steps in measuring FCFF
Steps for finding FCFF
Earning before interest and Step 1: Arrive at EBIT
* taxes Step 2: Multiply with (1-tax rate)
(1-tax rate)
= Operating profit after tax Step 3: Arrive at Operating profit
+ Non Cash Cost after tax
Step 4: Add back non cash cost
- Capital expenditures (already subtracted earlier)
- Increase in NCWC Step 5: Subtract Capital
+ Terminal Value Expenditures
Step 6: Subtract increase in
NCWC
Step 7: Add terminal value of the
firm at the final year
= Free cash flow to firm
7. Steps in measuring FCFE
Steps for finding FCFFE
Profit Before Tax Step 1: Arrive at PBT
- Taxes Step 2: Less taxes
= Profit After Tax Step 3: Arrive at PAT
+ Non Cash Cost Step 4: Add back non cash cost
(already subtracted earlier)
- Capital expenditures Step 5: Subtract Capital
- Increase in NCWC Expenditures
± Changes in Debts Step 6: Subtract increase in
NCWC
+ Terminal Value Step7: Take into account the effect
of changes in debt
Step 8: Add terminal accruing to
equity holder at the final year
= Free cash flow to equity
= Discounted Free Cash Step 8: Discount the FCFE for
8. Arriving at cost of capital
Key things to remember
Cost of capital for the firm should be comparable
with firm with similar business and financial risk
CAPM can be utilized to calculate ß debt, ß
equity ß asset for publicly listed firm from the
historical data. Hence beta have a historical
character
Return on risk free security can be estimated
based on 10 year Indian Government Bond Yield
Equity risk premium can be arrived from market
information for the return on broad based index
for a comparable period
9. Comparable company market
(CCM)multiple method
CCM multiple method uses the valuation ratios of a
publicly traded company and applies that ratio to the
company being valued
The valuation ratio typically expresses the valuation
as a function of measure of financial performance or
book value (e.g. turnover, EBIDTA, EBIT, EPS or book
value)
Methodology is based on current market stock price
Limitations:
1. Difficulty in selecting comparable firms with similar
business and financial risk (EBIDTA or Cash Flow)
2. Measuring the multiple (mean or median value can
be used)
10. Comparable Transactions (M&A)
Method (MTM)
This methodology helps in arriving the value of
the company on the basis of similar deals
matured in the market
This provides and indicative value as it helps in
reaching the value which market is providing to
similar companies
Can be arrived through sales multiple, EBIDTA
multiples or PAT multiples
11. NAV Method
NAV is the net value of all the assets of the company.
If you divide it by the number of outstanding shares,
you get the NAV per share.
One way to calculate NAV is to divide the net worth of
the company by the total number of outstanding
shares. Say, a company’s share capital is Rs. 100
crores (10 crores shares of Rs. 10 each) and its
reserves and surplus is another Rs. 100 crores. Net
worth of the company would be Rs. 200 crores (equity
and reserves) and NAV would be Rs. 20 per share
(Rs. 200 crores divided by 10 crores outstanding
shares).
NAV can also be calculated by adding all the assets
and subtracting all the outside liabilities from them.
This will again boil down to net worth only. One can
use any of the two methods to find out NAV.
12. Tobin’s q
Tobin's q was developed by James Tobin (Tobin
1969) as the ratio between the market value and
replacement value of the same physical asset.
Tobins q= (Market Value of Equity+ Book Value
of Debt)
---------------------------------------------------
---
(Book Value of Equity + Book Value
of Debt)