Download as PDF, PPTX

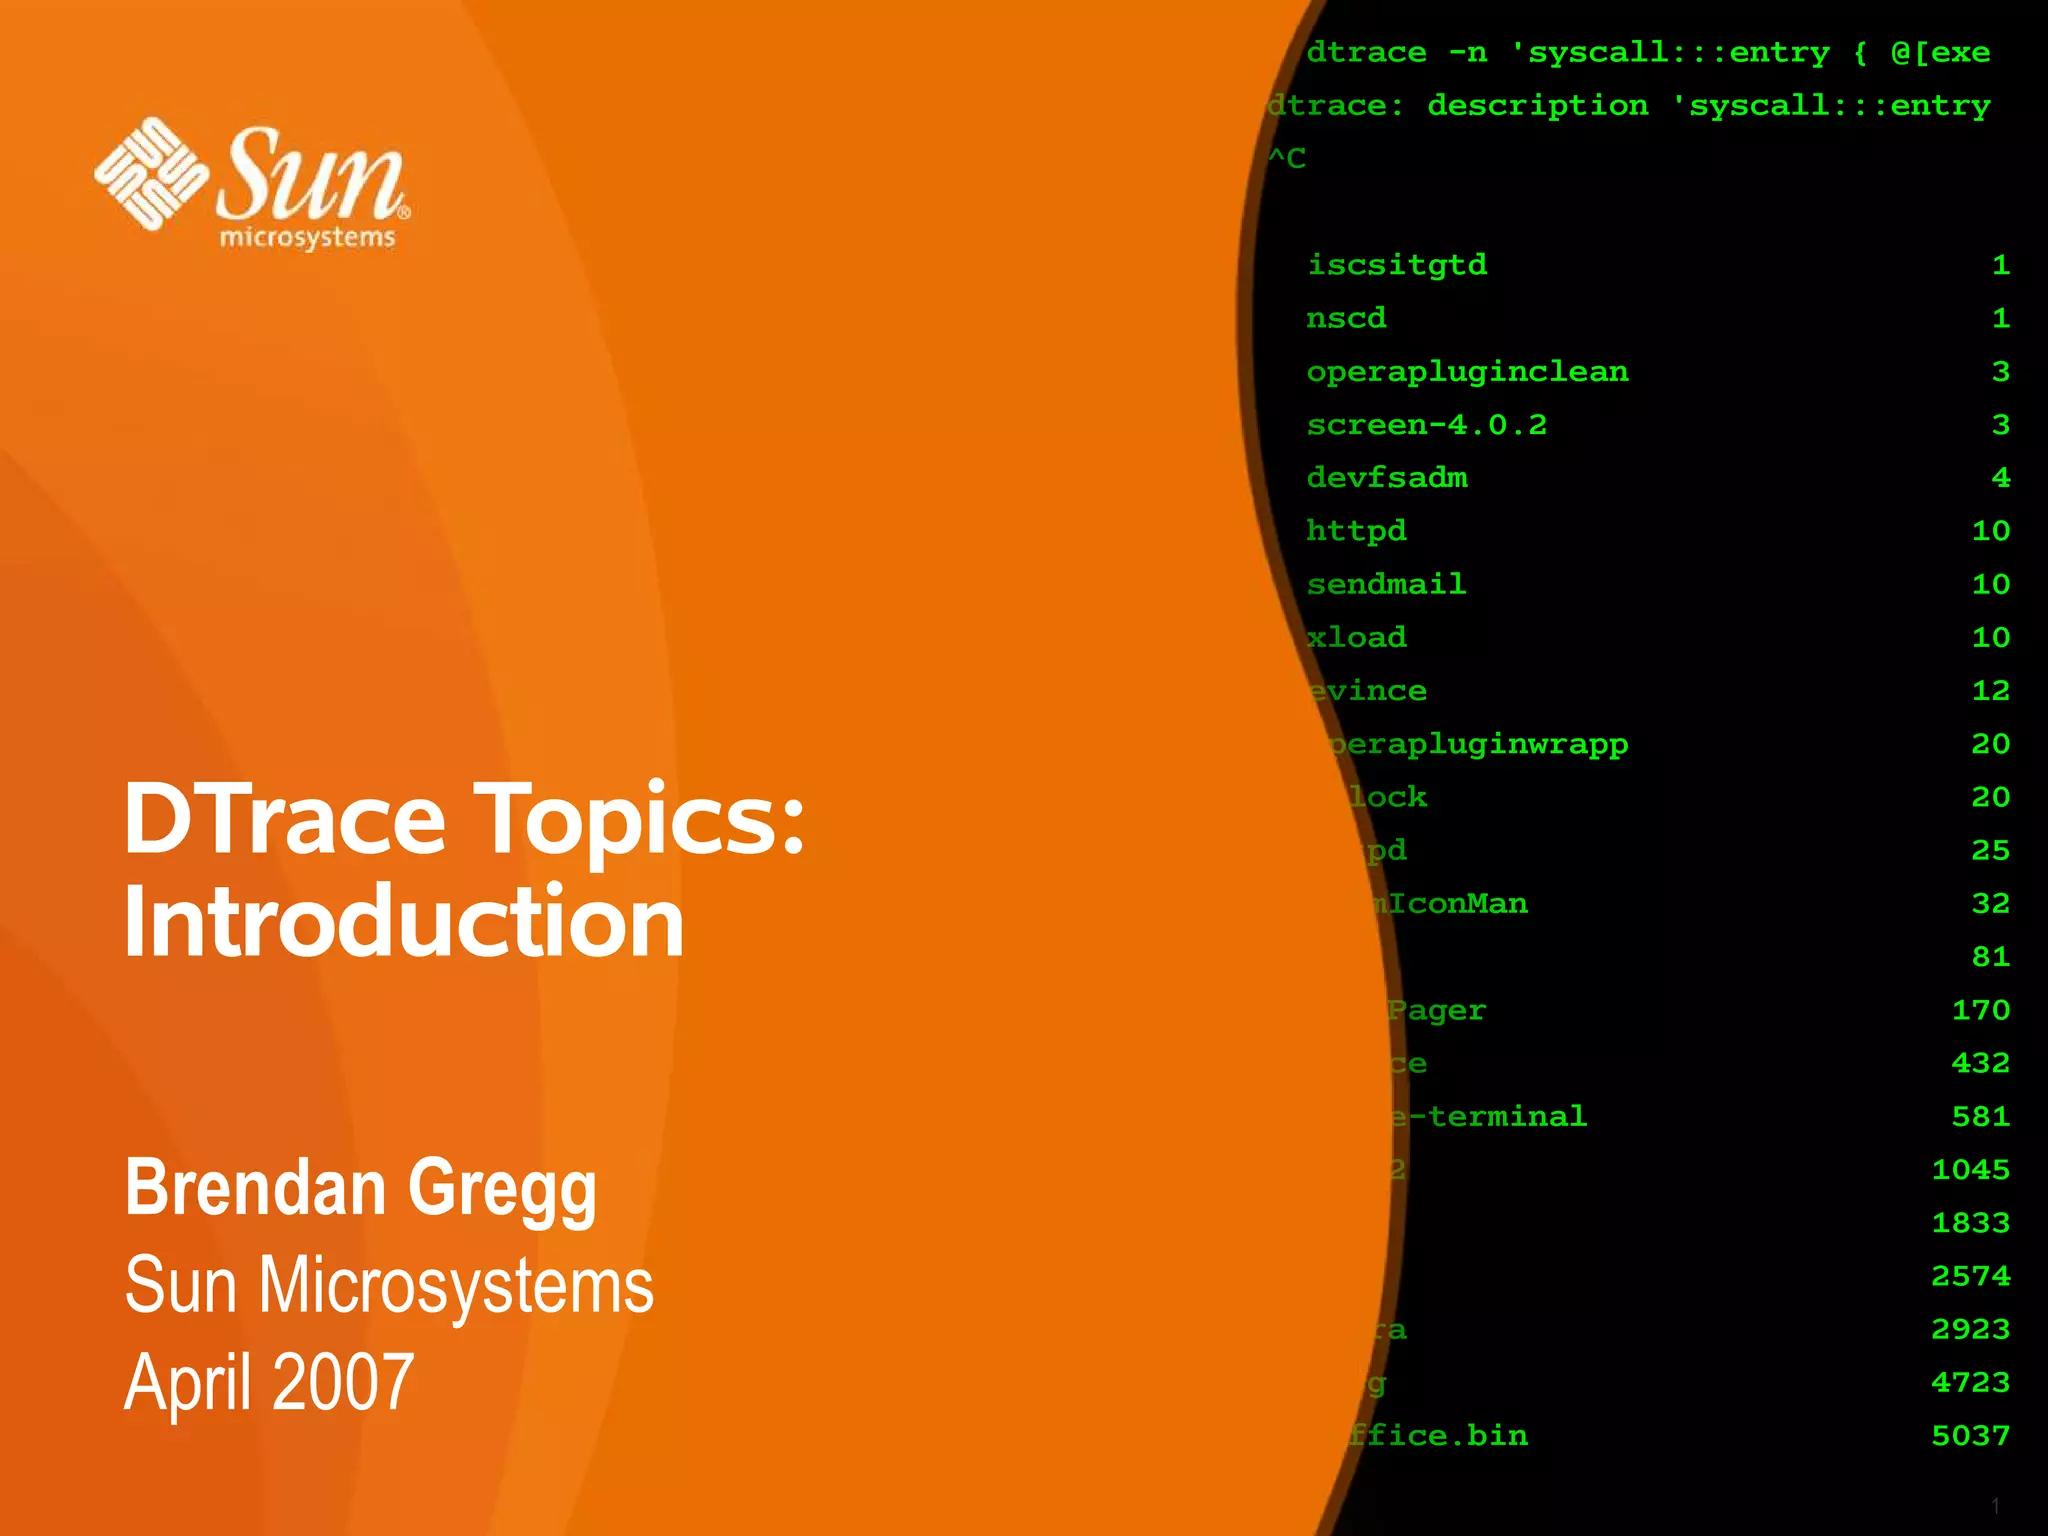
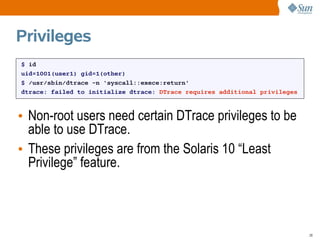
![Syscall Example
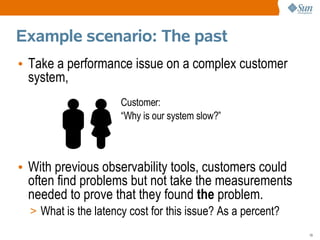
• Using truss,
Only examine 1 process
$ truss date
execve("/usr/bin/date", 0x08047C9C, 0x08047CA4) argc = 1 Output is
resolvepath("/usr/lib/ld.so.1", "/lib/ld.so.1", 1023) = 12
resolvepath("/usr/bin/date", "/usr/bin/date", 1023) = 13
limited to
xstat(2, "/usr/bin/date", 0x08047A58) = 0 provided
open("/var/ld/ld.config", O_RDONLY) = 3
fxstat(2, 3, 0x08047988) = 0
options
mmap(0x00000000, 152, PROT_READ, MAP_SHARED, 3, 0) = 0xFEFB0000
close(3) = 0
mmap(0x00000000, 4096, PROT_READ|PROT_WRITE|PROT_EXEC, MAP_PRIVATE|MAP_ANON, -1
sysconfig(_CONFIG_PAGESIZE) = 4096
[...]
truss slows down the target
9](https://image.slidesharecdn.com/dtracetopicsintro-120813162807-phpapp02/85/DTrace-Topics-Introduction-9-320.jpg)
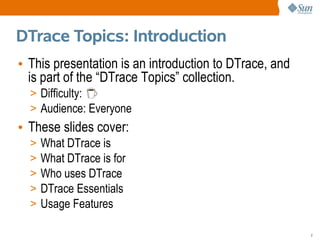
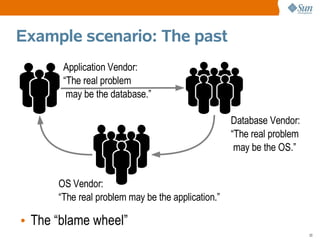
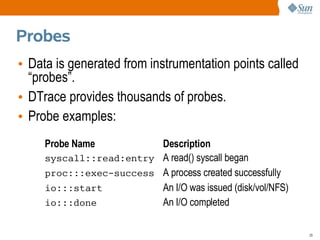
![Syscall Example
• Using DTrace,
You choose the output
# dtrace -n 'syscall:::entry { printf("%16s %x %x", execname, arg0, arg1); }'
dtrace: description 'syscall:::entry ' matched 233 probes
CPU ID FUNCTION:NAME
1 75943 read:entry Xorg f 8047130
1 76211 setitimer:entry Xorg 0 8047610
1 76143 writev:entry Xorg 22 80477f8
1 76255 pollsys:entry Xorg 8046da0 1a
1 75943 read:entry Xorg 22 85121b0
1 76035 ioctl:entry soffice.bin 6 5301
1 76035 ioctl:entry soffice.bin 6 5301
1 76255 pollsys:entry soffice.bin 8047530 2
[...]
Minimum performance cost Watch every process
10](https://image.slidesharecdn.com/dtracetopicsintro-120813162807-phpapp02/85/DTrace-Topics-Introduction-10-320.jpg)
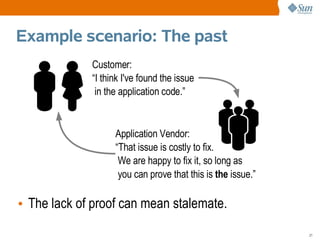
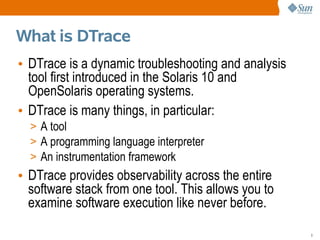
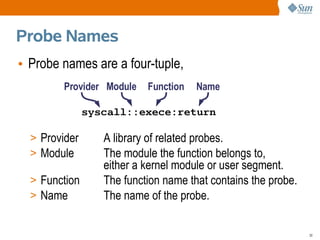
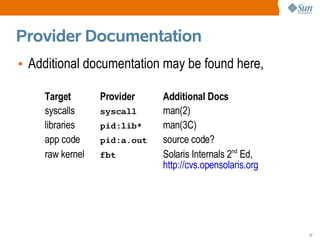
![Terminology
• Example #1
consumer probe action
# dtrace -n 'syscall::exece:return { trace(execname); }'
dtrace: description 'syscall::exece:return ' matched 1 probe
CPU ID FUNCTION:NAME
0 76044 exece:return man
0 76044 exece:return sh
0 76044 exece:return neqn
0 76044 exece:return tbl
0 76044 exece:return nroff
[...]
26](https://image.slidesharecdn.com/dtracetopicsintro-120813162807-phpapp02/85/DTrace-Topics-Introduction-26-320.jpg)
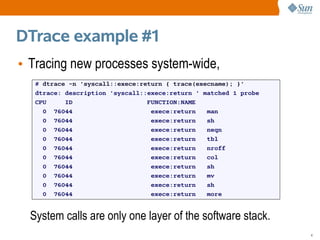
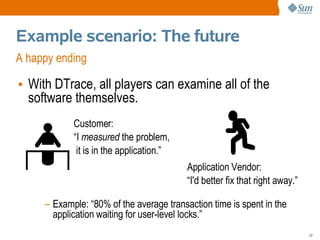
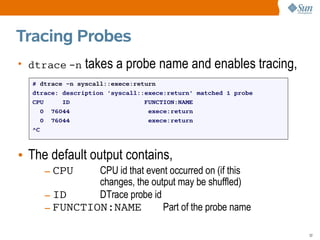
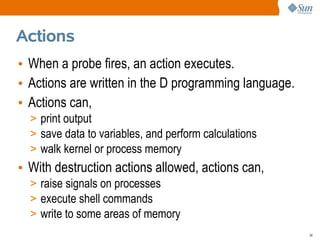
![Listing Probes
• dtrace -l lists all currently available probes that
you have privilege to see, with one probe per line,
# dtrace -l
ID PROVIDER MODULE FUNCTION NAME
1 dtrace BEGIN
2 dtrace END
3 dtrace ERROR
4 sched FX fx_yield schedctl-yi
[...]
# dtrace -l | wc -l
69880
• Here the root user sees 69,879 available probes.
• The probe count changes – it is dynamic (DTrace).
31](https://image.slidesharecdn.com/dtracetopicsintro-120813162807-phpapp02/85/DTrace-Topics-Introduction-31-320.jpg)
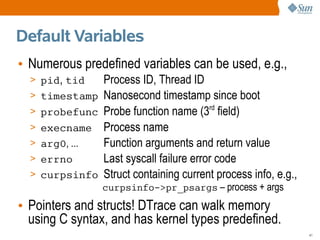
![trace() Example
# dtrace -n 'syscall::exece:return { trace(execname); }'
dtrace: description 'syscall::exece:return ' matched 1 probe
CPU ID FUNCTION:NAME
0 76044 exece:return man
0 76044 exece:return sh
0 76044 exece:return neqn
0 76044 exece:return tbl
0 76044 exece:return nroff
0 76044 exece:return col
[...]
• The trace() action accepts one argument and prints
it when the probe fired.
39](https://image.slidesharecdn.com/dtracetopicsintro-120813162807-phpapp02/85/DTrace-Topics-Introduction-39-320.jpg)
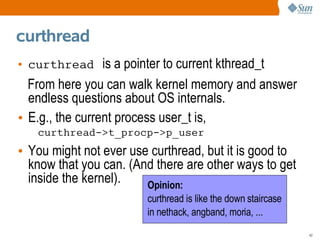
![printf() Example
# dtrace -n 'syscall::exece:return { printf("%6d %sn", pid, execname); }'
dtrace: description 'syscall::exece:return ' matched 1 probe
CPU ID FUNCTION:NAME
0 74415 exece:return 4301 sh
0 74415 exece:return 4304 neqn
0 74415 exece:return 4305 nroff
0 74415 exece:return 4306 sh
0 74415 exece:return 4308 sh
[...]
• DTrace ships with a powerful printf(), to print
formatted output.
40](https://image.slidesharecdn.com/dtracetopicsintro-120813162807-phpapp02/85/DTrace-Topics-Introduction-40-320.jpg)
![Aggregations
• A great feature of DTrace is to process data as it is
captured, such as using aggregations.
• E.g., frequency counting syscalls,
# dtrace -n 'syscall:::entry { @num[probefunc] = count(); }'
dtrace: description 'syscall:::entry ' matched 233 probes
^C
[...]
writev 170
write 257
read 896
pollsys 959
ioctl 1253
@num is the aggregation variable, probefunc is the key,
and count() is the aggregating function.
44](https://image.slidesharecdn.com/dtracetopicsintro-120813162807-phpapp02/85/DTrace-Topics-Introduction-44-320.jpg)
![Quantize
• Very cool function, here we quantize write sizes:
# dtrace -n 'sysinfo:::writech { @dist[execname] = quantize(arg0); }'
dtrace: description 'sysinfo:::writech ' matched 4 probes
^C
[...]
ls
value ------------- Distribution ------------- count
4 | 0
8 | 2
16 | 0
32 |@@@@@@@@@@@@@@@@@@@ 118
64 |@@@@@@@@@@@@@@@@@@@@@ 127
128 | 0
[...]
• Here we see that ls processes usually write
between 32 and 127 bytes. Makes sense?
46](https://image.slidesharecdn.com/dtracetopicsintro-120813162807-phpapp02/85/DTrace-Topics-Introduction-46-320.jpg)
![ls -l
# ls -l /etc
dttotal 793
lrwxrwxrwx 1 root root 12 Mar 21 03:28 TIMEZONE -> default/init
drwxr-xr-x 4 root sys 6 Apr 16 06:59 X11
drwxr-xr-x 2 adm adm 3 Mar 20 09:25 acct
drwxr-xr-x 3 root root 3 Apr 16 23:11 ak
lrwxrwxrwx 1 root root 12 Mar 21 03:28 aliases -> mail/aliases
drwxr-xr-x 5 root sys 5 Feb 20 23:29 amd64
drwxr-xr-x 7 root bin 18 Mar 20 09:20 apache
drwxr-xr-x 4 root bin 7 Feb 20 23:12 apache2
drwxr-xr-x 2 root sys 5 Feb 20 23:27 apoc
-rw-r--r-- 1 root bin 1012 Mar 20 09:33 auto_home
-rw-r--r-- 1 root bin 1066 Mar 20 09:33 auto_master
lrwxrwxrwx 1 root root 16 Mar 21 03:28 autopush -> ../sbin/autopu
[...]
ls writes one line at a time, each around 80 chars long.
47](https://image.slidesharecdn.com/dtracetopicsintro-120813162807-phpapp02/85/DTrace-Topics-Introduction-47-320.jpg)
![Predicates
• DTrace predicates are used to filter probes, so that
the action fires when a conditional is true.
probename /predicate/ { action }
• E.g., syscalls for processes called “bash”,
# dtrace -n 'syscall:::entry /execname == "bash"/ { @num[probefunc] =
count(); }'
dtrace: description 'syscall:::entry ' matched 233 probes
^C
exece 2
[...]
read 29
write 31
lwp_sigmask 42
sigaction 62
48](https://image.slidesharecdn.com/dtracetopicsintro-120813162807-phpapp02/85/DTrace-Topics-Introduction-48-320.jpg)
![Scripting
• If your one-liners get too long, write scripts. E.g.,
bash-syscalls.d,
#!/usr/sbin/dtrace -s
syscall:::entry
/execname == "bash"/
{
@num[probefunc] = count();
}
• Getting it running,
# chmod 755 bash-syscalls.d
# ./bash-syscalls.d
dtrace: script './bash-syscalls.d' matched 233 probes
[...]
49](https://image.slidesharecdn.com/dtracetopicsintro-120813162807-phpapp02/85/DTrace-Topics-Introduction-49-320.jpg)
![Printing Stacks
• Printing user and kernel stack traces explains both
why and the how something happened.
• Why is bash calling read()? Using ustack(),
# dtrace -n 'syscall::read:entry /execname == "bash"/ { ustack(); }'
dtrace: description 'syscall::read:entry ' matched 1 probe
CPU ID FUNCTION:NAME
0 74314 read:entry
libc.so.1`_read+0x7
bash`rl_getc+0x22
bash`rl_read_key+0xad
bash`readline_internal_char+0x5f
bash`0x80b1171
bash`0x80b118c
bash`readline+0x3a
[...] Ahh, readline()
52](https://image.slidesharecdn.com/dtracetopicsintro-120813162807-phpapp02/85/DTrace-Topics-Introduction-52-320.jpg)
![Sampling
• DTrace isn't just about tracing events, DTrace can
also sample at customised rates.
• E.g., sampling 5-level user stack traces from Xorg,
# dtrace -n 'profile-1001 /execname == "Xorg"/ { @[ustack(5)] = count(); }'
dtrace: description 'profile-1001 ' matched 1 probe
^C
libfb.so`fbSolid+0x2c6
libfb.so`fbFill+0xb8
libfb.so`fbPolyFillRect+0x1d5
nvidia_drv.so`0xfe09e87b
Xorg`miColorRects+0x124
41
nvidia_drv.so`_nv000592X+0x3d nvidia was on-CPU
0x1016c00
87 87 times
53](https://image.slidesharecdn.com/dtracetopicsintro-120813162807-phpapp02/85/DTrace-Topics-Introduction-53-320.jpg)


This document provides an overview of DTrace, a dynamic troubleshooting and analysis tool introduced in Solaris 10, highlighting its capabilities for software observability across the entire stack. It details its use cases for developers, system administrators, and engineers in identifying performance issues, monitoring applications, and gathering profiling data. Additionally, it explains the implementation of probes and actions for effective tracing and debugging, along with practical examples demonstrating DTrace's functionality.


![[PDF] 2021 Termux basic commands list](https://cdn.slidesharecdn.com/ss_thumbnails/termuxbasiccommands-devilshacking1-210429200803-thumbnail.jpg?width=640&height=640&fit=bounds)