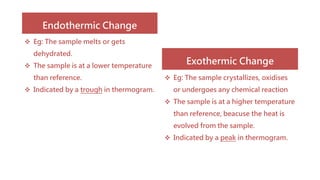
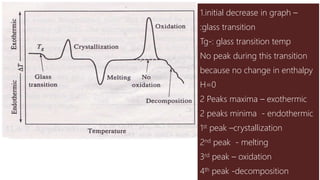
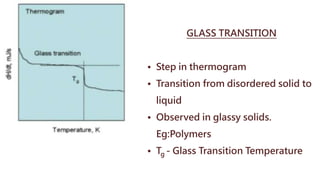
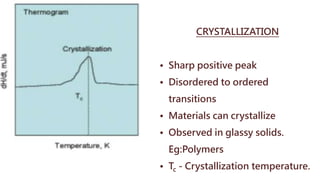
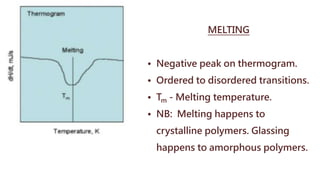
DIFFERENTIAL THERMAL
ANALYSIS
SUBMITTED BY :
RINSHANA FATHIMA ABDUL AZEEZ
FIRST YEAR M.PHARM
PHARMACEUTICAL CHEMISTRY
AL SHIFA COLLEGE OF PHARMACY
DTA is based on the
between the sample and an inert
reference substance (like glass beads, Al2O3, etc.) as
they are both subjected to the same controlled heating
or cooling programme , generally linear w.r.t. time.
Thus the sample and reference have a zero
temperature difference as long as the sample
does not undergo any chemical / physical
change.
The temperature difference ΔT between the
sample temperature and the reference
temperature is recorded and plotted
against sample temperture to give a
thermogram.
However, if a reaction takes place, then a
temperature difference (ΔT) would exist
between the sample and reference.
Endothermic Change
 Eg: The sample melts or gets
dehydrated.
 The sample is at a lower temperature
than reference.
 Indicated by a trough in thermogram.
Exothermic Change
 Eg: The sample crystallizes, oxidises
or undergoes any chemical reaction
 The sample is at a higher temperature
than reference, beacuse the heat is
evolved from the sample.
 Indicated by a peak in thermogram.
1.initial decrease in graph –
:glass transition
Tg-: glass transition temp
No peak during this transition
because no change in enthalpy
H=0
2 Peaks maxima – exothermic
2 peaks minima - endothermic
1st peak –crystallization
2nd peak - melting
3rd peak – oxidation
4th peak -decomposition
GLASS TRANSITION
• Step in thermogram
• Transition from disordered solid to
liquid
• Observed in glassy solids.
Eg:Polymers
• Tg - Glass Transition Temperature
CRYSTALLIZATION
• Sharp positive peak
• Disordered to ordered
transitions
• Materials can crystallize
• Observed in glassy solids.
Eg:Polymers
• Tc - Crystallization temperature.
MELTING
• Negative peak on thermogram.
• Ordered to disordered transitions.
• Tm - Melting temperature.
• NB: Melting happens to
crystalline polymers. Glassing
happens to amorphous polymers.
Instrument for differential thermal analysis
INSTRUMENTATION
• It includes furnace heating programmes and recording
devices.
Procedure:
1. Weighed quantities of sample and reference are held in small
pans. Pans made up of aluminium.
2. Pans located above the sample and reference thermocouple
in electrically heated furnace.
3. Thermocouple controls the heating of furnace.
4. The sample and reference thermocouples connected in
series.
5. Current produced because of temperature difference b/w S
&R is amplified.
6. Used to determine the position of recorder pen.
• The samples may be studied as powders, fibers, single
crystals, polymers films, semisolids or as liquids.
• The technique has been applied to different type of samples
such as minerals, inorganic compounds, polymers,
pharmaceuticals, food stuffs and biological specimens.
• Determination of phase diagrams, heat change
measurements and decomposition in various atmospheres.
• To date bone remains or to study archaeological materials.
• In Cement Chemistry and in environmental studies
• To study ferroelectric tansitions.
• DTA Curves for two substances are not identical. Hence, they
serve as finger prints for various substances.
• Used for testing the purity of drug samples and also to test
quality control of a number of substances like cement, soil,
glass, etc.
• Determination of heat of reaction, specific heat and energy
changes occuring during melting, etc
• Detection of impurities.
• To study the characteristics of polymeric materials.
1. BASIC CONCEPTS OF ANALYTICAL CHEMISTRY by S.M khopkar,
revised second edition page no:360-373.
2. ANALYTICAL CHEMISTRY, INSTRUMENTAL TECHNIQUES by Mahinder
singh,1st edition, page no:176-187.
3. PRINCIPLES OF INSTRUMENTAL ANALYSIS, by Skoog, Holler,
Nieman.5th edition page no:799-809.
THANK YOU!

DTA - Differential Thermal Analysis

  • 1.
    DIFFERENTIAL THERMAL ANALYSIS SUBMITTED BY: RINSHANA FATHIMA ABDUL AZEEZ FIRST YEAR M.PHARM PHARMACEUTICAL CHEMISTRY AL SHIFA COLLEGE OF PHARMACY
  • 2.
    DTA is basedon the between the sample and an inert reference substance (like glass beads, Al2O3, etc.) as they are both subjected to the same controlled heating or cooling programme , generally linear w.r.t. time. Thus the sample and reference have a zero temperature difference as long as the sample does not undergo any chemical / physical change.
  • 4.
    The temperature differenceΔT between the sample temperature and the reference temperature is recorded and plotted against sample temperture to give a thermogram. However, if a reaction takes place, then a temperature difference (ΔT) would exist between the sample and reference.
  • 5.
    Endothermic Change  Eg:The sample melts or gets dehydrated.  The sample is at a lower temperature than reference.  Indicated by a trough in thermogram. Exothermic Change  Eg: The sample crystallizes, oxidises or undergoes any chemical reaction  The sample is at a higher temperature than reference, beacuse the heat is evolved from the sample.  Indicated by a peak in thermogram.
  • 6.
    1.initial decrease ingraph – :glass transition Tg-: glass transition temp No peak during this transition because no change in enthalpy H=0 2 Peaks maxima – exothermic 2 peaks minima - endothermic 1st peak –crystallization 2nd peak - melting 3rd peak – oxidation 4th peak -decomposition
  • 7.
    GLASS TRANSITION • Stepin thermogram • Transition from disordered solid to liquid • Observed in glassy solids. Eg:Polymers • Tg - Glass Transition Temperature
  • 8.
    CRYSTALLIZATION • Sharp positivepeak • Disordered to ordered transitions • Materials can crystallize • Observed in glassy solids. Eg:Polymers • Tc - Crystallization temperature.
  • 9.
    MELTING • Negative peakon thermogram. • Ordered to disordered transitions. • Tm - Melting temperature. • NB: Melting happens to crystalline polymers. Glassing happens to amorphous polymers.
  • 10.
  • 11.
    INSTRUMENTATION • It includesfurnace heating programmes and recording devices. Procedure: 1. Weighed quantities of sample and reference are held in small pans. Pans made up of aluminium. 2. Pans located above the sample and reference thermocouple in electrically heated furnace.
  • 12.
    3. Thermocouple controlsthe heating of furnace. 4. The sample and reference thermocouples connected in series. 5. Current produced because of temperature difference b/w S &R is amplified. 6. Used to determine the position of recorder pen.
  • 13.
    • The samplesmay be studied as powders, fibers, single crystals, polymers films, semisolids or as liquids. • The technique has been applied to different type of samples such as minerals, inorganic compounds, polymers, pharmaceuticals, food stuffs and biological specimens. • Determination of phase diagrams, heat change measurements and decomposition in various atmospheres. • To date bone remains or to study archaeological materials. • In Cement Chemistry and in environmental studies
  • 14.
    • To studyferroelectric tansitions. • DTA Curves for two substances are not identical. Hence, they serve as finger prints for various substances. • Used for testing the purity of drug samples and also to test quality control of a number of substances like cement, soil, glass, etc. • Determination of heat of reaction, specific heat and energy changes occuring during melting, etc • Detection of impurities. • To study the characteristics of polymeric materials.
  • 15.
    1. BASIC CONCEPTSOF ANALYTICAL CHEMISTRY by S.M khopkar, revised second edition page no:360-373. 2. ANALYTICAL CHEMISTRY, INSTRUMENTAL TECHNIQUES by Mahinder singh,1st edition, page no:176-187. 3. PRINCIPLES OF INSTRUMENTAL ANALYSIS, by Skoog, Holler, Nieman.5th edition page no:799-809.
  • 16.