The mean represents the average value of the dataset. It can be calculated as the sum of all the values in the dataset divided by the number of values.
Geometric Mean
Harmonic Mean
Weighted Mean
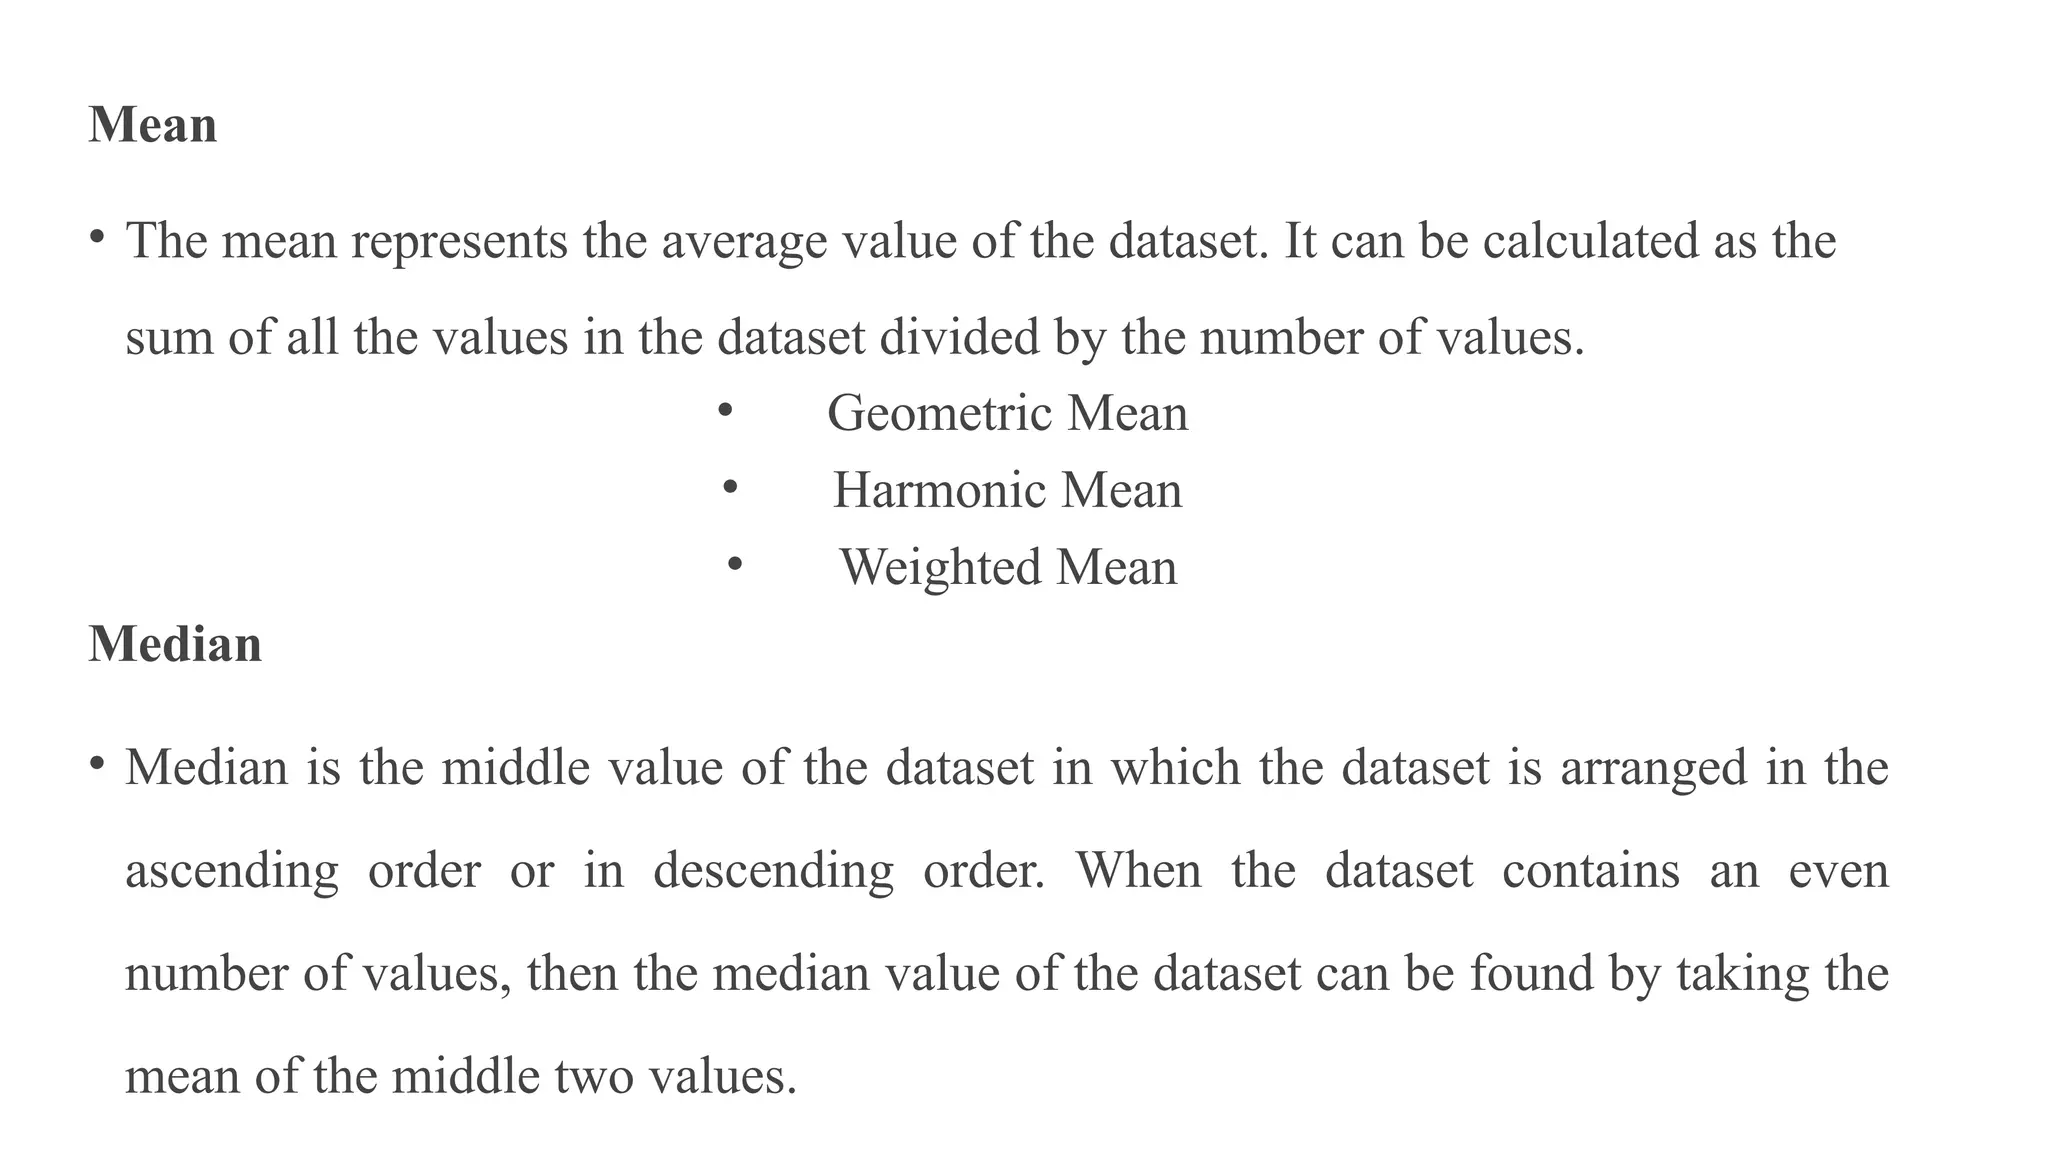
Mean
• The meanrepresents the average value of the dataset. It can be calculated as the
sum of all the values in the dataset divided by the number of values.
• Geometric Mean
• Harmonic Mean
• Weighted Mean
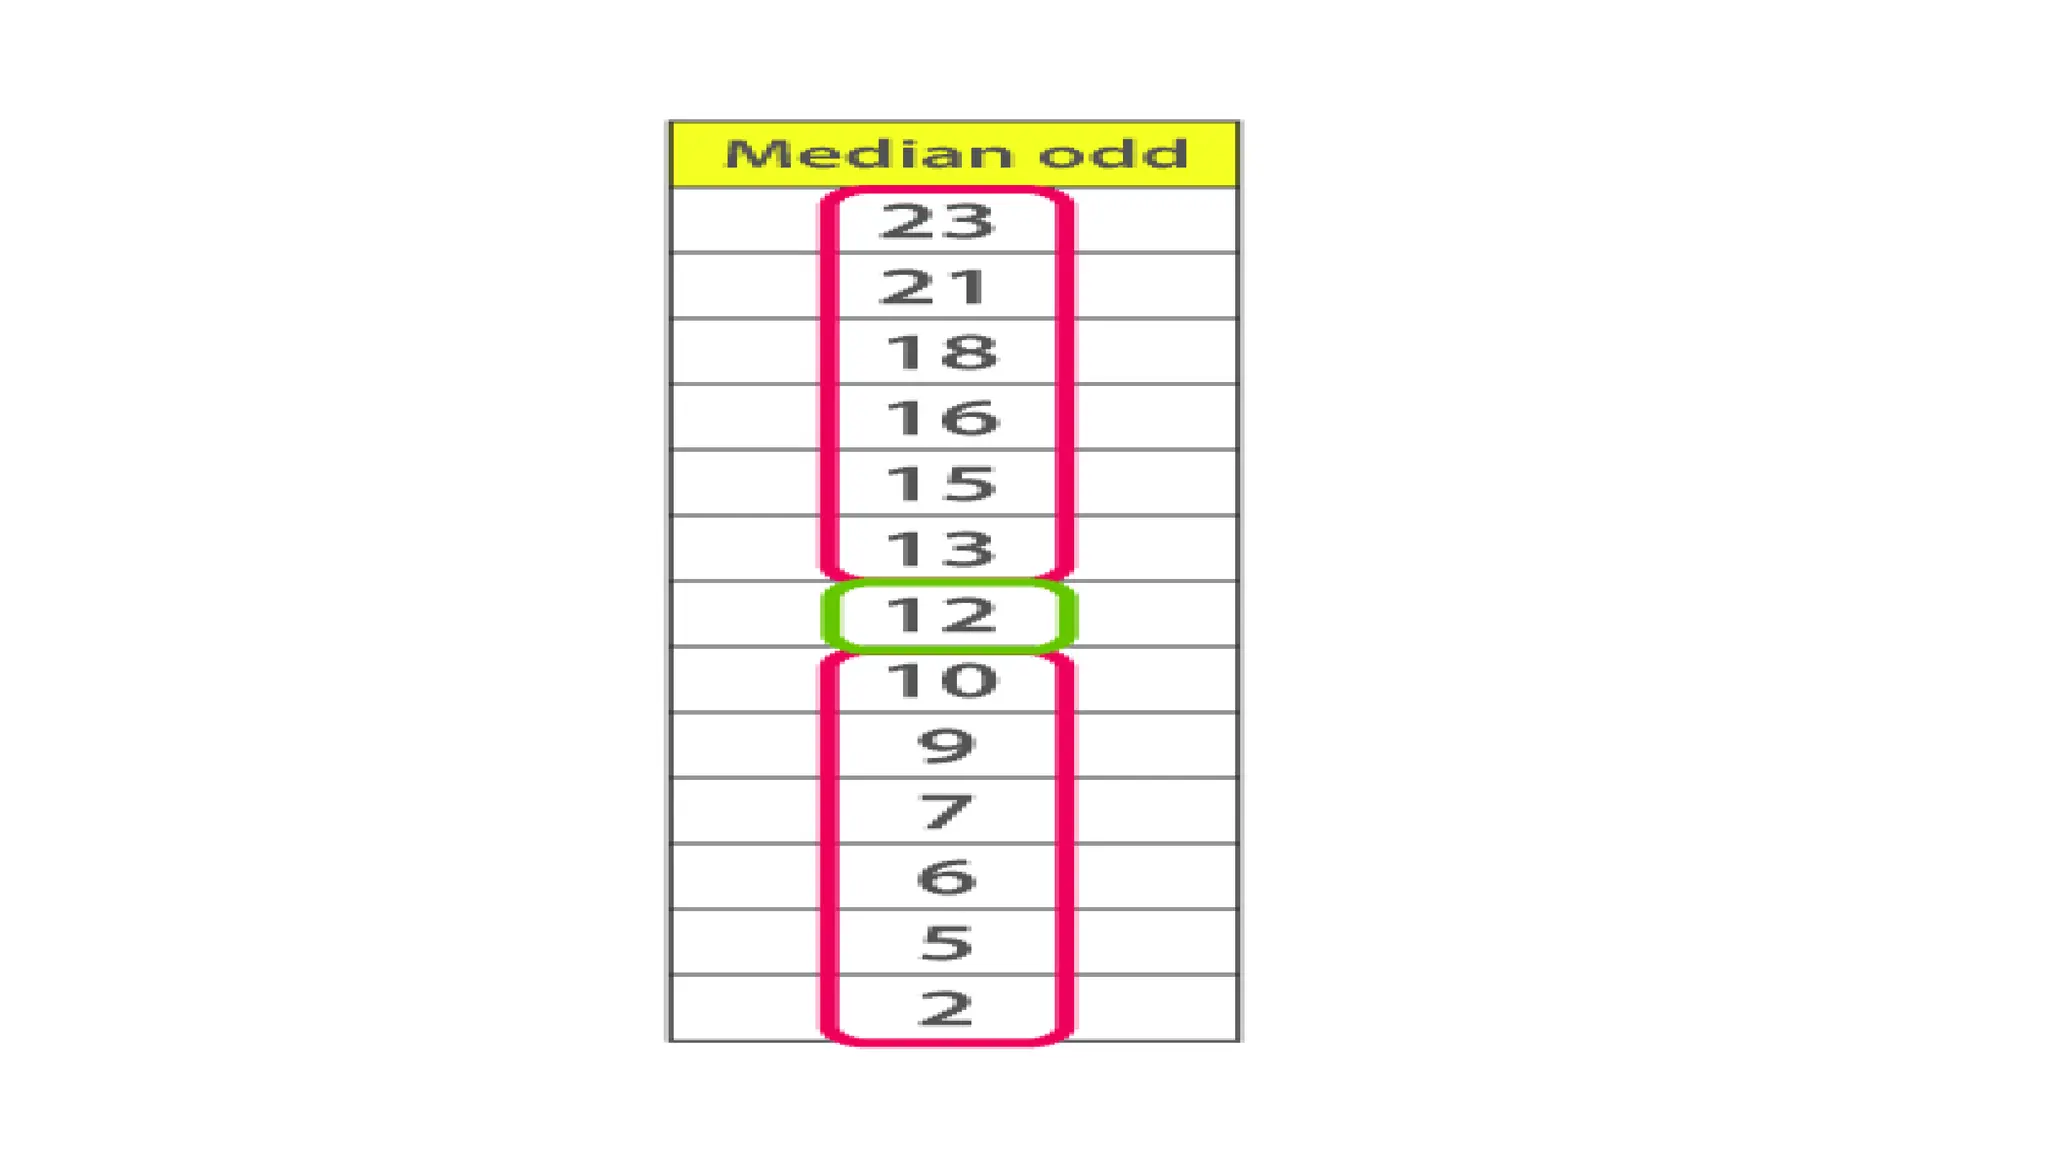
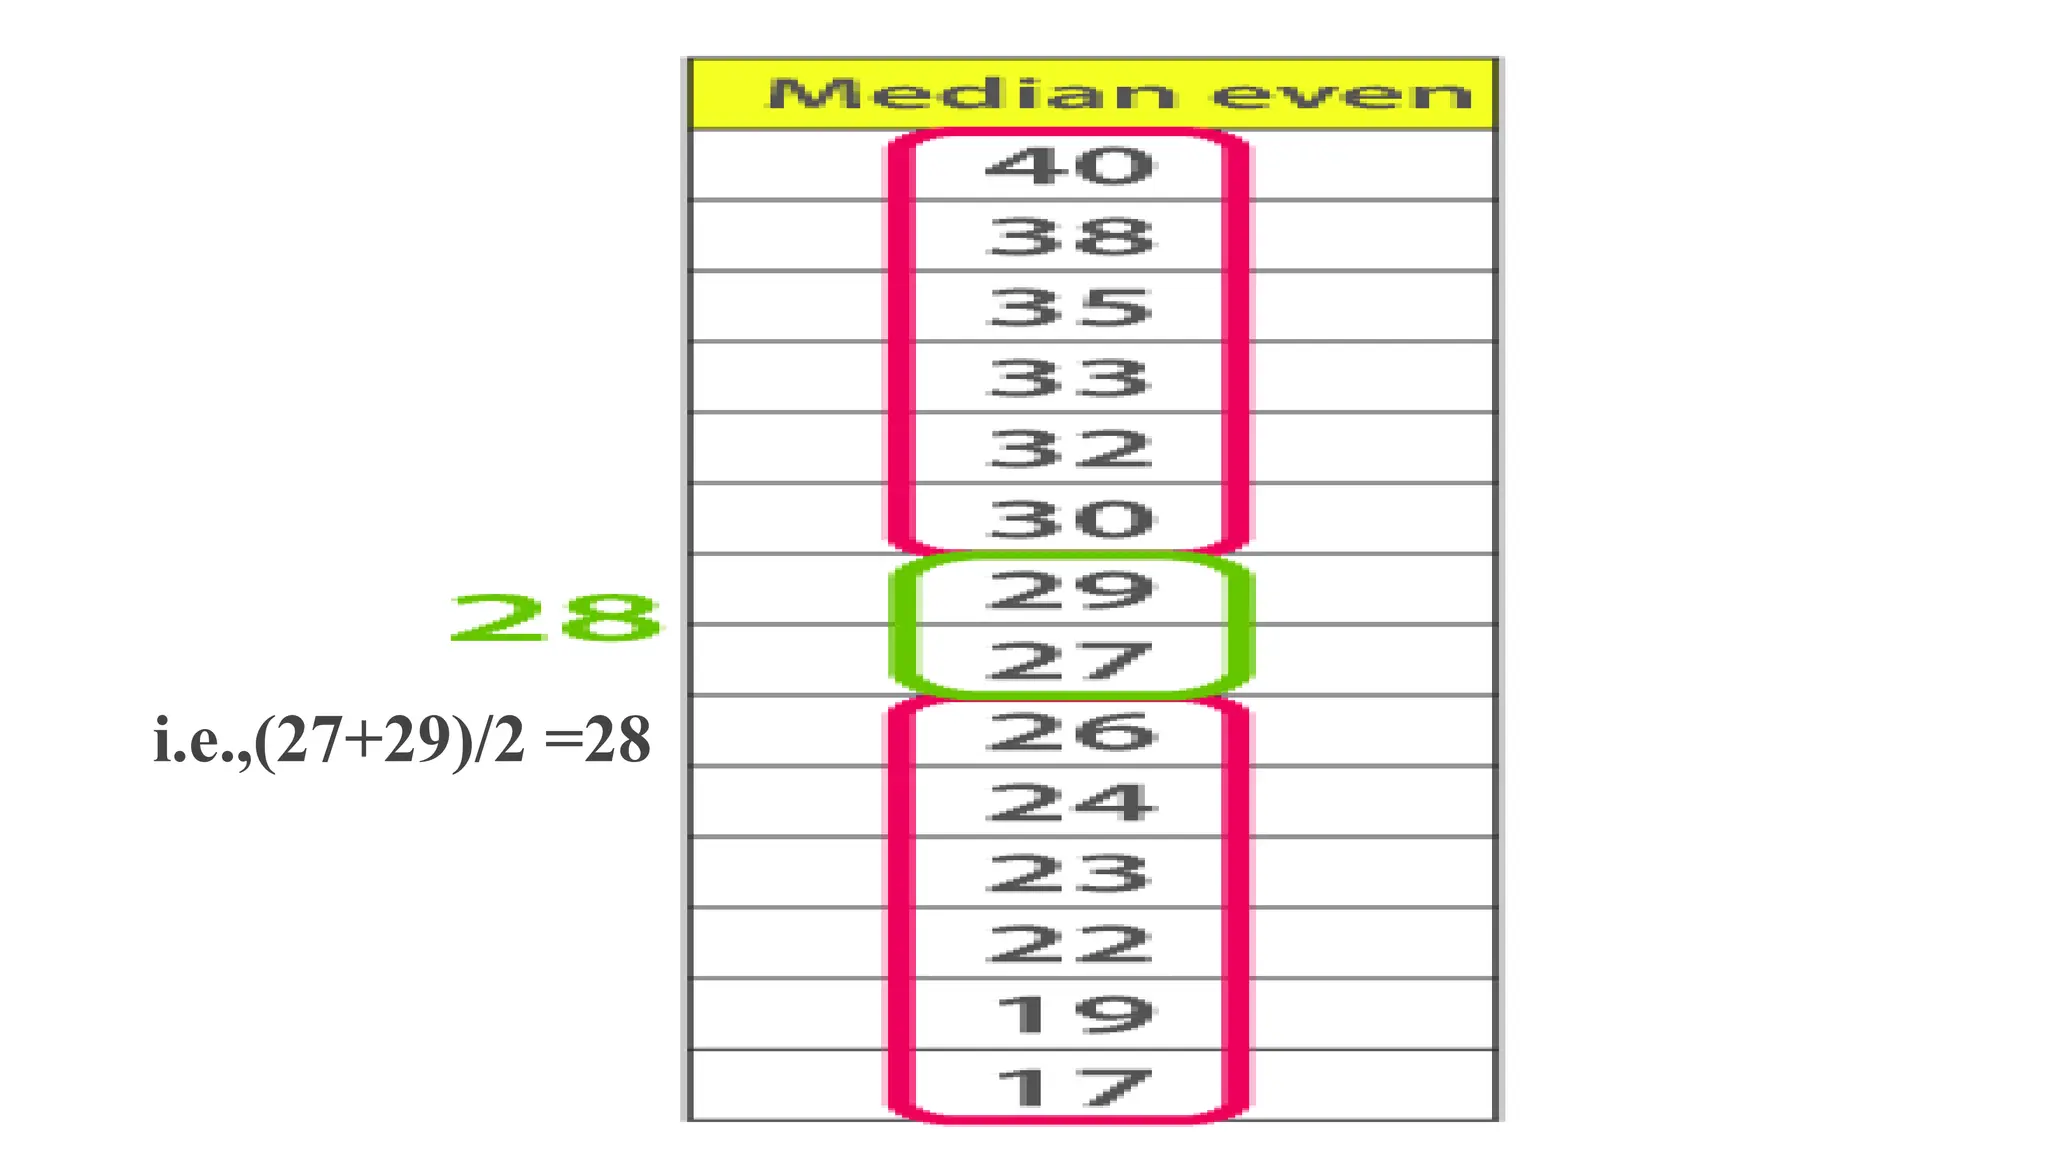
Median
• Median is the middle value of the dataset in which the dataset is arranged in the
ascending order or in descending order. When the dataset contains an even
number of values, then the median value of the dataset can be found by taking the
mean of the middle two values.
Mode
• The moderepresents the frequently occurring value in the dataset.
Sometimes the dataset may contain multiple modes and in some cases,
it does not contain any mode at all.
7.
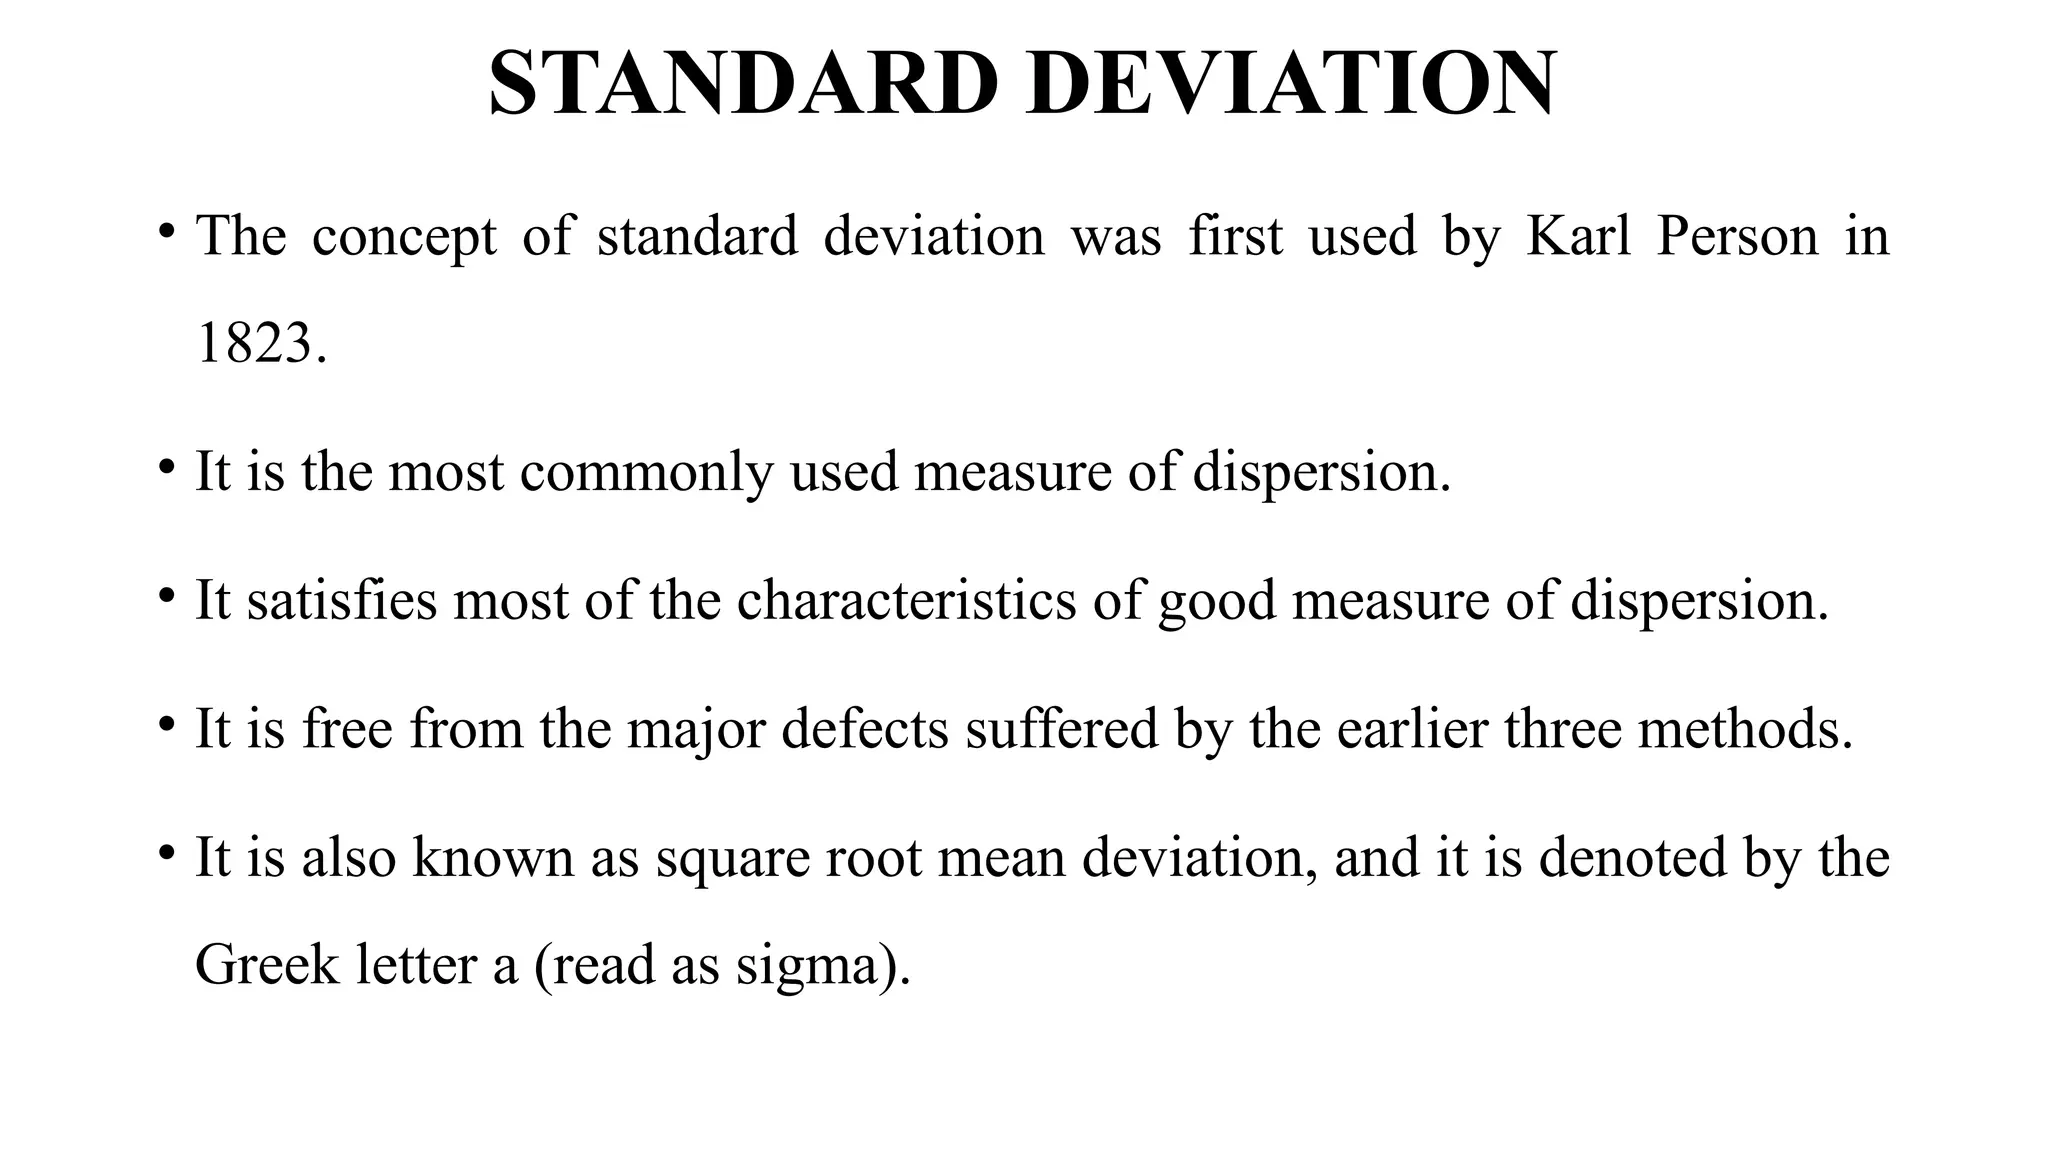
STANDARD DEVIATION
• Theconcept of standard deviation was first used by Karl Person in
1823.
• It is the most commonly used measure of dispersion.
• It satisfies most of the characteristics of good measure of dispersion.
• It is free from the major defects suffered by the earlier three methods.
• It is also known as square root mean deviation, and it is denoted by the
Greek letter a (read as sigma).
8.
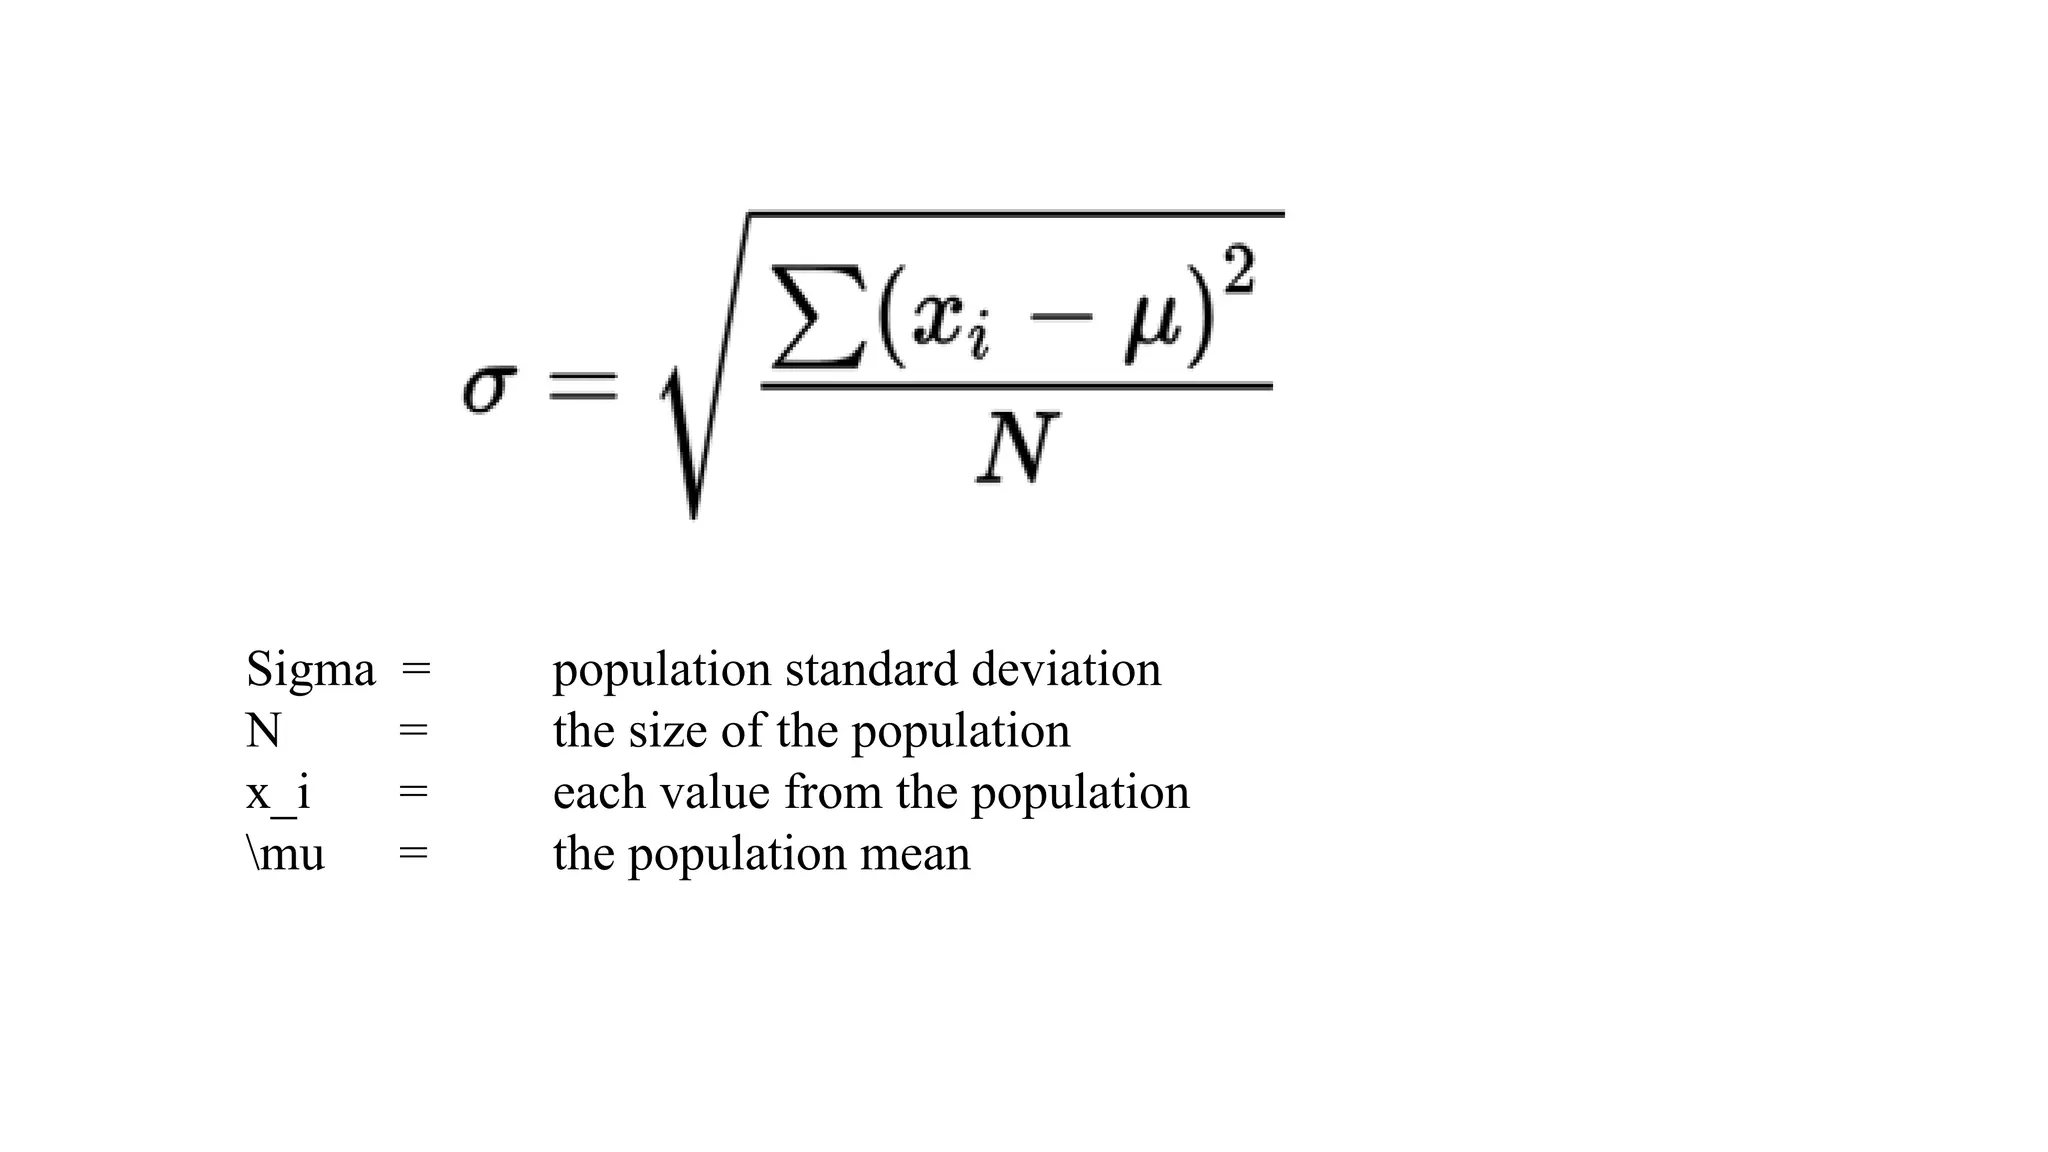
Sigma = populationstandard deviation
N = the size of the population
x_i = each value from the population
mu = the population mean
10.
CORRELATION
• Correlation isa statistical tool that helps to measure and analyze the
degree of relationship between two variables.
• Correlation analysis deals with the association between two or more
variables.
• The degree of relationship between the variables under consideration
is measure through the correlation analysis.
11.
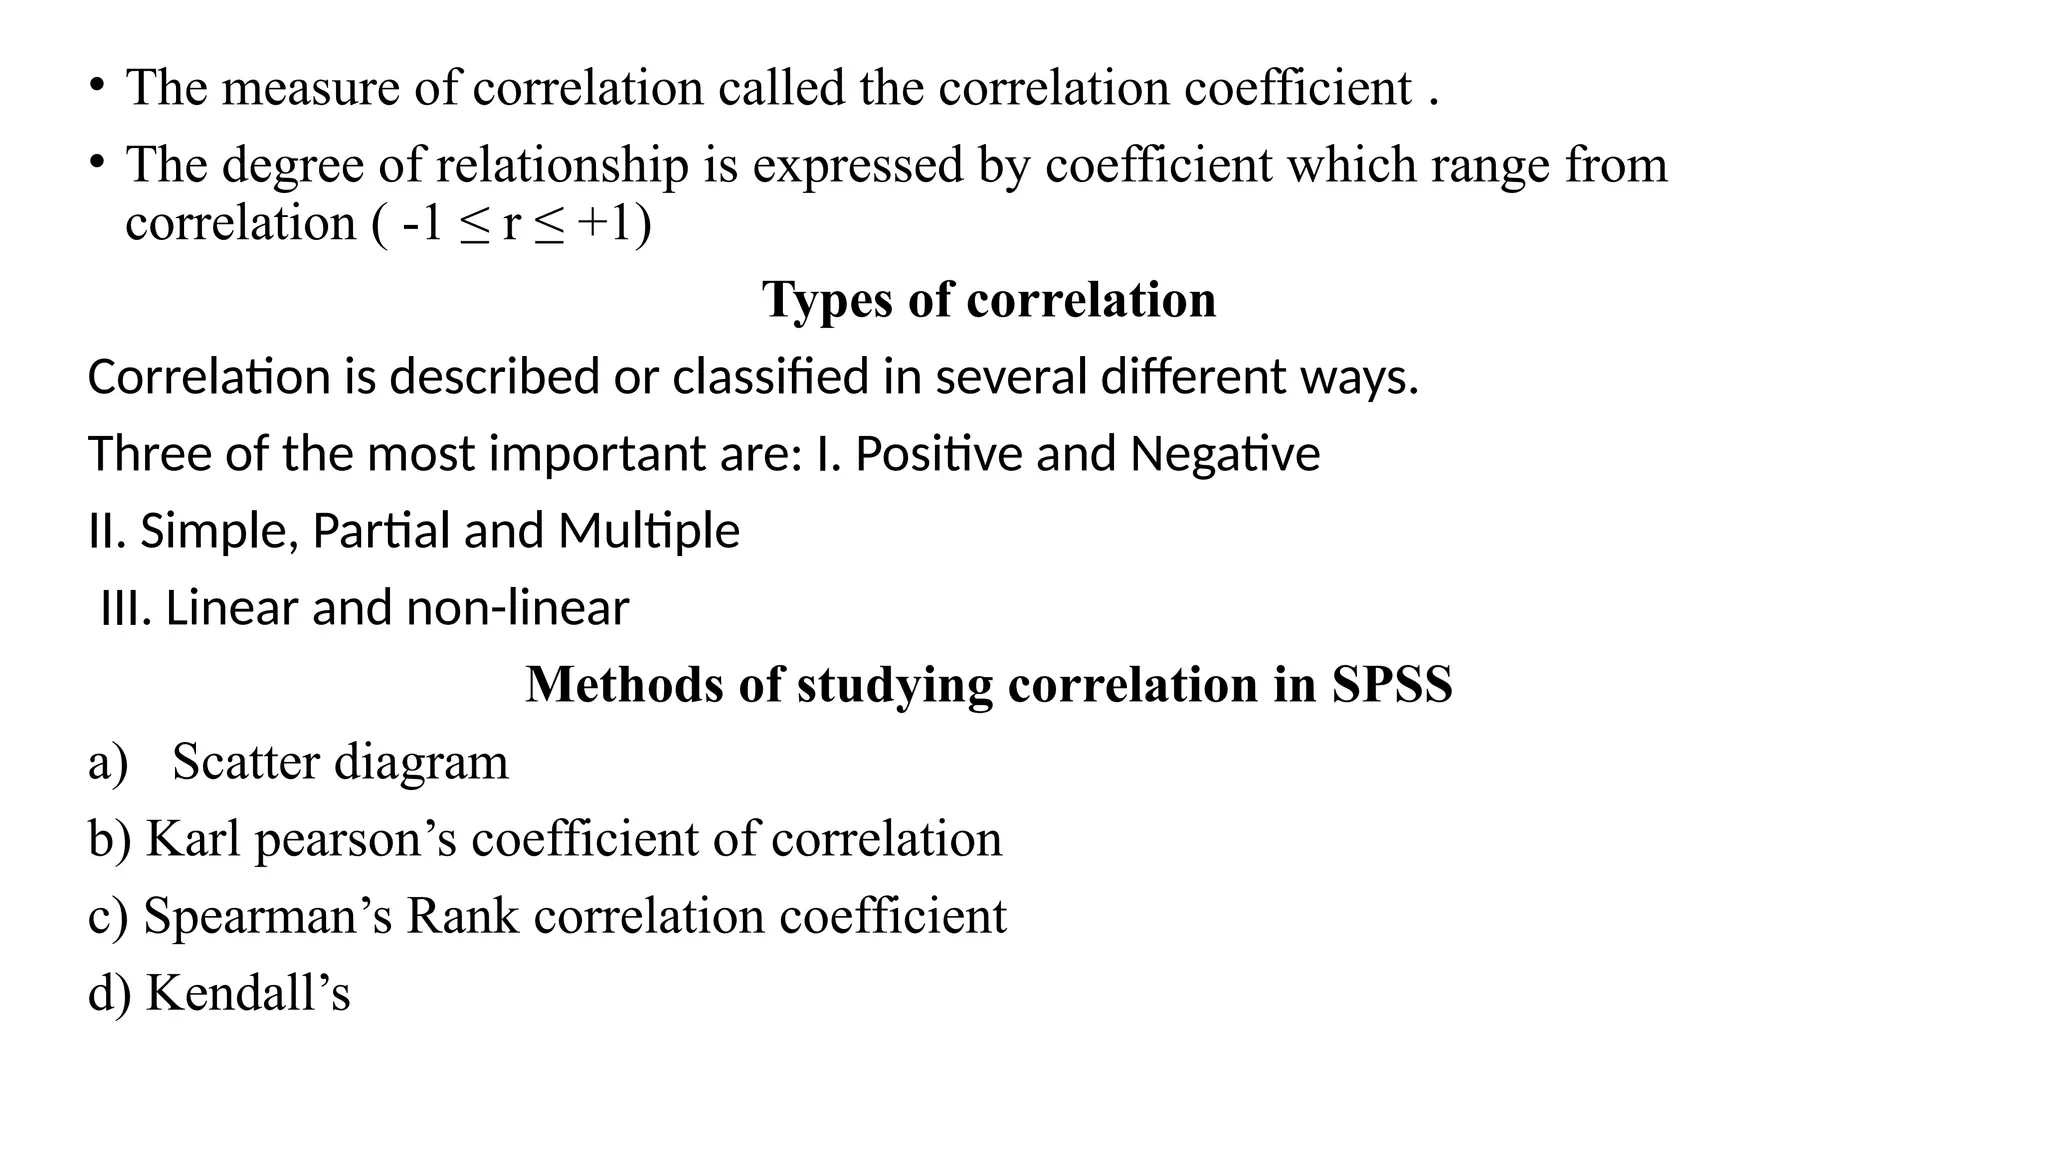
• The measureof correlation called the correlation coefficient .
• The degree of relationship is expressed by coefficient which range from
correlation ( -1 ≤ r ≤ +1)
Types of correlation
Correlation is described or classified in several different ways.
Three of the most important are: I. Positive and Negative
II. Simple, Partial and Multiple
III. Linear and non-linear
Methods of studying correlation in SPSS
a) Scatter diagram
b) Karl pearson’s coefficient of correlation
c) Spearman’s Rank correlation coefficient
d) Kendall’s
12.
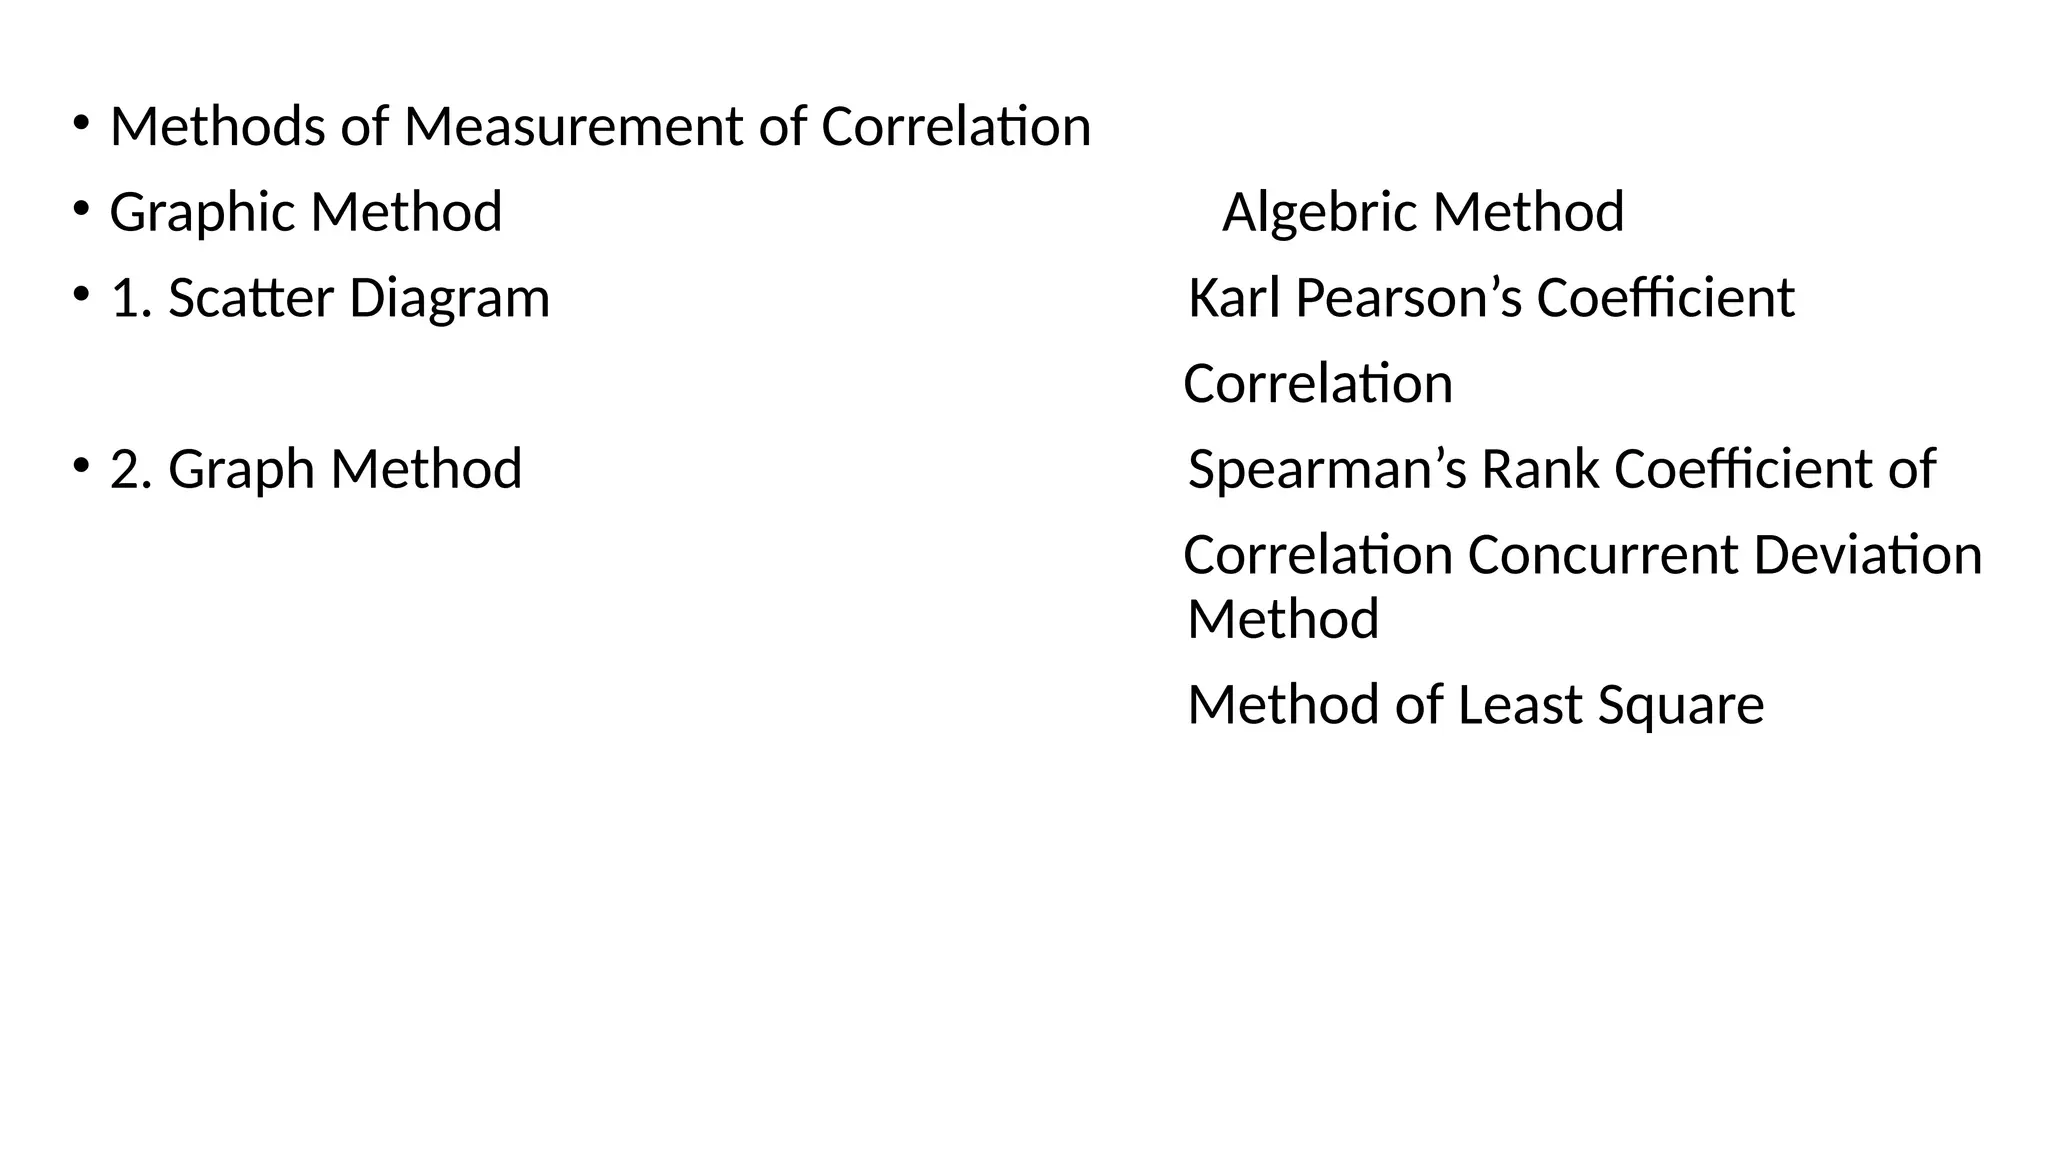
• Methods ofMeasurement of Correlation
• Graphic Method Algebric Method
• 1. Scatter Diagram Karl Pearson’s Coefficient
Correlation
• 2. Graph Method Spearman’s Rank Coefficient of
Correlation Concurrent Deviation
Method
Method of Least Square
13.
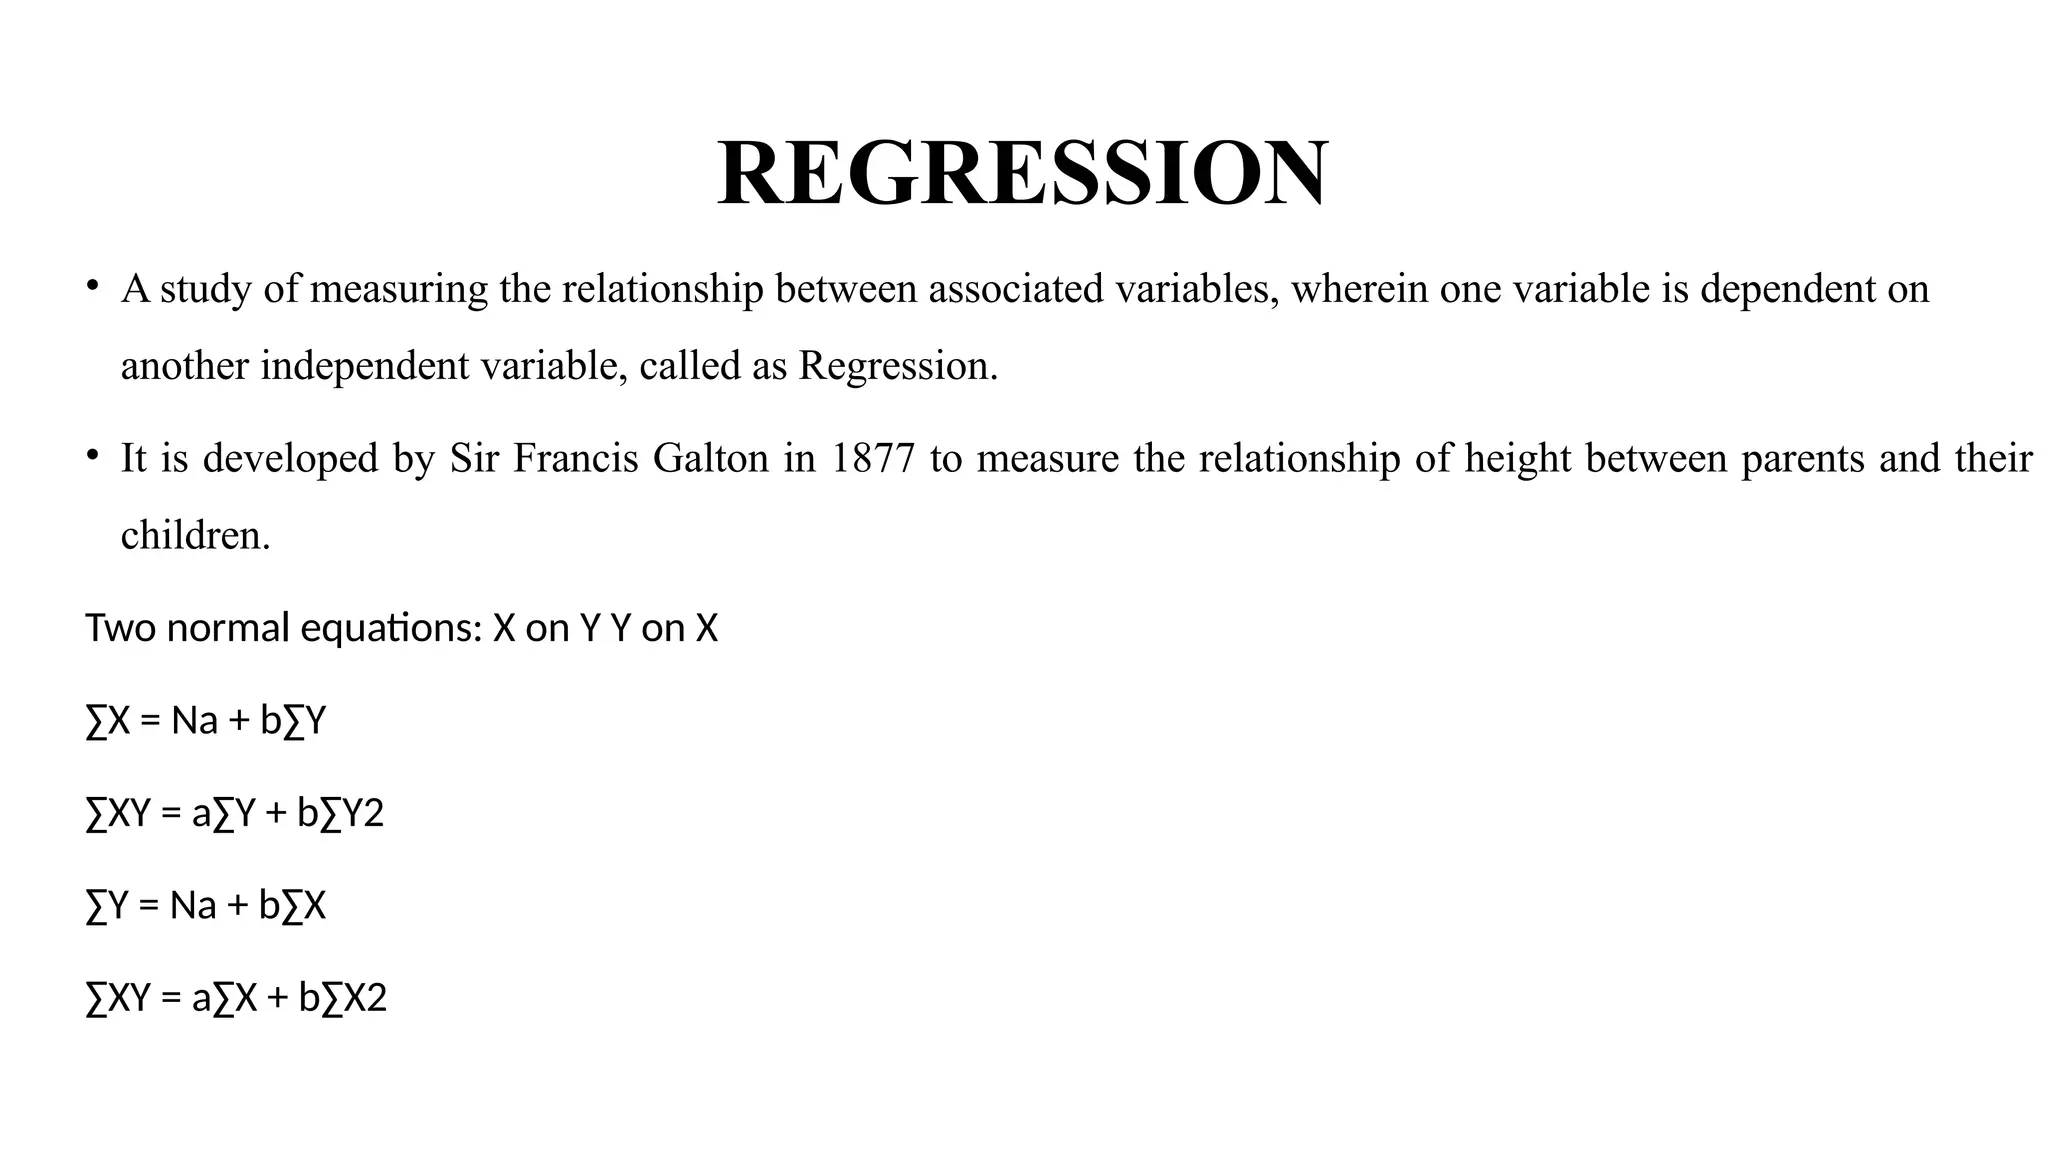
REGRESSION
• A studyof measuring the relationship between associated variables, wherein one variable is dependent on
another independent variable, called as Regression.
• It is developed by Sir Francis Galton in 1877 to measure the relationship of height between parents and their
children.
Two normal equations: X on Y Y on X
∑X = Na + b∑Y
∑XY = a∑Y + b∑Y2
∑Y = Na + b∑X
∑XY = a∑X + b∑X2
14.
• Regression equationY on X: Y = a + bX will change to (Y – Ẏ) = byx (X –
Ẋ)
• Regression equation X on Y: X = a + bY will change to (X – Ẋ) = bxy (Y –
Ẏ)
15.
Uses of RegressionAnalysis:
1. It provides estimates of values of the dependent variables from values of
independent variables.
2. It is used to obtain a measure of the error involved in using the regression line
as a basis for estimation.
3. With the help of regression analysis, we can obtain a measure of degree of
association or correlation that exists between the two variables.
4. It is highly valuable tool in economies and business research, since most of the
problems of the economic analysis are based on cause and effect relationship.
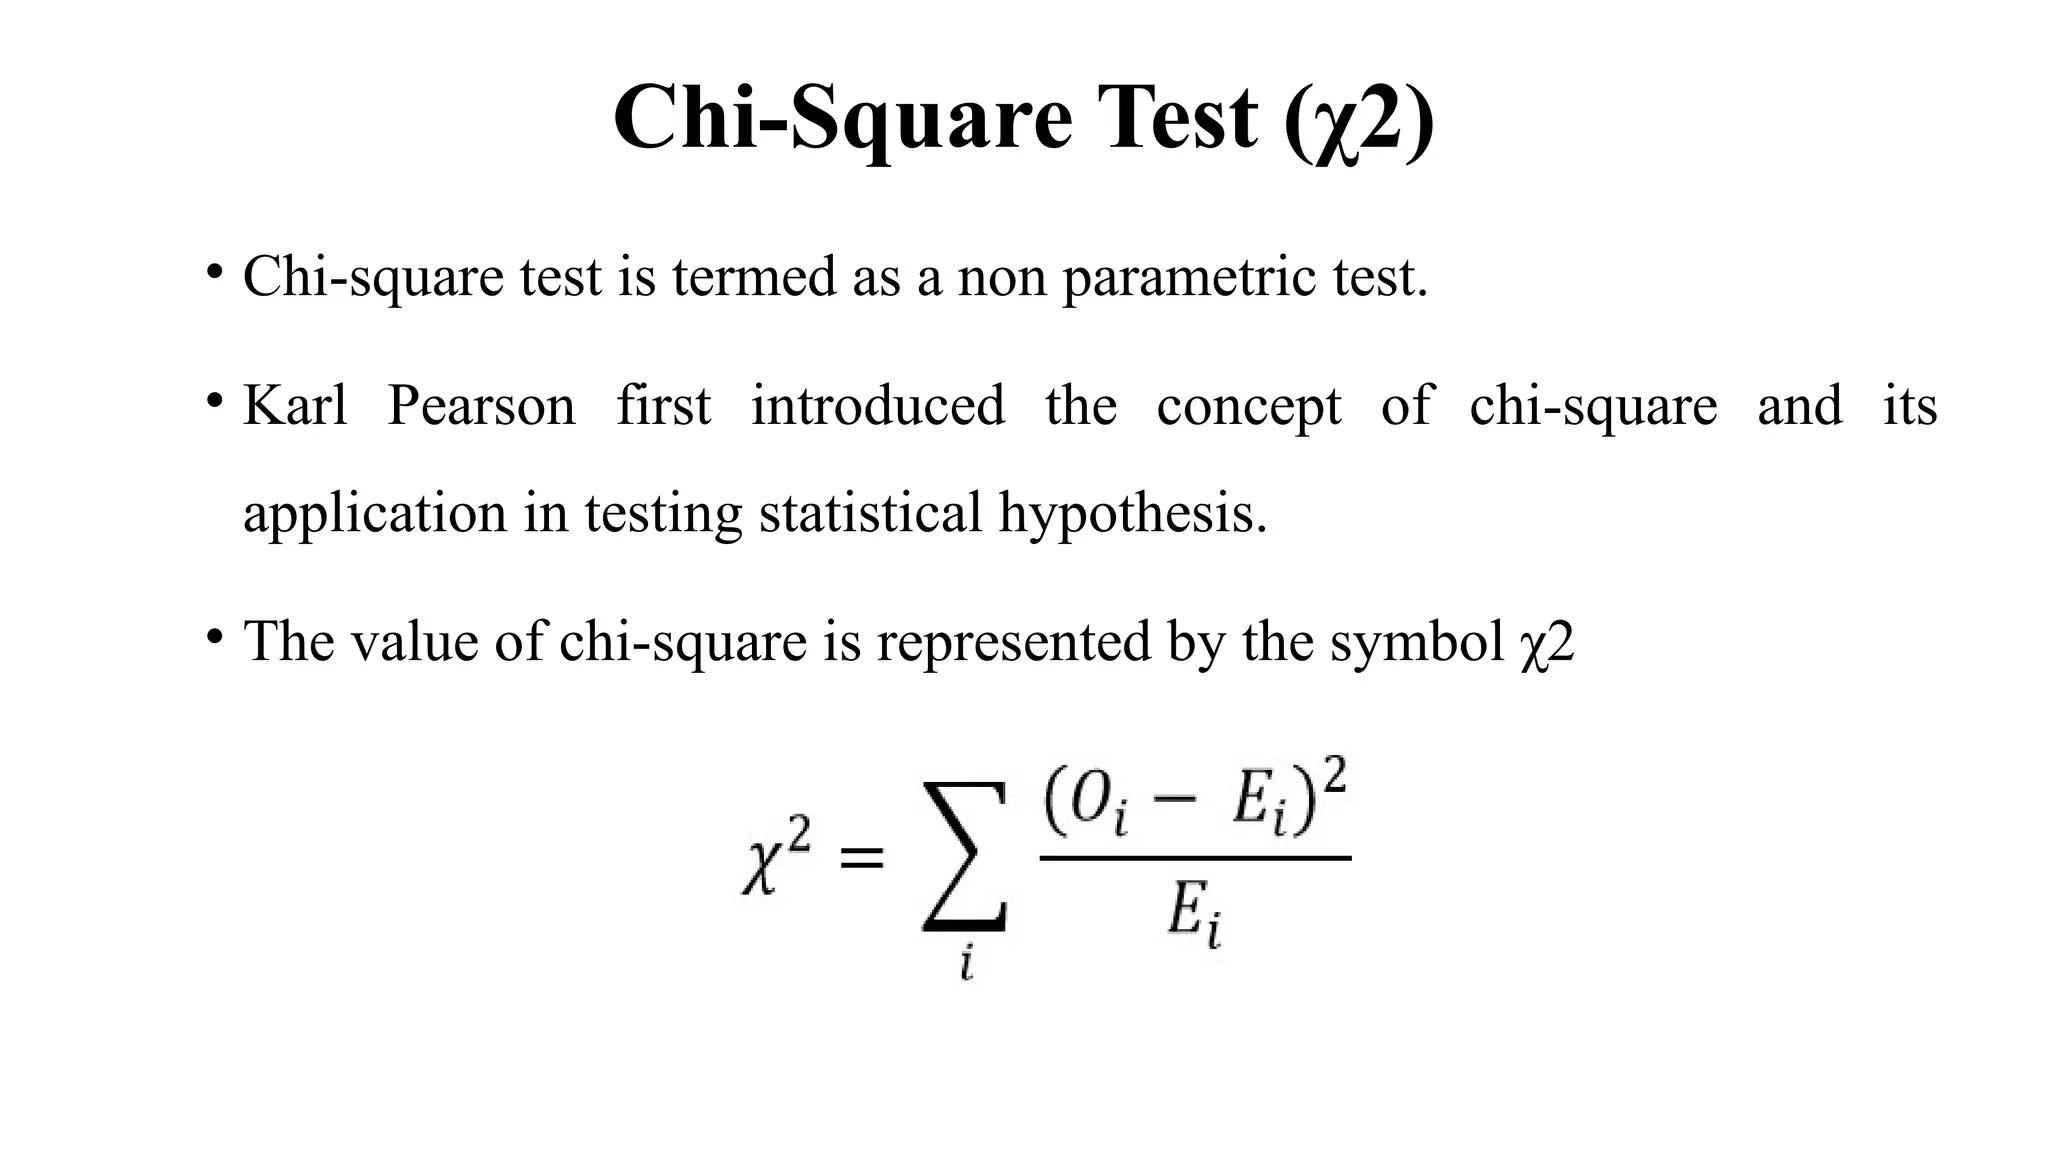
Chi-Square Test (χ2)
•Chi-square test is termed as a non parametric test.
• Karl Pearson first introduced the concept of chi-square and its
application in testing statistical hypothesis.
• The value of chi-square is represented by the symbol χ2
18.
Uses of chi-squareTest
• The chi-square test is very powerful tool in the hands of statisticians for testing hypothesis of a
variety of statistical problems. The most important purposes served by the application of test of
chi-square are follows:
1) test of goodness fit – the chi-square test is used for the comparison of observed
frequencies with the expected theoretical frequencies in a sample.
2) test of Independence- the chi-square test is widely used to test the
independence of attributes.
3) Test of homogeneity- the chi-square test is also used to test the homogeneity
of attributes is respect to of a particular characteristic.
19.
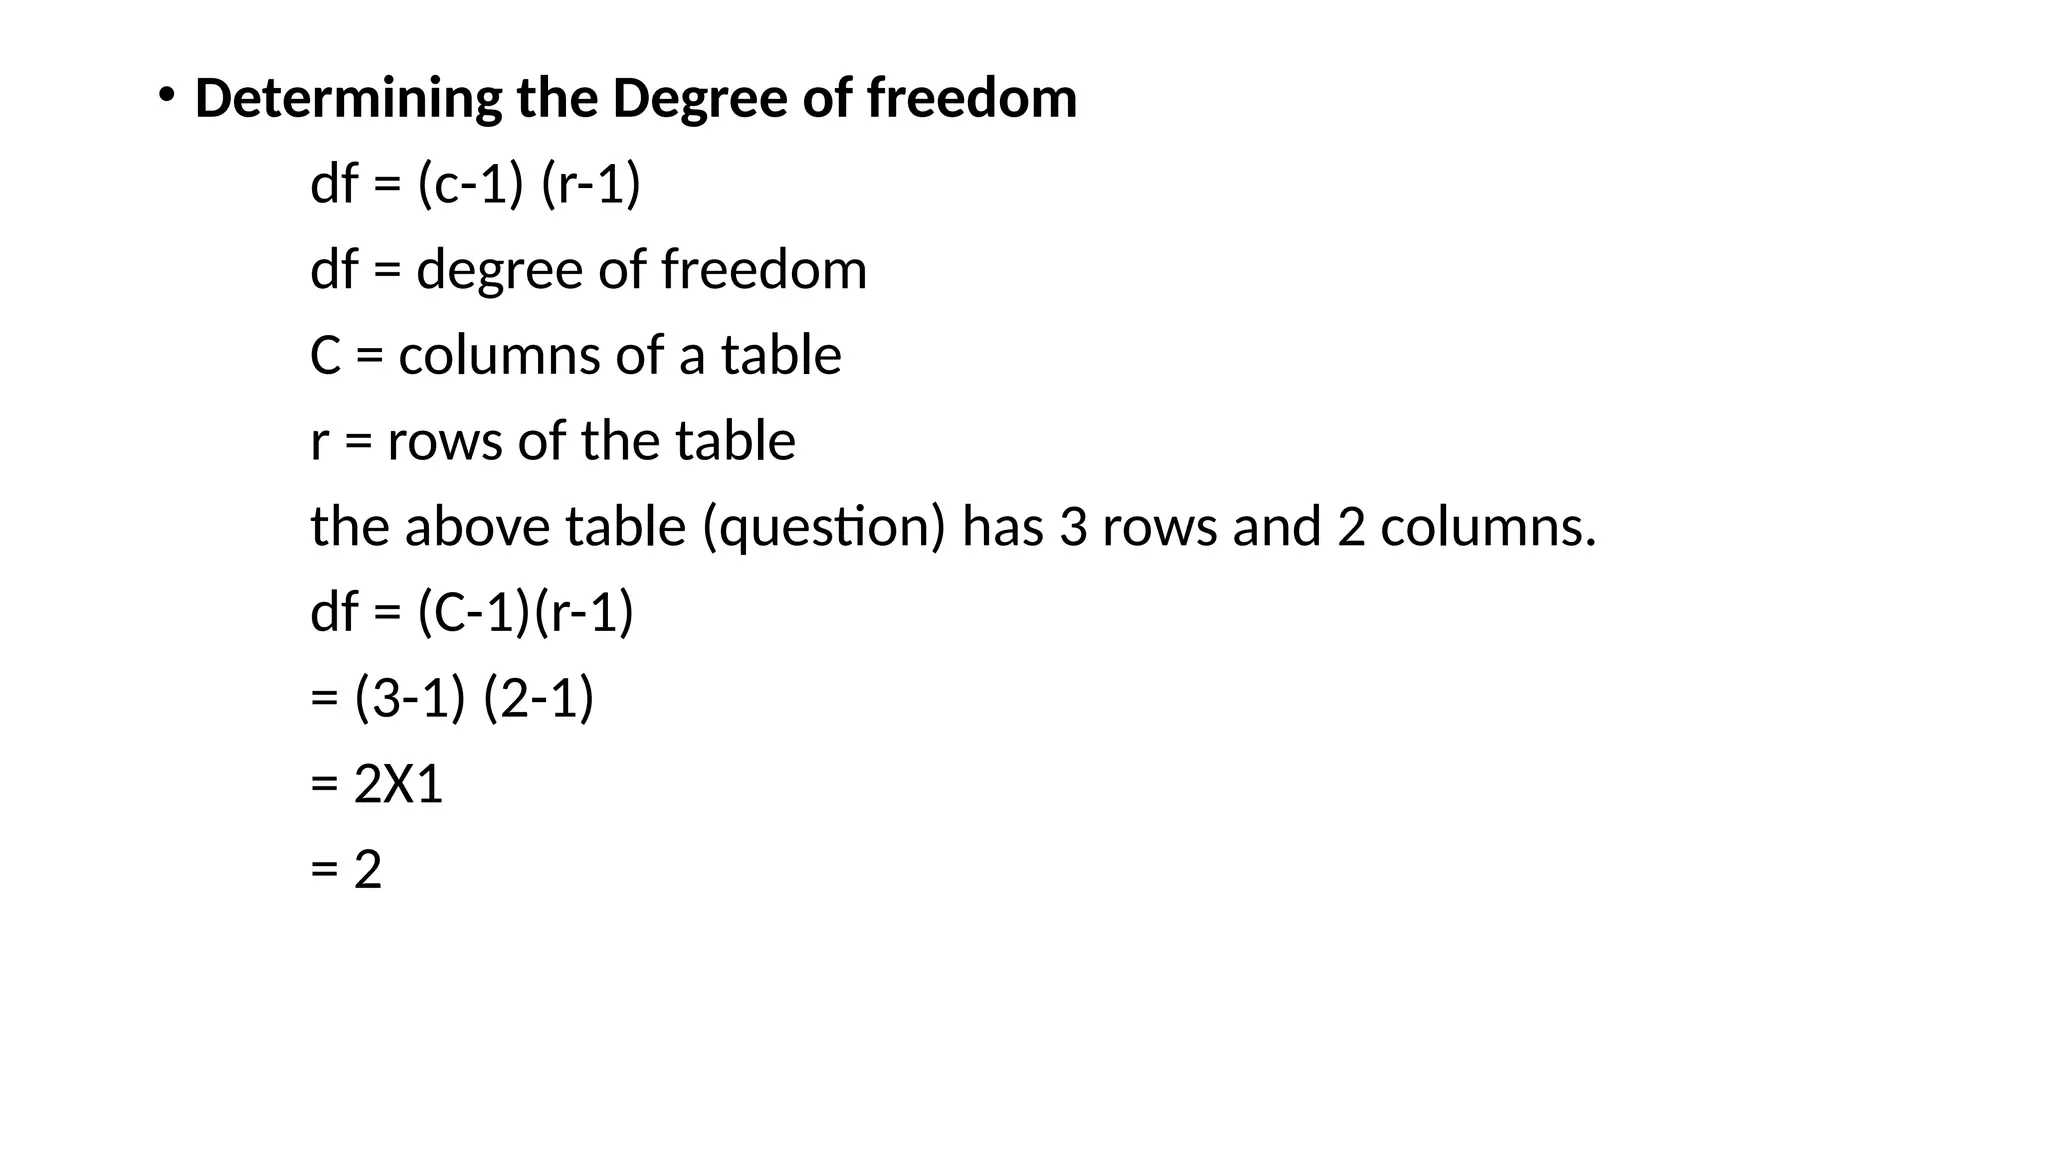
• Determining theDegree of freedom
df = (c-1) (r-1)
df = degree of freedom
C = columns of a table
r = rows of the table
the above table (question) has 3 rows and 2 columns.
df = (C-1)(r-1)
= (3-1) (2-1)
= 2X1
= 2
20.
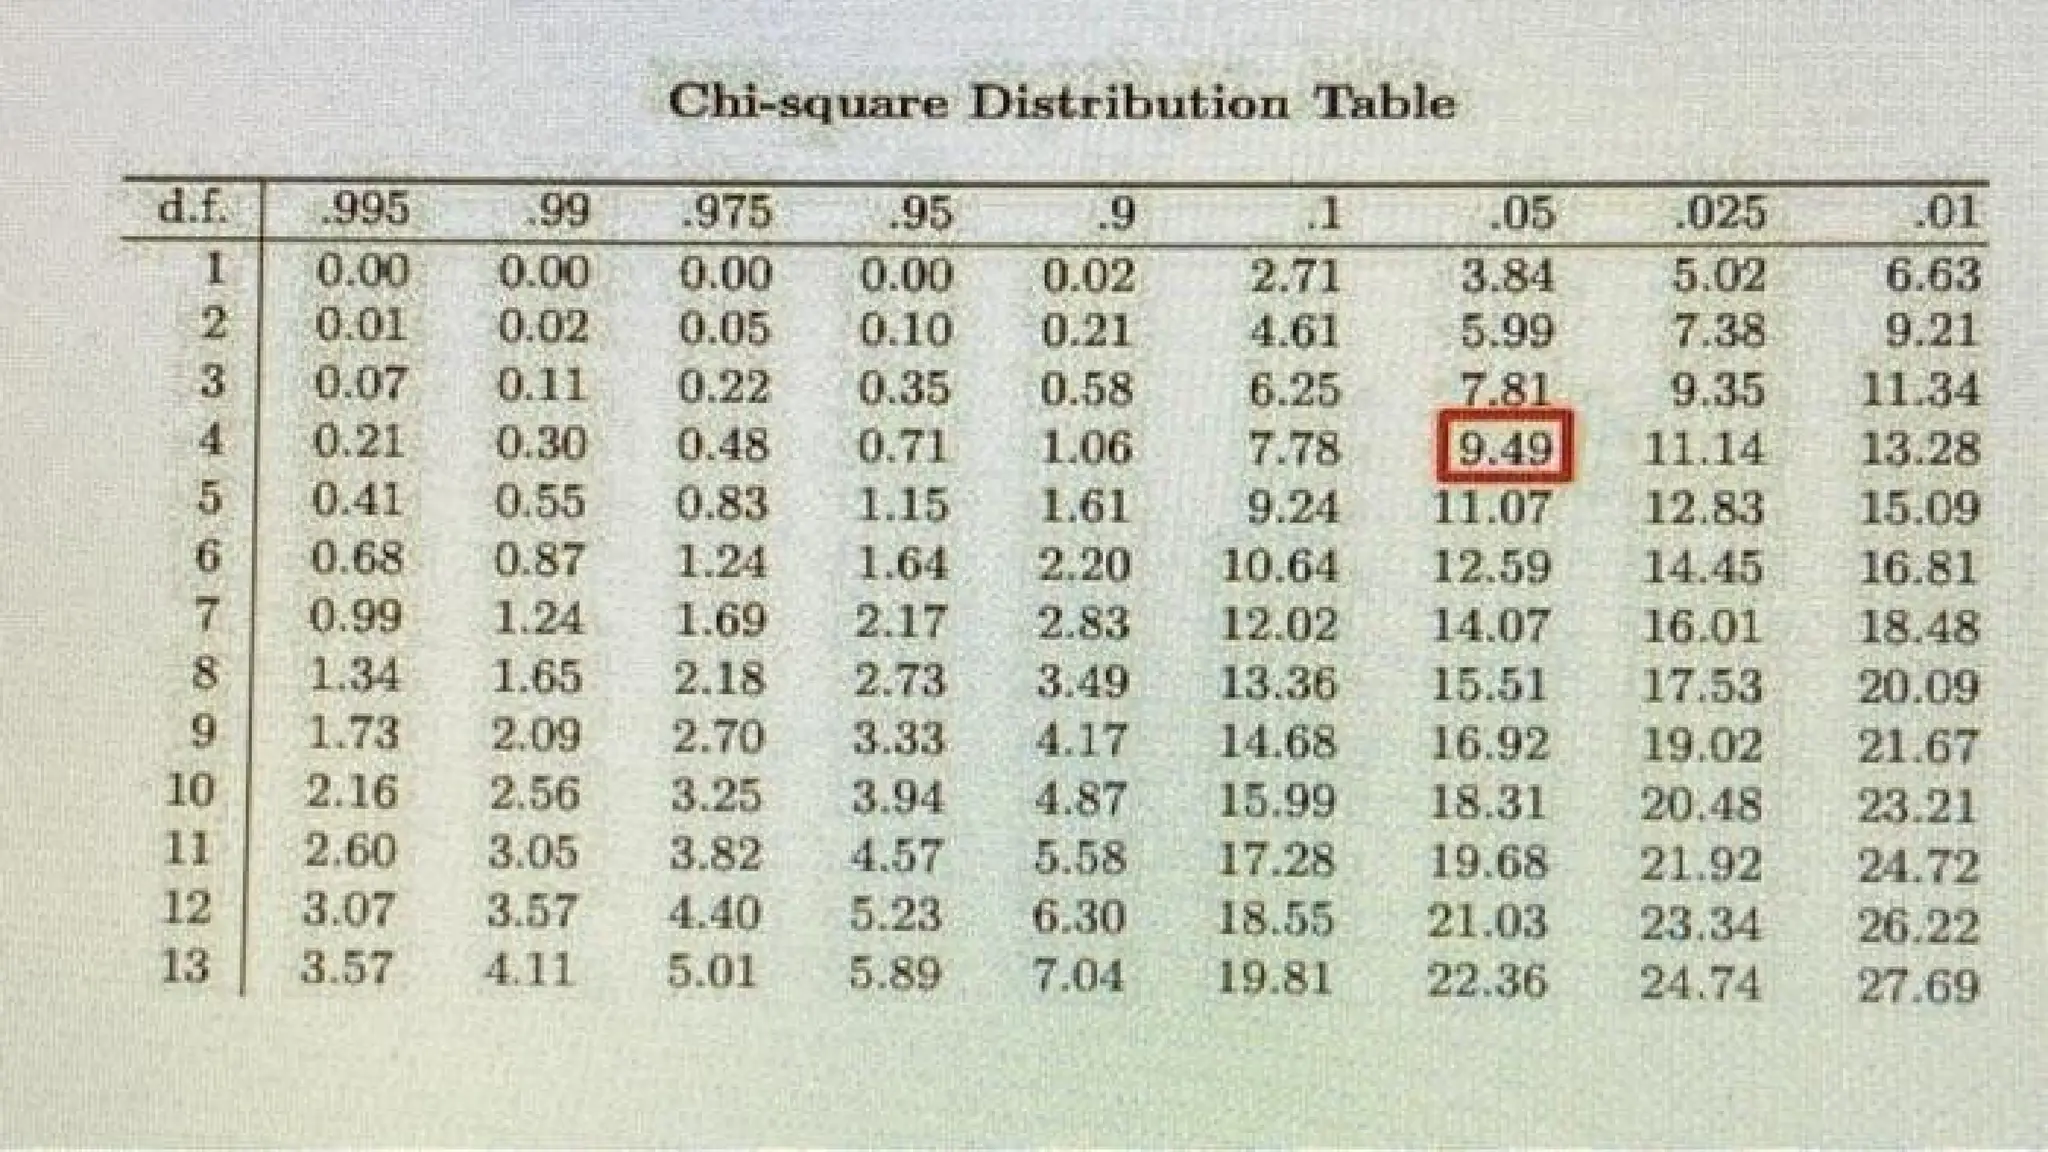
• Determining theCritical Value
χ2 has pre-determined value.
It requires significance level (5% or 1%) for the computed degree
of freedom.
The df is 2. The critical value at 5% level is 5.991 and at 1% level
is 9.210 by referring to χ2 table.
22.
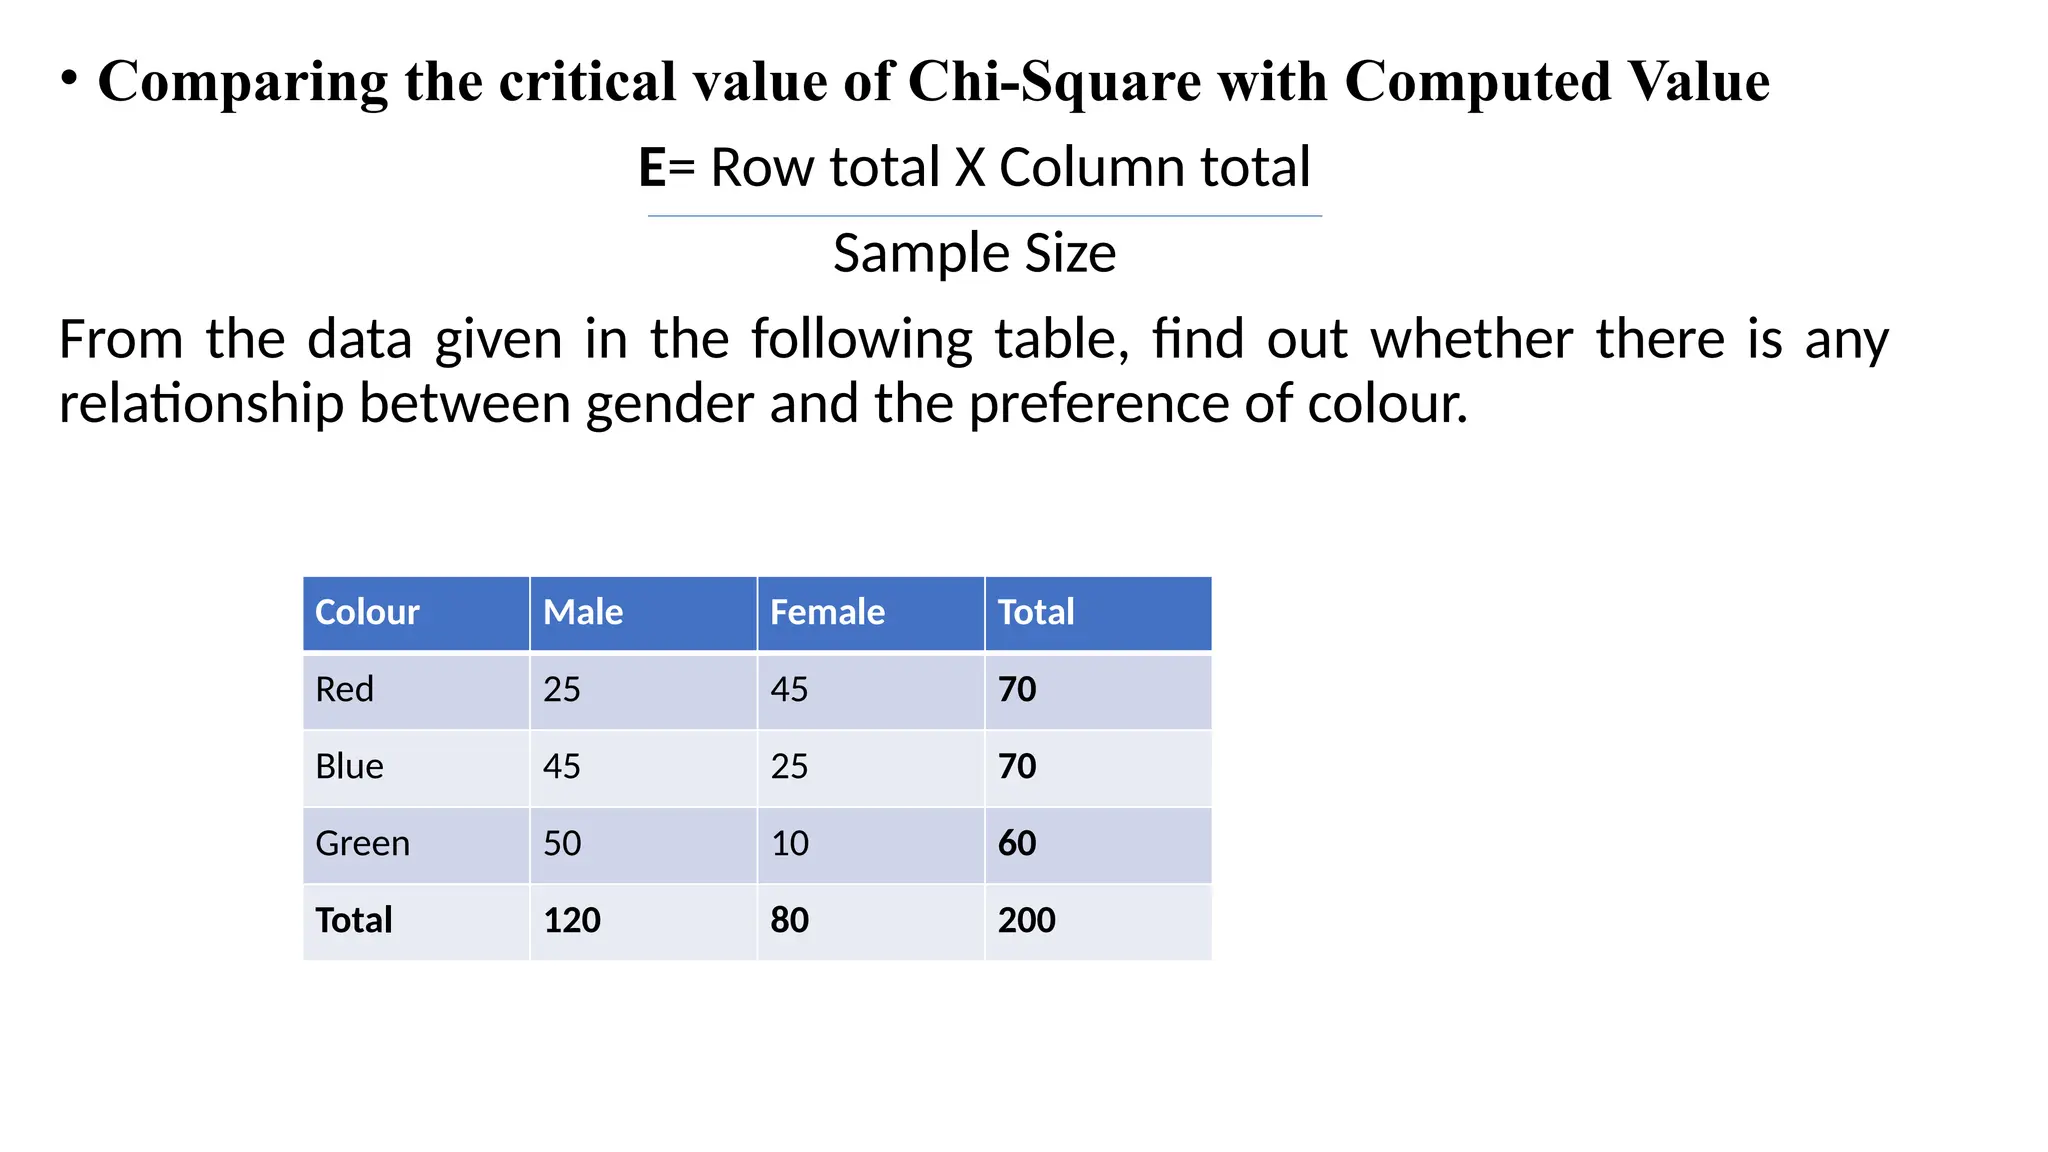
• Comparing thecritical value of Chi-Square with Computed Value
E= Row total X Column total
Sample Size
From the data given in the following table, find out whether there is any
relationship between gender and the preference of colour.
Colour Male Female Total
Red 25 45 70
Blue 45 25 70
Green 50 10 60
Total 120 80 200
23.
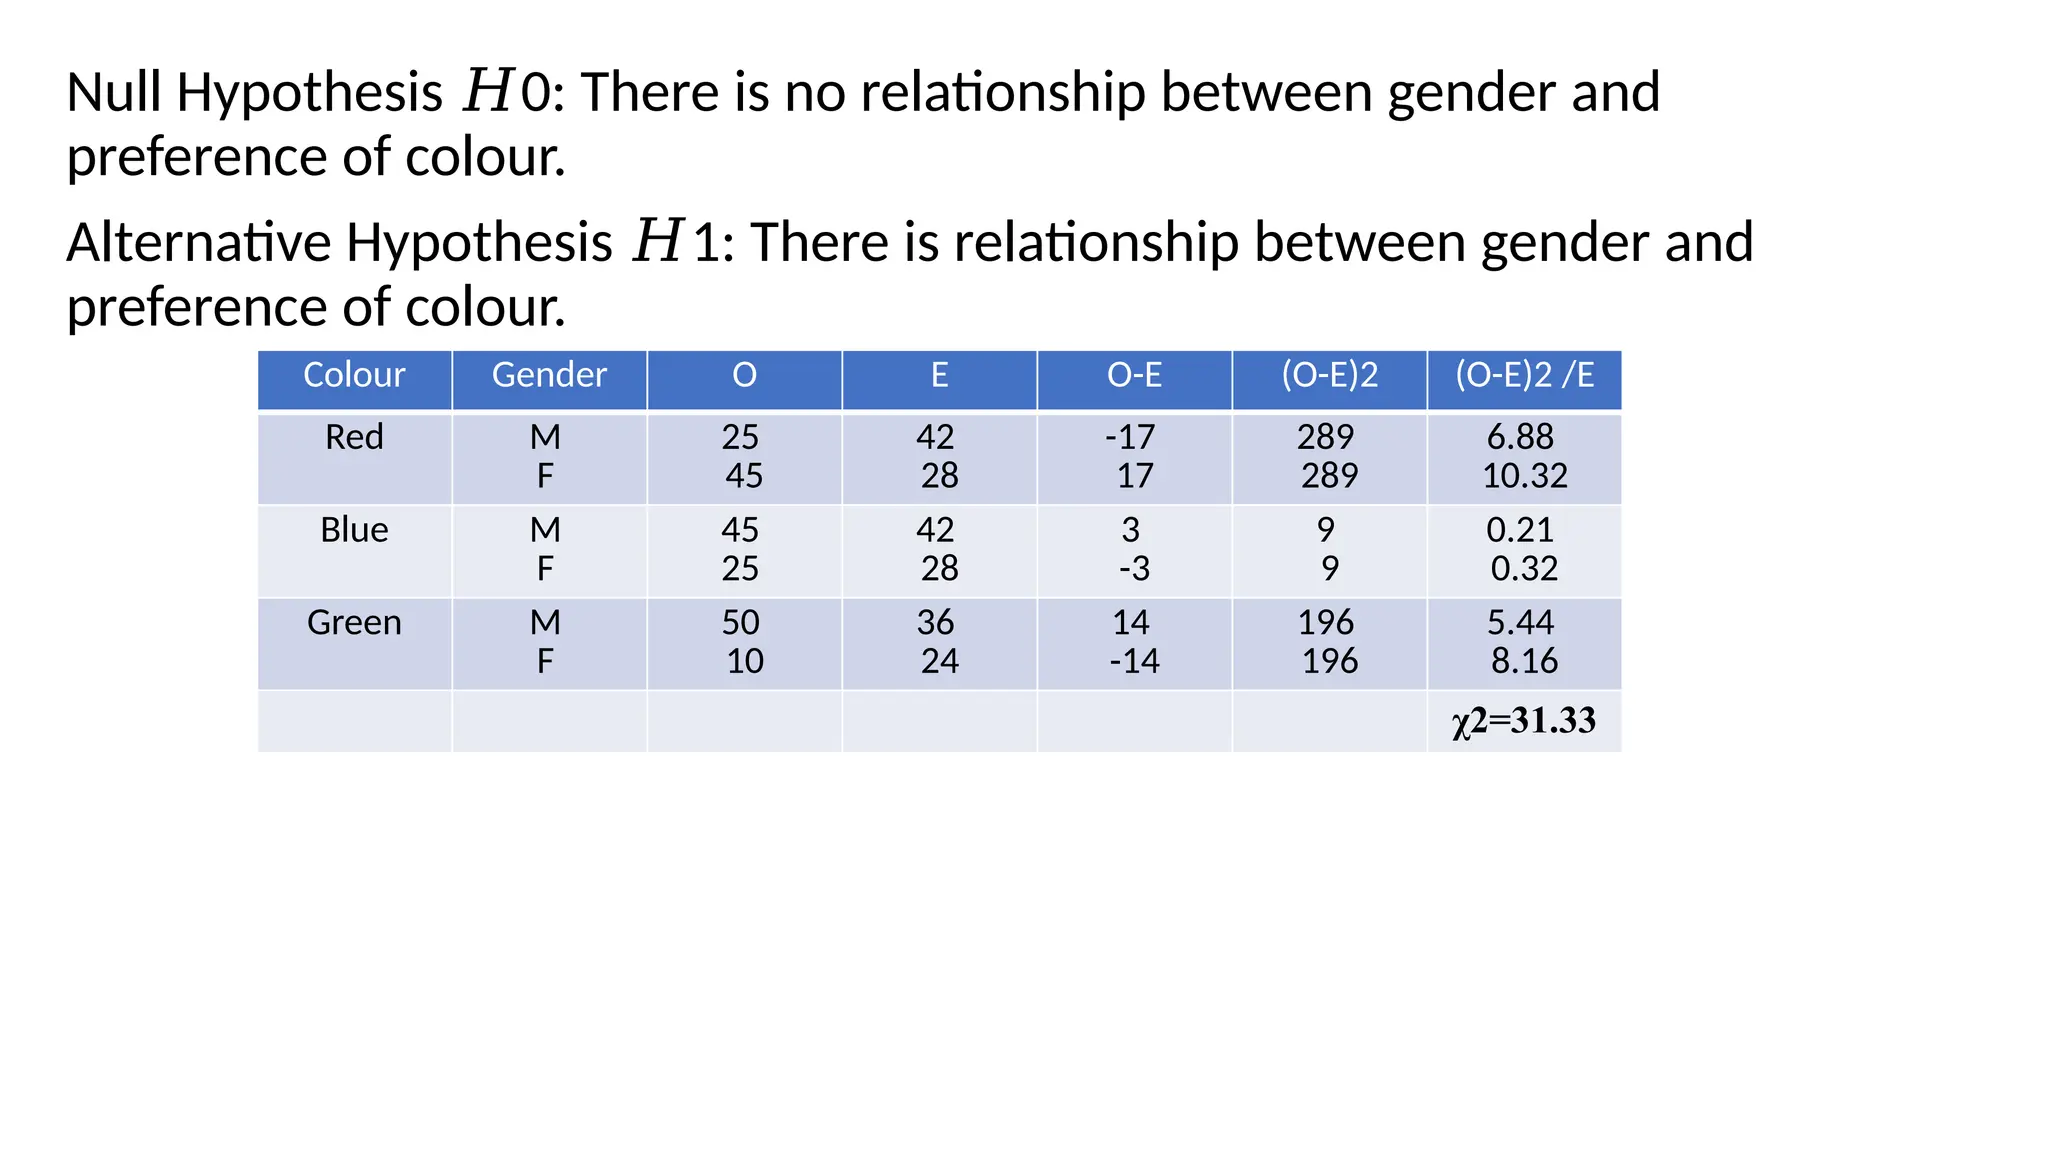
Null Hypothesis 0:There is no relationship between gender and
𝐻
preference of colour.
Alternative Hypothesis 1: There is relationship between gender and
𝐻
preference of colour.
Colour Gender O E O-E (O-E)2 (O-E)2 /E
Red M
F
25
45
42
28
-17
17
289
289
6.88
10.32
Blue M
F
45
25
42
28
3
-3
9
9
0.21
0.32
Green M
F
50
10
36
24
14
-14
196
196
5.44
8.16
χ2=31.33
24.
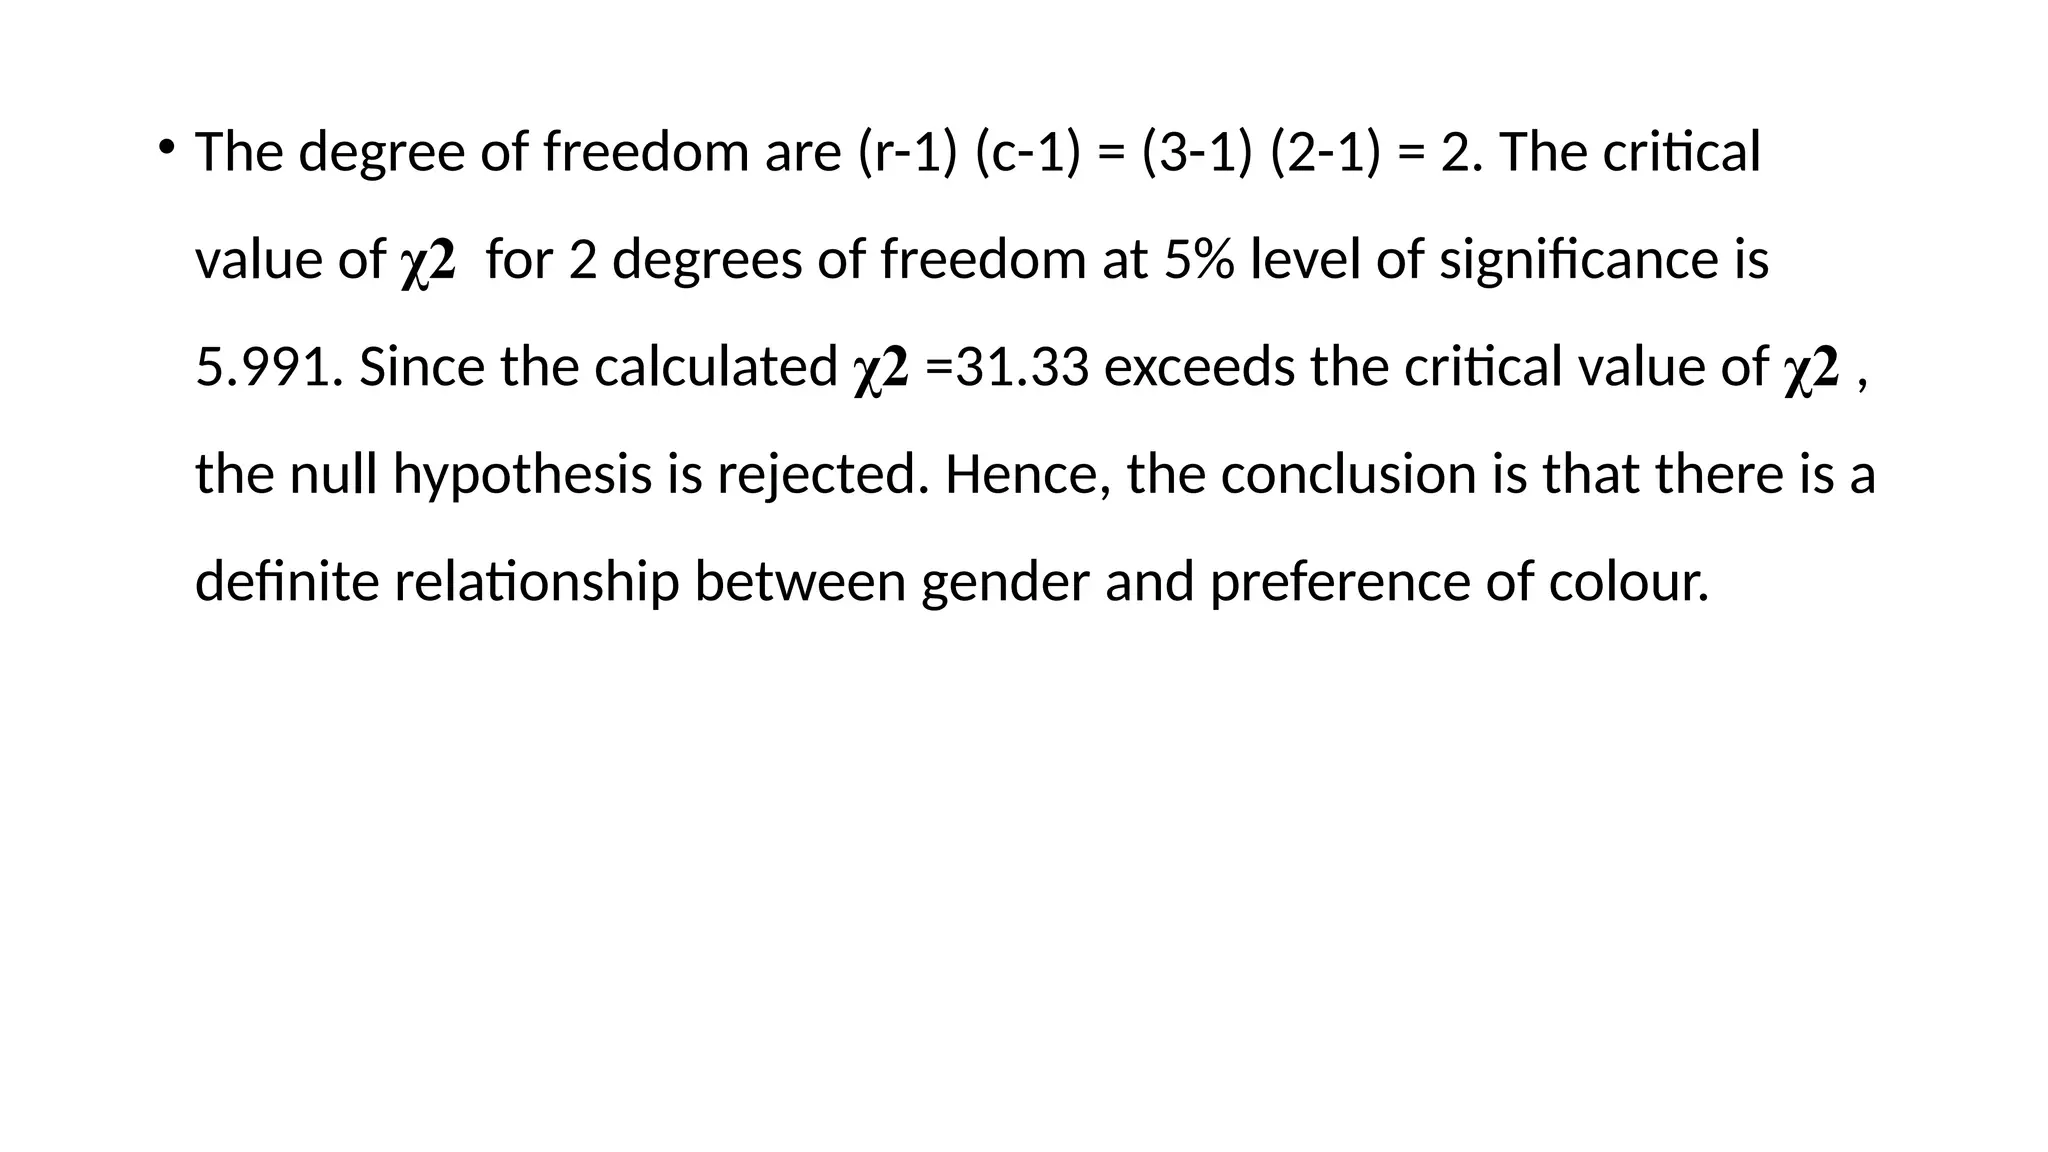
• The degreeof freedom are (r-1) (c-1) = (3-1) (2-1) = 2. The critical
value of χ2 for 2 degrees of freedom at 5% level of significance is
5.991. Since the calculated χ2 =31.33 exceeds the critical value of χ2 ,
the null hypothesis is rejected. Hence, the conclusion is that there is a
definite relationship between gender and preference of colour.
25.
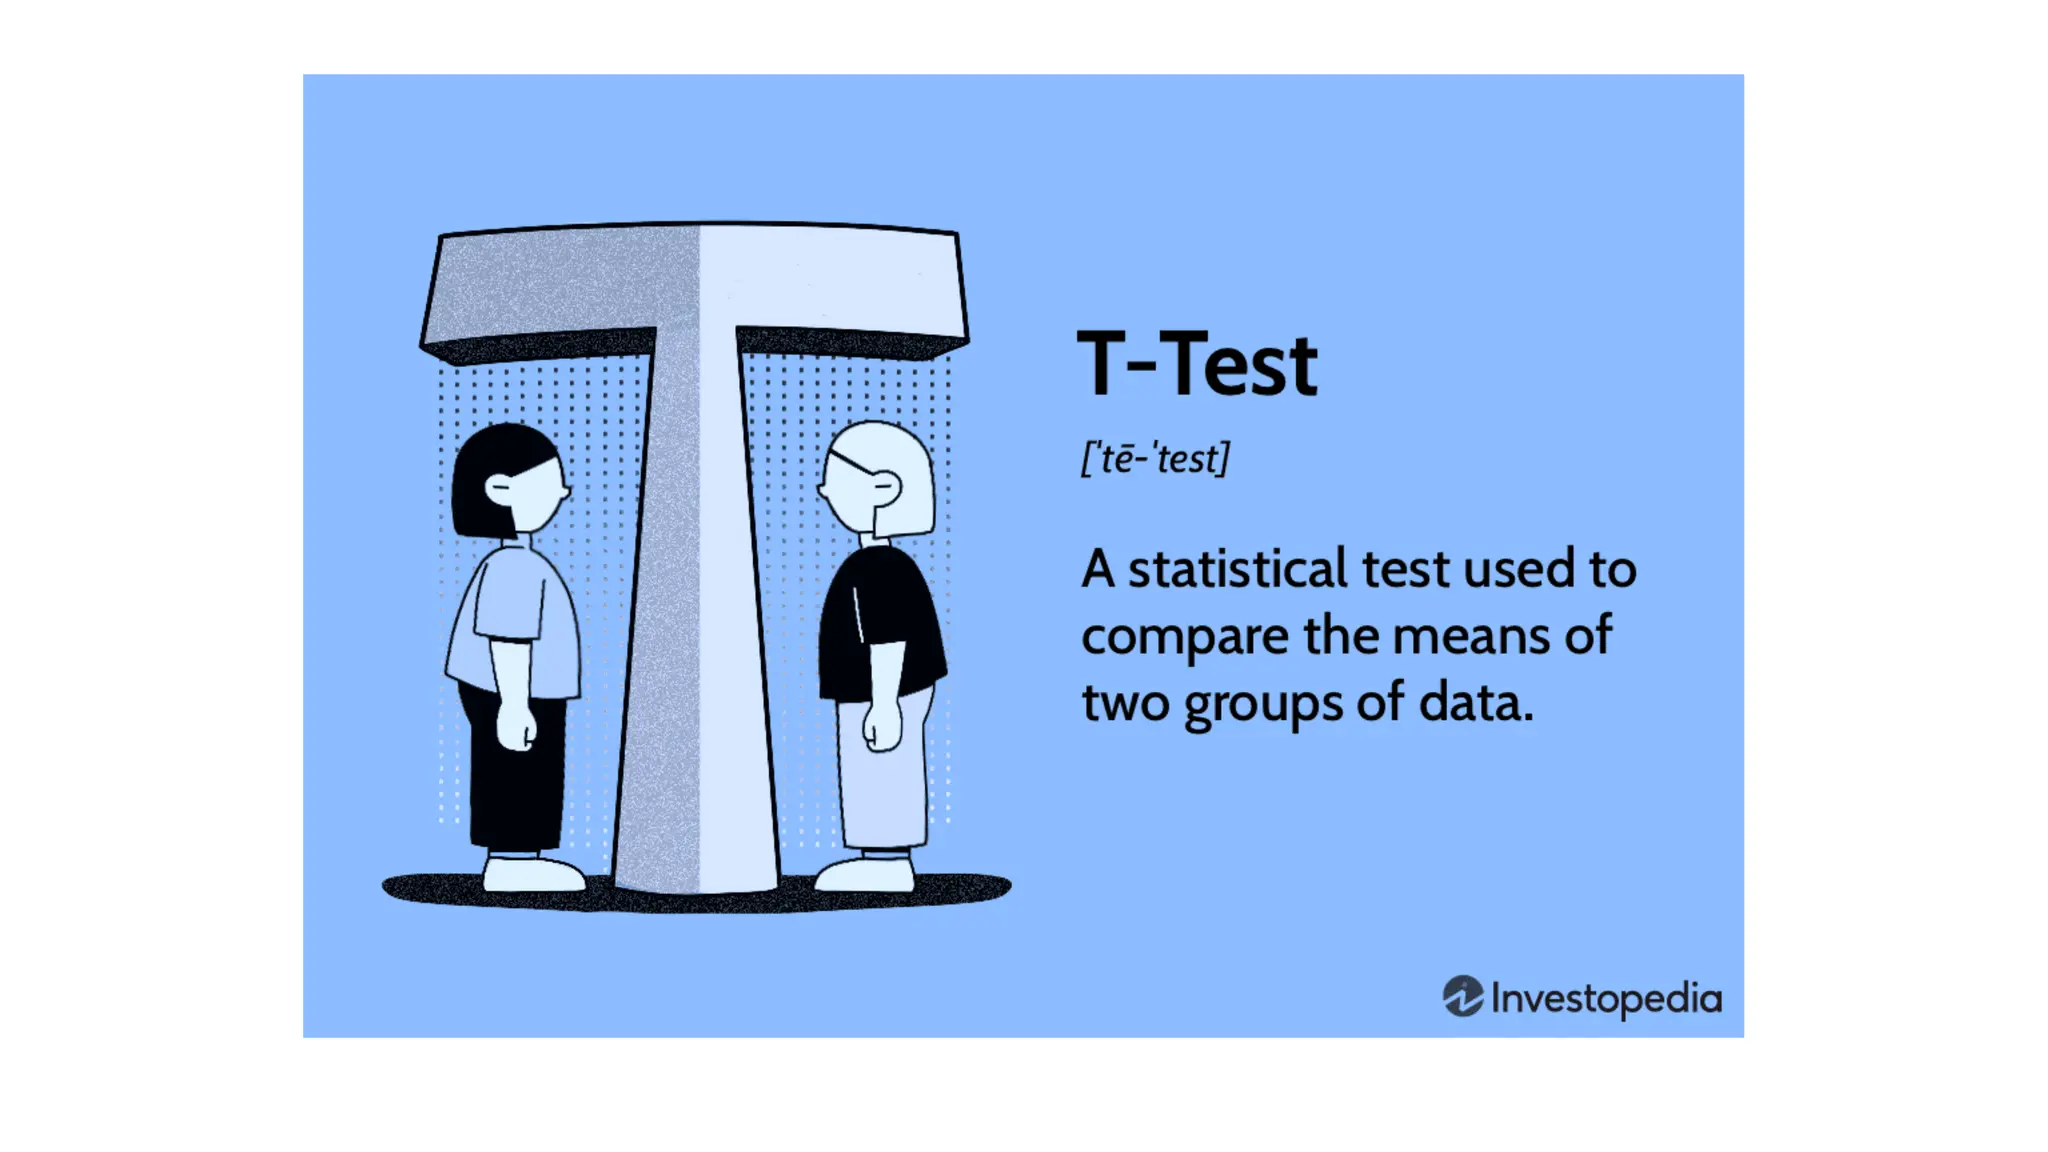
T-TEST
• A t-Testis a statistical hypothesis test.
• The T-Statistic was introduced by W.S.Gossett under the pen name
“student”.
• Therefore, the T-test is also known as the“student T-test”.
• The T-test is a commonly used statistical analysis for testing
hypothesis, since it is straight forward and easy to use.
F-Test
• F-tests arenamed after the name of Sir Ronald Fisher.
• The F-statistic is simply a ratio of two variances. Variance is the square of the
standard deviation.
• For a common person, standard deviations are easier to understand than variances
because they’re in the same units as the data rather than squared units.
• F-statistics are based on the ratio of mean squares.
• The term “mean squares” may sound confusing but it is simply an estimate of
population variance that accounts for the degrees of freedom (DF) used to
calculate that estimate.
29.
ANALYSIS OF VARIANCE-ANOVA
•Analysis of variance (ANOVA) is statistical technique used for analyzing
the difference between the means of more than two samples.
• It is a parametric test of hypothesis.
• ANOVA was developed by statistician and eugenicist Ronald Fisher.
• It is a step wise estimation procedures (such as the "variation" among
and between groups) used to attest the equality between two or more
population means .