Download as PDF, PPTX


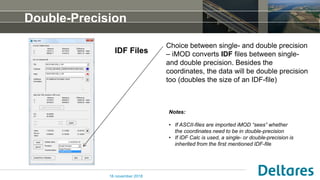
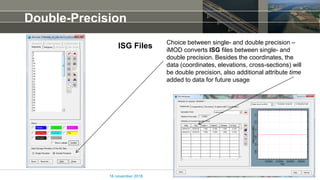
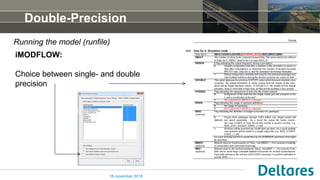
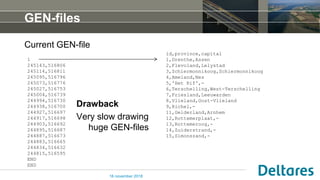
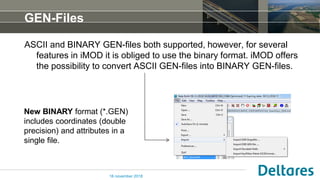
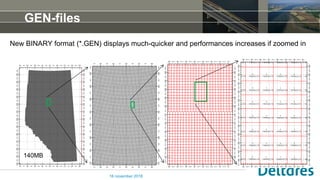
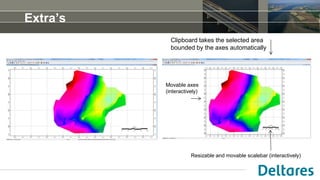
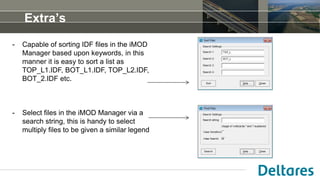
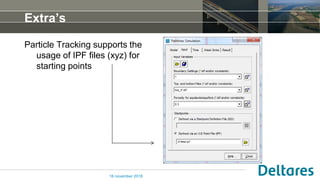

The document discusses the release of version 4.3 of a software by Peter Vermeulen, focusing on the use of double precision coordinates in various file types such as idf and isg for improved accuracy. It highlights the conversion between single and double precision, the new binary format for gen-files, and additional features like sorting and interactive tools in imod. Notably, it addresses the limitations of using singular precision for accuracy in coordinate representation.


![谷歌留痕技术教程[ 𝙩𝙤𝙥 𝟮𝟯𝟯. 𝙘 𝙤𝙢 ]](https://cdn.slidesharecdn.com/ss_thumbnails/top233-260130173900-2eb784f9-thumbnail.jpg?width=640&height=640&fit=bounds)


