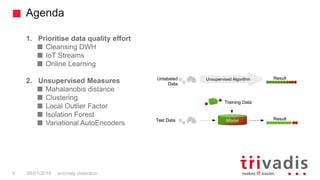
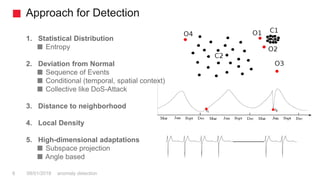
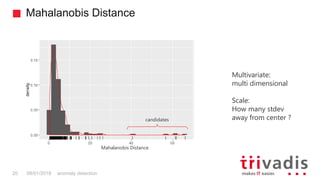
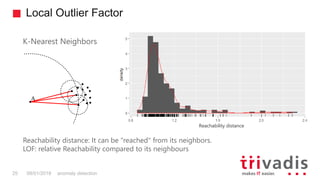
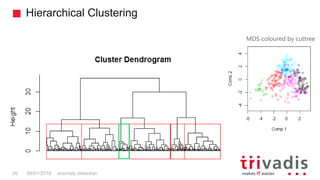
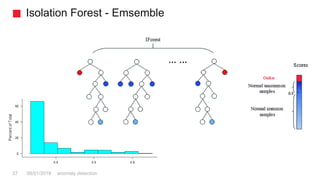
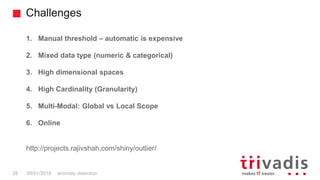
Trivadis is a market leader in IT consulting, system integration, solution engineering and IT services focusing on technologies in Switzerland, Germany, Austria and Denmark. Trivadis Services takes over the interacting operation of your IT systems. The document discusses various techniques for anomaly detection including unsupervised measures like Mahalanobis distance and clustering as well as approaches for detecting anomalies in univariate and multivariate data and challenges with anomaly detection.


![Scoring Engine for R
3
EXEC sp_execute_external_script
@language =N'R',
-- SQL Part (sends to @script)
@input_data_1 =N 'SELECT 1 as Installed',
-- R Part (gets @input_data_1)
@script=N'OutputDataSet<-InputDataSet'
WITH RESULT SETS
(([Installed] int not null));
GO
Microsoft R ServerLaunchpad
(BxlServer and
SQL Satellite,
Rserver.dll)
08/01/2018 anomaly detection](https://image.slidesharecdn.com/nimzanomalydetection-180315111950/85/Anomaly-detection-database-integrated-3-320.jpg)


![[Pervasive systems: Final Project Presentation] The Sparkle Lung System](https://cdn.slidesharecdn.com/ss_thumbnails/pervasivesystemsfinalprojectpresentation-180604153255-thumbnail.jpg?width=640&height=640&fit=bounds)


![20260201 [FOSDEM] gomodjail - library sandboxing for Go modules.pdf](https://cdn.slidesharecdn.com/ss_thumbnails/20260201fosdemgomodjail-librarysandboxingforgomodules-260201225659-76609ec4-thumbnail.jpg?width=640&height=640&fit=bounds)

![谷歌留痕技术教程[ 𝙩𝙤𝙥 𝟮𝟯𝟯. 𝙘 𝙤𝙢 ]](https://cdn.slidesharecdn.com/ss_thumbnails/top233-260130173900-2eb784f9-thumbnail.jpg?width=640&height=640&fit=bounds)


