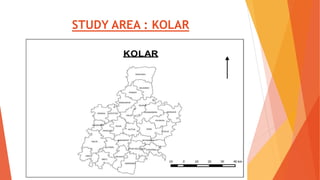
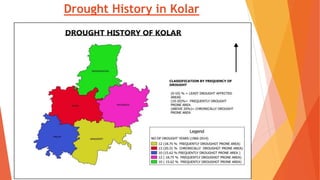
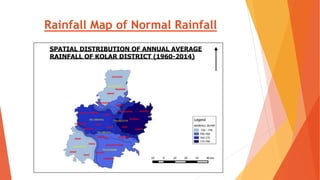
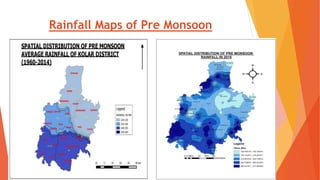
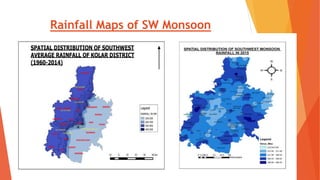
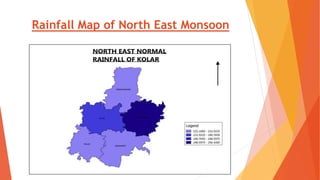
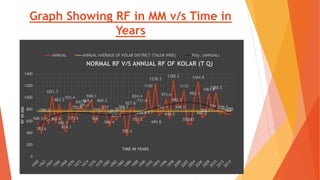
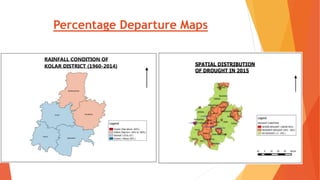
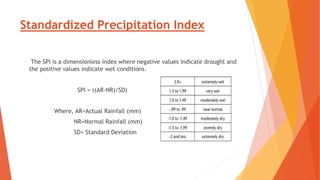
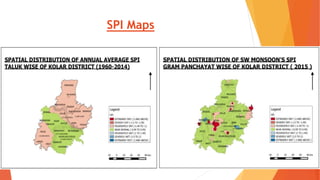
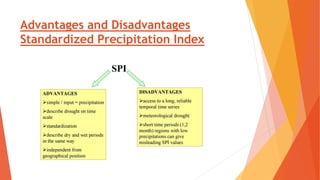
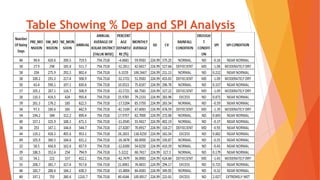
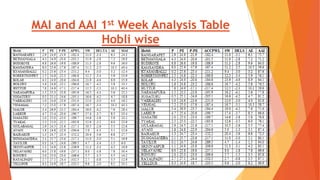
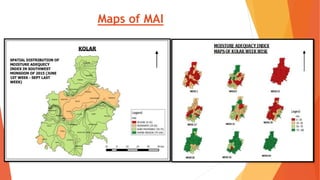
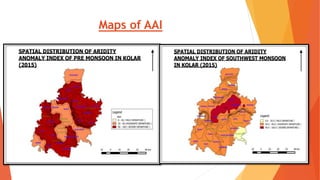
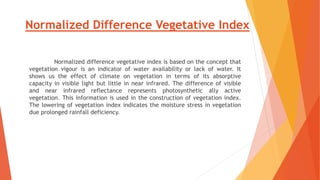
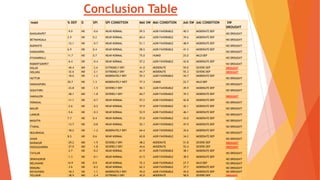
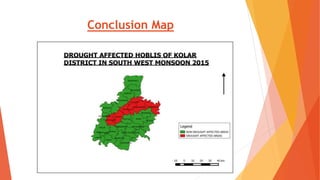
SlideShare a Scribd company logo
1 of 36
ASSESSMENT OF DROUGHT USING RS AND
GIS FOR KOLAR DISTRICT
AKASH K P
5WD14CGI02
CONTENTS
 Introduction to Study Area
 Rainfall Analysis
 Drought Analysis
 Discussion and Conclusion
 Recommendations
STUDY AREA : KOLAR
Agro-Climatic/Ecological Zone of Kolar
District
 Agro Ecological Sub Region (ICAR): Central Karanantaka Plateau, hot, moist
semi-arid eco-subregion
 Agro-Climatic Region (Planning Commission): Southern Plateau and Hills
Region (X)
 Agro Climatic Zone (NARP): Eastern Dry Zone (KA-5)
 These all the districts or part there of falling under the NARP Zone Tumkur,
Bengaluru Rural, Bengaluru Urban, Ramanagara, Kolar , Chikkaballapur
Tumkur, Bengaluru Rural, Bengaluru Urban, Ramanagara, Kolar ,
Chikkaballapur
Drought History in Kolar
Rainfall Map of Normal Rainfall
Rainfall Maps of Pre Monsoon
Rainfall Maps of SW Monsoon
Rainfall Map of North East Monsoon
Graph Showing RF in MM v/s Time in
Years
568.3
393.6
705.3
554.1
1021.7
562.8
883.5
492.7
424.1
922.4
573.6
755.8
847.9
791.1
869.1
948.1
566
715.7
869.3
757
506.4
689.7
622.3
724.9
766.2
355.3
827.6
824.4
553.2
665.4675.8
1120
731.8
1238.3
695.8
760.1
973.6
644.2
1285.2
883.5
844.5
1115
552.1547
992.1
1264.8
662.2
702.7
1061.8
774
1088.5
717
759.5
716.5725
0
200
400
600
800
1000
1200
1400
RFINMM
TIME IN YEARS
NORMAL RF V/S ANNUAL RF OF KOLAR (T Q)
ANNUAL ANNUAL AVERAGE OF KOLAR DISTRICT (TALUK WISE) Poly. (ANNUAL)
What is Drought?
Drought is the consequence of a natural reduction in
the amount of precipitation over an extended period of
time, usually a season or more in length, often associated
with other climatic factors (viz. high temperatures, high
winds and low relative humidity) that can aggravate the
severity of the drought event.
What are the different types of
drought?
1. Meteorological Drought
2. Hydrological Drought
3. Agricultural Drought
4. Socio-Economic Drought
DROUGHT PARAMETERS USED
1. Meteorological Drought Parameters
a. Seasonal Departure From Rainfall
b. Standardized Precipitation Index
2. Agricultural Drought Parameters
a. Moisture Adequacy Index
b. Aridity Anomaly Index
c. Normalized Difference Vegetation Index
Defining and monitoring of Drought
1.Meteorogical Drought
In India, commonly meteorological drought over an area is defined as a
situation when the seasonal rainfall received over the area is less than 75% of its long
term average value. It is further classified according to KSNDMC
1. Deficit=if Negative departure is between 20 TO 60%
2. Scanty=if Negative departure is Above the 60% of the normal.
SEASONAL PERCENTAGE DEPARTURE OF
RAINFALL
Departure of rainfall (%) = ((AR-NR)/NR)*100
Where, AR=Actual Rainfall (mm)
NR=Normal Rainfall (mm)
Percentage Departure Maps
Standardized Precipitation Index
The SPI is a dimensionless index where negative values indicate drought and
the positive values indicate wet conditions.
SPI = ((AR-NR)/SD)
Where, AR=Actual Rainfall (mm)
NR=Normal Rainfall (mm)
SD= Standard Deviation
SPI Maps
Advantages and Disadvantages
Standardized Precipitation Index
Table Showing % Dep and SPI Analysis
Defining and monitoring of Drought
2.Agricultural Drought
It occurs when soil moisture and rainfall are inadequate
during crop growing season to support healthy crop maturity
and cause extreme crop growth to maturity and cause
extreme crop stress and wilt.
Here are some of the parameters that describes Agricultural
drought we have used in KSNDMC.
a. Moisture Adequacy Index
b. Aridity Anomaly Index
c. Normalized Difference Vegetation Index
Moisture Adequacy Index and Aridity
Anomaly Index
MAI: According to Thornthwaite’s Concept MAI is Defined as the ratio of
actual evapotranspiration to potential evapotranspiration (PET) and is a good
indicator of moisture status of the soil in relation to the water need.
AAI: An aridity anomaly index (AI) is a numerical indicator of the degree of
dryness of the climate at a given location.
According to Thornthwaite’s Concept AAI is Defined as The ratio of Difference
between Actual Evapotranspiration and Potential Evopotranspiration to the
mean annual potential evapotranspiration (PET).
Formula’s and Classification’s
When P>PET,
 AET =PET
When P<PET,
 AET = PET+ (P-PE) - dS
MAI = (AET/PET) * 100
AAI = (PET-AET)/PET * 100
 AWC = Available Water Capacity
 (field capacity-wilting point)X(soil depth)
 SW = Available Soil Water (i.e., above wilting pt.)
 APWL = Accumulated Potential Water Loss (negative)
 P = Net Precipitation; P - PET
 P = Precipitation
 PET = Potential Evapotranspiration
 AET = Actual Evapotranspiration
 Delta = Difference in Previous Week and Present Week Available Soil Water
MAI MAI CONDITION
0-25 SEVERE
25-50 MODERATE
50-75 AGRI FAVORABLE
75-100 HUMID REGION
AAI AAI CONDITION
0-30 MILD DEPARTURE
30-50 MODERATE DEPARTURE
50-100 SEVERE DEPARTURE
MAI and AAI 1st Week Analysis Table
Hobli wise
Maps of MAI
Maps of AAI
Normalized Difference Vegetative Index
Normalized difference vegetative index is based on the concept that
vegetation vigour is an indicator of water availability or lack of water. It
shows us the effect of climate on vegetation in terms of its absorptive
capacity in visible light but little in near infrared. The difference of visible
and near infrared reflectance represents photosynthetic ally active
vegetation. This information is used in the construction of vegetation index.
The lowering of vegetation index indicates the moisture stress in vegetation
due prolonged rainfall deficiency.
NDVI Classification
 The map from June to September for the year 2015 shown below depicts the
vegetation health index
 The vegetation pattern are been classifies as follows
 Green colour- Healthy Crops
 Yellow indicates-Moderate Moisture stress on the crops
 Brown indicates-Sever Moisture stress on the crops
Maps of NDVI
Maps of NDVI
Graph’s Showing Variation of NDVI
Chart and Percentage Departure
JUNE JULY AUGUST SEPTEMBER OCTOBER
2011 0.3 0.3 0.2 0.4 0.5
2012 0.2 0.2 0.3 0.3 0.4
2013 0.2 0.1 0.3 0.4 0.5
2014 0.2 0.2 0.2 0.3 0.4
2015 0.3 0.2 0.3 0.4 0.5
0.3
0.3
0.2
0.4
0.5
0.2
0.2 0.3
0.3
0.4
0.2
0.1
0.3
0.4
0.5
0.2 0.2
0.2
0.3
0.4
0.3
0.2
0.3
0.4
0.5
0.0
0.1
0.2
0.3
0.4
0.5
0.6
VARIATION OF NDVI CHART IN KOLAR
TALUK
2011 2012 2013 2014 2015
JUNE JULY AUGUST SEPTEMBER OCTOBER
2011 7.5 24.4 -35.1 3.1 1.8
2012 -3.6 20.0 14.4 -3.9 -15.5
2013 -28.4 -50.5 29.7 18.5 8.6
2014 -4.3 -10.7 -19.5 -24.5 -7.6
2015 28.8 16.7 10.5 6.8 12.8
7.5 24.4
-35.1
3.1 1.8-3.6
20.0
14.4
-3.9
-15.5
-28.4
-50.5
29.7
18.5
8.6
-4.3 -10.7
-19.5
-24.5
-7.6
28.8
16.7
10.5
6.8
12.8
-60.0
-50.0
-40.0
-30.0
-20.0
-10.0
0.0
10.0
20.0
30.0
40.0
PERCENTAGE DEPARTURE FROM AVERAGE
NDVI (2011- 2015) IN KOLAR TALUK
2011 2012 2013 2014 2015
Conclusion’s
According to KSNDMC any 2 indices out of 4 indices satisfies Drought
means they will declare as drought affected regions.
So we found 6 hobli’s out of 27 hoblis in a Kolar district are affected by
drought during South West Monsoon 2015.
Conclusion Table
Hobli % DEP D SPI SPI CONDITION MAI SW MAI CONDITION AAI SW AAI CONDITION SW
DROUGHT
BANGARAPET
-9.0 ND -0.6 NEAR NORMAL 59.5 AGRI FAVORABLE 40.5 MODERATE DEP
NO DROUGHT
BETMANGALA
2.9 ND 0.2 NEAR NORMAL 60.4 AGRI FAVORABLE 39.6 MODERATE DEP
NO DROUGHT
BUDIKOTE
-12.1 ND -0.7 NEAR NORMAL 51.1 AGRI FAVORABLE 48.9 MODERATE DEP
NO DROUGHT
KAMSANDRA
6.9 ND 0.4 NEAR NORMAL 58.5 AGRI FAVORABLE 41.5 MODERATE DEP
NO DROUGHT
KYASAMBALLI
11.7 ND 0.7 NEAR NORMAL 75.0 HUMID 25.0 MILD DEP
NO DROUGHT
ROBERTSONPET
-6.4 ND -0.4 NEAR NORMAL 57.2 AGRI FAVORABLE 42.8 MODERATE DEP
NO DROUGHT
KOLAR -40.4 MD -2.6 EXTREMELY DRY 41.0 MODERATE 59.0 SEVERE DEP DROUGHT
HOLURU -32.6 MD -2.1 EXTREMELY DRY 44.7 MODERATE 55.3 SEVERE DEP DROUGHT
HUTTUR
-18.6 ND -1.2 MODERATELY DRY 55.3 AGRI FAVORABLE 44.7 MODERATE DEP
NO DROUGHT
NARASAPURA
20.7 ND 1.3 MODERATELY WET 77.3 HUMID 22.7 MILD DEP
NO DROUGHT
SUGATURU
-23.8 ND -1.5 SEVERELY DRY 50.1 AGRI FAVORABLE 49.9 MODERATE DEP
NO DROUGHT
VAKKALERI
-28.1 MD -1.8 SEVERELY DRY 60.7 AGRI FAVORABLE 39.3 MODERATE DEP
DROUGHT
VEMAGAL
-11.1 ND -0.7 NEAR NORMAL 57.2 AGRI FAVORABLE 42.8 MODERATE DEP
NO DROUGHT
MALUR
-2.6 ND -0.2 NEAR NORMAL 57.9 AGRI FAVORABLE 42.1 MODERATE DEP
NO DROUGHT
LAKKUR
-5.6 ND -0.3 NEAR NORMAL 53.9 AGRI FAVORABLE 46.1 MODERATE DEP
NO DROUGHT
MASATHI
7.7 ND 0.4 NEAR NORMAL 57.0 AGRI FAVORABLE 43.0 MODERATE DEP
NO DROUGHT
TYAKAL
-13.7 ND -0.8 NEAR NORMAL 52.1 AGRI FAVORABLE 47.9 MODERATE DEP
NO DROUGHT
MULABAGAL
-18.2 ND -1.2 MODERATELY DRY 64.4 AGRI FAVORABLE 35.6 MODERATE DEP
NO DROUGHT
AVANI
8.5 ND 0.6 NEAR NORMAL 65.8 AGRI FAVORABLE 34.2 MODERATE DEP
NO DROUGHT
BAIRAKUR -29.2 MD -1.9 SEVERELY DRY 48.2 MODERATE 51.8 SEVERE DEP DROUGHT
DUGGASANDRA -27.0 MD -1.8 SEVERELY DRY 44.6 MODERATE 55.4 SEVERE DEP DROUGHT
TAYILUR
-2.7 ND -0.2 NEAR NORMAL 61.9 AGRI FAVORABLE 38.1 MODERATE DEP
NO DROUGHT
SRINIVASPUR
-1.3 ND -0.1 NEAR NORMAL 61.5 AGRI FAVORABLE 38.5 MODERATE DEP
NO DROUGHT
NELAVANKI 14.9 ND 0.9 NEAR NORMAL 72.3 AGRI FAVORABLE 27.7 MILD DEP NO DROUGHT
RONURU -3.6 ND -0.2 NEAR NORMAL 62.3 AGRI FAVORABLE 37.7 MODERATE DEP NO DROUGHT
RAYALPADU -18.3 ND -1.1 MODERATELY DRY 55.0 AGRI FAVORABLE 45.0 MODERATE DEP NO DROUGHT
YELLDUR -38.9 MD -2.4 EXTREMELY DRY 42.0 MODERATE 58.0 SEVERE DEP DROUGHT
Conclusion Map
THANK YOU…..

More Related Content

What's hot

Using GIS for Water Resources Management – Selected U.S. and International Ap...
Using GIS for Water Resources Management – Selected U.S. and International Ap...Using GIS for Water Resources Management – Selected U.S. and International Ap...
Using GIS for Water Resources Management – Selected U.S. and International Ap...
Michael Baker Jr., Inc.
 
Presentation watershed
Presentation watershedPresentation watershed
Presentation watershed
akshitakohli
 
Climate change impact assessment on hydrology on river basins
Climate change impact assessment on hydrology on river basinsClimate change impact assessment on hydrology on river basins
Climate change impact assessment on hydrology on river basins
Abhiram Kanigolla
 
Introduction to Groundwater Modelling
Introduction to Groundwater ModellingIntroduction to Groundwater Modelling
Introduction to Groundwater Modelling
C. P. Kumar
 

What's hot (20)

Flood vulnerability and risk mapping
Flood vulnerability and risk mappingFlood vulnerability and risk mapping
Flood vulnerability and risk mapping
 
Iirs overview -Remote sensing and GIS application in Water Resources Management
Iirs overview -Remote sensing and GIS application in Water Resources ManagementIirs overview -Remote sensing and GIS application in Water Resources Management
Iirs overview -Remote sensing and GIS application in Water Resources Management
 
Hydrological modelling
Hydrological modellingHydrological modelling
Hydrological modelling
 
REMOTE SENSING & GIS APPLICATIONS IN WATERSHED MANAGEMENT
REMOTE SENSING & GIS APPLICATIONS IN WATERSHED MANAGEMENT REMOTE SENSING & GIS APPLICATIONS IN WATERSHED MANAGEMENT
REMOTE SENSING & GIS APPLICATIONS IN WATERSHED MANAGEMENT
 
Rainfall-Runoff Modelling
Rainfall-Runoff ModellingRainfall-Runoff Modelling
Rainfall-Runoff Modelling
 
Using GIS for Water Resources Management – Selected U.S. and International Ap...
Using GIS for Water Resources Management – Selected U.S. and International Ap...Using GIS for Water Resources Management – Selected U.S. and International Ap...
Using GIS for Water Resources Management – Selected U.S. and International Ap...
 
Presentation watershed
Presentation watershedPresentation watershed
Presentation watershed
 
Climate change impact assessment on hydrology on river basins
Climate change impact assessment on hydrology on river basinsClimate change impact assessment on hydrology on river basins
Climate change impact assessment on hydrology on river basins
 
Flood forecasting presentation final
Flood forecasting presentation finalFlood forecasting presentation final
Flood forecasting presentation final
 
Aquifer Mapping Programme
Aquifer Mapping ProgrammeAquifer Mapping Programme
Aquifer Mapping Programme
 
Introduction to IWRM
Introduction to IWRM Introduction to IWRM
Introduction to IWRM
 
Agriculture drought with remote sensing
Agriculture drought with remote sensingAgriculture drought with remote sensing
Agriculture drought with remote sensing
 
Integrated water resources management
Integrated water resources managementIntegrated water resources management
Integrated water resources management
 
Water accounting plus (WA+): A tool for basin-wide water accounting using rem...
Water accounting plus (WA+): A tool for basin-wide water accounting using rem...Water accounting plus (WA+): A tool for basin-wide water accounting using rem...
Water accounting plus (WA+): A tool for basin-wide water accounting using rem...
 
Drought indices
Drought indicesDrought indices
Drought indices
 
Advances in agricultural drought monitoring and forecasting
Advances in agricultural drought monitoring and forecastingAdvances in agricultural drought monitoring and forecasting
Advances in agricultural drought monitoring and forecasting
 
Seminar on Hydrological modelling
Seminar on Hydrological modellingSeminar on Hydrological modelling
Seminar on Hydrological modelling
 
Land use land cover impacts
Land use land cover impactsLand use land cover impacts
Land use land cover impacts
 
Introduction to Groundwater Modelling
Introduction to Groundwater ModellingIntroduction to Groundwater Modelling
Introduction to Groundwater Modelling
 
Flood risk assessment methodology
Flood risk assessment methodologyFlood risk assessment methodology
Flood risk assessment methodology
 

Viewers also liked

ADOpresentation.lv20150714
ADOpresentation.lv20150714ADOpresentation.lv20150714
ADOpresentation.lv20150714
Luana Valentini
 
Integrated Drought Management Programme, as presented at the World Irrigation...
Integrated Drought Management Programme, as presented at the World Irrigation...Integrated Drought Management Programme, as presented at the World Irrigation...
Integrated Drought Management Programme, as presented at the World Irrigation...
Global Water Partnership
 
Application of gis & rs in urban planning
Application of gis & rs in urban planning Application of gis & rs in urban planning
Application of gis & rs in urban planning
sathish1446
 

Viewers also liked (20)

Drought - By Arpit Jain
Drought - By Arpit JainDrought - By Arpit Jain
Drought - By Arpit Jain
 
Drought Monitoring and Early Warning Indicators by Lucka Bogataj, University ...
Drought Monitoring and Early Warning Indicators by Lucka Bogataj, University ...Drought Monitoring and Early Warning Indicators by Lucka Bogataj, University ...
Drought Monitoring and Early Warning Indicators by Lucka Bogataj, University ...
 
Drought
DroughtDrought
Drought
 
Nov 2012 global warming drought trend
Nov 2012 global warming drought trendNov 2012 global warming drought trend
Nov 2012 global warming drought trend
 
ADOpresentation.lv20150714
ADOpresentation.lv20150714ADOpresentation.lv20150714
ADOpresentation.lv20150714
 
Integrated Drought Management Programme, as presented at the World Irrigation...
Integrated Drought Management Programme, as presented at the World Irrigation...Integrated Drought Management Programme, as presented at the World Irrigation...
Integrated Drought Management Programme, as presented at the World Irrigation...
 
Space-based Information and Solutions for Disaster Management and Emergency ...
Space-based Information and Solutions for  Disaster Management and Emergency ...Space-based Information and Solutions for  Disaster Management and Emergency ...
Space-based Information and Solutions for Disaster Management and Emergency ...
 
Role of RS & GIS; gis in disaster management prepared by er. bishnu khatri
Role of RS & GIS; gis in disaster management prepared by er. bishnu khatriRole of RS & GIS; gis in disaster management prepared by er. bishnu khatri
Role of RS & GIS; gis in disaster management prepared by er. bishnu khatri
 
Introduction to ICST 2017
Introduction to ICST 2017Introduction to ICST 2017
Introduction to ICST 2017
 
Space Technologies for Disaster Management
Space Technologies for Disaster ManagementSpace Technologies for Disaster Management
Space Technologies for Disaster Management
 
Intro to RS and GIS by mndp poonia
Intro to RS and GIS by mndp pooniaIntro to RS and GIS by mndp poonia
Intro to RS and GIS by mndp poonia
 
Drought Risk Assessment
Drought Risk Assessment Drought Risk Assessment
Drought Risk Assessment
 
Application of gis and remote sensing in disease prevention and control with
Application of gis and remote sensing in disease prevention and control withApplication of gis and remote sensing in disease prevention and control with
Application of gis and remote sensing in disease prevention and control with
 
Rahul Bajpai M.tech Remote sensing & GIS RSACUP
Rahul Bajpai M.tech Remote sensing & GIS RSACUPRahul Bajpai M.tech Remote sensing & GIS RSACUP
Rahul Bajpai M.tech Remote sensing & GIS RSACUP
 
Drought Assessment and Mitigation in Southwest Asia
Drought Assessment and Mitigation in Southwest AsiaDrought Assessment and Mitigation in Southwest Asia
Drought Assessment and Mitigation in Southwest Asia
 
GIS IN DISASTER MANAGEMENT
GIS IN DISASTER MANAGEMENTGIS IN DISASTER MANAGEMENT
GIS IN DISASTER MANAGEMENT
 
Application of gis in natural disaster management
Application of gis in natural disaster managementApplication of gis in natural disaster management
Application of gis in natural disaster management
 
Disaster management using Remote sensing and GIS
Disaster management using Remote sensing and GISDisaster management using Remote sensing and GIS
Disaster management using Remote sensing and GIS
 
Application of gis & rs in urban planning
Application of gis & rs in urban planning Application of gis & rs in urban planning
Application of gis & rs in urban planning
 
Drought
DroughtDrought
Drought
 

Similar to DROUGHT ANALYSIS

Download-manuals-surface water-manual-sw-volume3referencemanualhydro-meteoro...
 Download-manuals-surface water-manual-sw-volume3referencemanualhydro-meteoro... Download-manuals-surface water-manual-sw-volume3referencemanualhydro-meteoro...
Download-manuals-surface water-manual-sw-volume3referencemanualhydro-meteoro...
hydrologyproject001
 
Download-manuals-surface water-manual-sw-volume3referencemanualhydro-meteoro...
 Download-manuals-surface water-manual-sw-volume3referencemanualhydro-meteoro... Download-manuals-surface water-manual-sw-volume3referencemanualhydro-meteoro...
Download-manuals-surface water-manual-sw-volume3referencemanualhydro-meteoro...
hydrologyproject001
 
Download-manuals-ground water-manual-gw-volume3referencemanualhydro-meteorology
 Download-manuals-ground water-manual-gw-volume3referencemanualhydro-meteorology Download-manuals-ground water-manual-gw-volume3referencemanualhydro-meteorology
Download-manuals-ground water-manual-gw-volume3referencemanualhydro-meteorology
hydrologyproject001
 
Sarah CONRADT "Reducing meteorological basis risk in a semi-arid agricultural...
Sarah CONRADT "Reducing meteorological basis risk in a semi-arid agricultural...Sarah CONRADT "Reducing meteorological basis risk in a semi-arid agricultural...
Sarah CONRADT "Reducing meteorological basis risk in a semi-arid agricultural...
Global Risk Forum GRFDavos
 
Cn tu12 6_isric_glada_mapping_of_desire_study_sites_bai
Cn tu12 6_isric_glada_mapping_of_desire_study_sites_baiCn tu12 6_isric_glada_mapping_of_desire_study_sites_bai
Cn tu12 6_isric_glada_mapping_of_desire_study_sites_bai
Erik van den Elsen
 
Purpose driven study assessment of effects of sedimentation on the capacity...
Purpose driven study   assessment of effects of sedimentation on the capacity...Purpose driven study   assessment of effects of sedimentation on the capacity...
Purpose driven study assessment of effects of sedimentation on the capacity...
hydrologywebsite1
 
Download-manuals-surface water-manual-sw-volume4referencemanualhydrometry
 Download-manuals-surface water-manual-sw-volume4referencemanualhydrometry Download-manuals-surface water-manual-sw-volume4referencemanualhydrometry
Download-manuals-surface water-manual-sw-volume4referencemanualhydrometry
hydrologyproject001
 

Similar to DROUGHT ANALYSIS (20)

Barind nw bangladesh drought gw and adaptation
Barind nw bangladesh drought gw and adaptationBarind nw bangladesh drought gw and adaptation
Barind nw bangladesh drought gw and adaptation
 
Soil Erosion for Vishwamitri River watershed using RS and GIS
Soil Erosion for Vishwamitri River watershed using RS and GISSoil Erosion for Vishwamitri River watershed using RS and GIS
Soil Erosion for Vishwamitri River watershed using RS and GIS
 
Download-manuals-surface water-manual-sw-volume3referencemanualhydro-meteoro...
 Download-manuals-surface water-manual-sw-volume3referencemanualhydro-meteoro... Download-manuals-surface water-manual-sw-volume3referencemanualhydro-meteoro...
Download-manuals-surface water-manual-sw-volume3referencemanualhydro-meteoro...
 
Download-manuals-surface water-manual-sw-volume3referencemanualhydro-meteoro...
 Download-manuals-surface water-manual-sw-volume3referencemanualhydro-meteoro... Download-manuals-surface water-manual-sw-volume3referencemanualhydro-meteoro...
Download-manuals-surface water-manual-sw-volume3referencemanualhydro-meteoro...
 
Weekly Rainfall Analysis for Crop Planning Using Markov’s Chain Model for Kan...
Weekly Rainfall Analysis for Crop Planning Using Markov’s Chain Model for Kan...Weekly Rainfall Analysis for Crop Planning Using Markov’s Chain Model for Kan...
Weekly Rainfall Analysis for Crop Planning Using Markov’s Chain Model for Kan...
 
Download-manuals-ground water-manual-gw-volume3referencemanualhydro-meteorology
 Download-manuals-ground water-manual-gw-volume3referencemanualhydro-meteorology Download-manuals-ground water-manual-gw-volume3referencemanualhydro-meteorology
Download-manuals-ground water-manual-gw-volume3referencemanualhydro-meteorology
 
Download-manuals-ground water-manual-gw-volume3referencemanualhydro-meteorology
 Download-manuals-ground water-manual-gw-volume3referencemanualhydro-meteorology Download-manuals-ground water-manual-gw-volume3referencemanualhydro-meteorology
Download-manuals-ground water-manual-gw-volume3referencemanualhydro-meteorology
 
Remote Sensing Methods for operational ET determinations in the NENA region, ...
Remote Sensing Methods for operational ET determinations in the NENA region, ...Remote Sensing Methods for operational ET determinations in the NENA region, ...
Remote Sensing Methods for operational ET determinations in the NENA region, ...
 
GROUNDWATER FLOW SIMULATION IN GUIMARAS ISLAND, PHILIPPINE
GROUNDWATER FLOW SIMULATION IN GUIMARAS ISLAND, PHILIPPINEGROUNDWATER FLOW SIMULATION IN GUIMARAS ISLAND, PHILIPPINE
GROUNDWATER FLOW SIMULATION IN GUIMARAS ISLAND, PHILIPPINE
 
5 ijsrms-02617 (1)
5 ijsrms-02617 (1)5 ijsrms-02617 (1)
5 ijsrms-02617 (1)
 
Success Story of Sarahan Watershed District Sirmour
Success Story of Sarahan Watershed District SirmourSuccess Story of Sarahan Watershed District Sirmour
Success Story of Sarahan Watershed District Sirmour
 
T7: Flood Risk Assessment Using GIS Tools
T7: Flood Risk Assessment Using GIS ToolsT7: Flood Risk Assessment Using GIS Tools
T7: Flood Risk Assessment Using GIS Tools
 
Sarah CONRADT "Reducing meteorological basis risk in a semi-arid agricultural...
Sarah CONRADT "Reducing meteorological basis risk in a semi-arid agricultural...Sarah CONRADT "Reducing meteorological basis risk in a semi-arid agricultural...
Sarah CONRADT "Reducing meteorological basis risk in a semi-arid agricultural...
 
Cn tu12 6_isric_glada_mapping_of_desire_study_sites_bai
Cn tu12 6_isric_glada_mapping_of_desire_study_sites_baiCn tu12 6_isric_glada_mapping_of_desire_study_sites_bai
Cn tu12 6_isric_glada_mapping_of_desire_study_sites_bai
 
Watershed district sirmour
Watershed district sirmourWatershed district sirmour
Watershed district sirmour
 
Purpose driven study assessment of effects of sedimentation on the capacity...
Purpose driven study   assessment of effects of sedimentation on the capacity...Purpose driven study   assessment of effects of sedimentation on the capacity...
Purpose driven study assessment of effects of sedimentation on the capacity...
 
Download-manuals-surface water-manual-sw-volume4referencemanualhydrometry
 Download-manuals-surface water-manual-sw-volume4referencemanualhydrometry Download-manuals-surface water-manual-sw-volume4referencemanualhydrometry
Download-manuals-surface water-manual-sw-volume4referencemanualhydrometry
 
11 - NIH 1 - Snowmelt Runoff-Sep-16
11 - NIH 1 - Snowmelt Runoff-Sep-1611 - NIH 1 - Snowmelt Runoff-Sep-16
11 - NIH 1 - Snowmelt Runoff-Sep-16
 
Water stress and climate change adaptation: From trait dissection to yield
Water stress and climate change adaptation: From trait dissection to yieldWater stress and climate change adaptation: From trait dissection to yield
Water stress and climate change adaptation: From trait dissection to yield
 
Ex-ante modeling analysis of maize yield responses to nutrient management opt...
Ex-ante modeling analysis of maize yield responses to nutrient management opt...Ex-ante modeling analysis of maize yield responses to nutrient management opt...
Ex-ante modeling analysis of maize yield responses to nutrient management opt...
 

DROUGHT ANALYSIS

  • 1. ASSESSMENT OF DROUGHT USING RS AND GIS FOR KOLAR DISTRICT AKASH K P 5WD14CGI02
  • 2. CONTENTS  Introduction to Study Area  Rainfall Analysis  Drought Analysis  Discussion and Conclusion  Recommendations
  • 3. STUDY AREA : KOLAR
  • 4. Agro-Climatic/Ecological Zone of Kolar District  Agro Ecological Sub Region (ICAR): Central Karanantaka Plateau, hot, moist semi-arid eco-subregion  Agro-Climatic Region (Planning Commission): Southern Plateau and Hills Region (X)  Agro Climatic Zone (NARP): Eastern Dry Zone (KA-5)  These all the districts or part there of falling under the NARP Zone Tumkur, Bengaluru Rural, Bengaluru Urban, Ramanagara, Kolar , Chikkaballapur Tumkur, Bengaluru Rural, Bengaluru Urban, Ramanagara, Kolar , Chikkaballapur
  • 6. Rainfall Map of Normal Rainfall
  • 7. Rainfall Maps of Pre Monsoon
  • 8. Rainfall Maps of SW Monsoon
  • 9. Rainfall Map of North East Monsoon
  • 10. Graph Showing RF in MM v/s Time in Years 568.3 393.6 705.3 554.1 1021.7 562.8 883.5 492.7 424.1 922.4 573.6 755.8 847.9 791.1 869.1 948.1 566 715.7 869.3 757 506.4 689.7 622.3 724.9 766.2 355.3 827.6 824.4 553.2 665.4675.8 1120 731.8 1238.3 695.8 760.1 973.6 644.2 1285.2 883.5 844.5 1115 552.1547 992.1 1264.8 662.2 702.7 1061.8 774 1088.5 717 759.5 716.5725 0 200 400 600 800 1000 1200 1400 RFINMM TIME IN YEARS NORMAL RF V/S ANNUAL RF OF KOLAR (T Q) ANNUAL ANNUAL AVERAGE OF KOLAR DISTRICT (TALUK WISE) Poly. (ANNUAL)
  • 11. What is Drought? Drought is the consequence of a natural reduction in the amount of precipitation over an extended period of time, usually a season or more in length, often associated with other climatic factors (viz. high temperatures, high winds and low relative humidity) that can aggravate the severity of the drought event.
  • 12. What are the different types of drought? 1. Meteorological Drought 2. Hydrological Drought 3. Agricultural Drought 4. Socio-Economic Drought
  • 13. DROUGHT PARAMETERS USED 1. Meteorological Drought Parameters a. Seasonal Departure From Rainfall b. Standardized Precipitation Index 2. Agricultural Drought Parameters a. Moisture Adequacy Index b. Aridity Anomaly Index c. Normalized Difference Vegetation Index
  • 14. Defining and monitoring of Drought 1.Meteorogical Drought In India, commonly meteorological drought over an area is defined as a situation when the seasonal rainfall received over the area is less than 75% of its long term average value. It is further classified according to KSNDMC 1. Deficit=if Negative departure is between 20 TO 60% 2. Scanty=if Negative departure is Above the 60% of the normal.
  • 15. SEASONAL PERCENTAGE DEPARTURE OF RAINFALL Departure of rainfall (%) = ((AR-NR)/NR)*100 Where, AR=Actual Rainfall (mm) NR=Normal Rainfall (mm)
  • 17. Standardized Precipitation Index The SPI is a dimensionless index where negative values indicate drought and the positive values indicate wet conditions. SPI = ((AR-NR)/SD) Where, AR=Actual Rainfall (mm) NR=Normal Rainfall (mm) SD= Standard Deviation
  • 20. Table Showing % Dep and SPI Analysis
  • 21. Defining and monitoring of Drought 2.Agricultural Drought It occurs when soil moisture and rainfall are inadequate during crop growing season to support healthy crop maturity and cause extreme crop growth to maturity and cause extreme crop stress and wilt. Here are some of the parameters that describes Agricultural drought we have used in KSNDMC. a. Moisture Adequacy Index b. Aridity Anomaly Index c. Normalized Difference Vegetation Index
  • 22. Moisture Adequacy Index and Aridity Anomaly Index MAI: According to Thornthwaite’s Concept MAI is Defined as the ratio of actual evapotranspiration to potential evapotranspiration (PET) and is a good indicator of moisture status of the soil in relation to the water need. AAI: An aridity anomaly index (AI) is a numerical indicator of the degree of dryness of the climate at a given location. According to Thornthwaite’s Concept AAI is Defined as The ratio of Difference between Actual Evapotranspiration and Potential Evopotranspiration to the mean annual potential evapotranspiration (PET).
  • 24. When P>PET,  AET =PET When P<PET,  AET = PET+ (P-PE) - dS MAI = (AET/PET) * 100 AAI = (PET-AET)/PET * 100  AWC = Available Water Capacity  (field capacity-wilting point)X(soil depth)  SW = Available Soil Water (i.e., above wilting pt.)  APWL = Accumulated Potential Water Loss (negative)  P = Net Precipitation; P - PET  P = Precipitation  PET = Potential Evapotranspiration  AET = Actual Evapotranspiration  Delta = Difference in Previous Week and Present Week Available Soil Water MAI MAI CONDITION 0-25 SEVERE 25-50 MODERATE 50-75 AGRI FAVORABLE 75-100 HUMID REGION AAI AAI CONDITION 0-30 MILD DEPARTURE 30-50 MODERATE DEPARTURE 50-100 SEVERE DEPARTURE
  • 25. MAI and AAI 1st Week Analysis Table Hobli wise
  • 28. Normalized Difference Vegetative Index Normalized difference vegetative index is based on the concept that vegetation vigour is an indicator of water availability or lack of water. It shows us the effect of climate on vegetation in terms of its absorptive capacity in visible light but little in near infrared. The difference of visible and near infrared reflectance represents photosynthetic ally active vegetation. This information is used in the construction of vegetation index. The lowering of vegetation index indicates the moisture stress in vegetation due prolonged rainfall deficiency.
  • 29. NDVI Classification  The map from June to September for the year 2015 shown below depicts the vegetation health index  The vegetation pattern are been classifies as follows  Green colour- Healthy Crops  Yellow indicates-Moderate Moisture stress on the crops  Brown indicates-Sever Moisture stress on the crops
  • 32. Graph’s Showing Variation of NDVI Chart and Percentage Departure JUNE JULY AUGUST SEPTEMBER OCTOBER 2011 0.3 0.3 0.2 0.4 0.5 2012 0.2 0.2 0.3 0.3 0.4 2013 0.2 0.1 0.3 0.4 0.5 2014 0.2 0.2 0.2 0.3 0.4 2015 0.3 0.2 0.3 0.4 0.5 0.3 0.3 0.2 0.4 0.5 0.2 0.2 0.3 0.3 0.4 0.2 0.1 0.3 0.4 0.5 0.2 0.2 0.2 0.3 0.4 0.3 0.2 0.3 0.4 0.5 0.0 0.1 0.2 0.3 0.4 0.5 0.6 VARIATION OF NDVI CHART IN KOLAR TALUK 2011 2012 2013 2014 2015 JUNE JULY AUGUST SEPTEMBER OCTOBER 2011 7.5 24.4 -35.1 3.1 1.8 2012 -3.6 20.0 14.4 -3.9 -15.5 2013 -28.4 -50.5 29.7 18.5 8.6 2014 -4.3 -10.7 -19.5 -24.5 -7.6 2015 28.8 16.7 10.5 6.8 12.8 7.5 24.4 -35.1 3.1 1.8-3.6 20.0 14.4 -3.9 -15.5 -28.4 -50.5 29.7 18.5 8.6 -4.3 -10.7 -19.5 -24.5 -7.6 28.8 16.7 10.5 6.8 12.8 -60.0 -50.0 -40.0 -30.0 -20.0 -10.0 0.0 10.0 20.0 30.0 40.0 PERCENTAGE DEPARTURE FROM AVERAGE NDVI (2011- 2015) IN KOLAR TALUK 2011 2012 2013 2014 2015
  • 33. Conclusion’s According to KSNDMC any 2 indices out of 4 indices satisfies Drought means they will declare as drought affected regions. So we found 6 hobli’s out of 27 hoblis in a Kolar district are affected by drought during South West Monsoon 2015.
  • 34. Conclusion Table Hobli % DEP D SPI SPI CONDITION MAI SW MAI CONDITION AAI SW AAI CONDITION SW DROUGHT BANGARAPET -9.0 ND -0.6 NEAR NORMAL 59.5 AGRI FAVORABLE 40.5 MODERATE DEP NO DROUGHT BETMANGALA 2.9 ND 0.2 NEAR NORMAL 60.4 AGRI FAVORABLE 39.6 MODERATE DEP NO DROUGHT BUDIKOTE -12.1 ND -0.7 NEAR NORMAL 51.1 AGRI FAVORABLE 48.9 MODERATE DEP NO DROUGHT KAMSANDRA 6.9 ND 0.4 NEAR NORMAL 58.5 AGRI FAVORABLE 41.5 MODERATE DEP NO DROUGHT KYASAMBALLI 11.7 ND 0.7 NEAR NORMAL 75.0 HUMID 25.0 MILD DEP NO DROUGHT ROBERTSONPET -6.4 ND -0.4 NEAR NORMAL 57.2 AGRI FAVORABLE 42.8 MODERATE DEP NO DROUGHT KOLAR -40.4 MD -2.6 EXTREMELY DRY 41.0 MODERATE 59.0 SEVERE DEP DROUGHT HOLURU -32.6 MD -2.1 EXTREMELY DRY 44.7 MODERATE 55.3 SEVERE DEP DROUGHT HUTTUR -18.6 ND -1.2 MODERATELY DRY 55.3 AGRI FAVORABLE 44.7 MODERATE DEP NO DROUGHT NARASAPURA 20.7 ND 1.3 MODERATELY WET 77.3 HUMID 22.7 MILD DEP NO DROUGHT SUGATURU -23.8 ND -1.5 SEVERELY DRY 50.1 AGRI FAVORABLE 49.9 MODERATE DEP NO DROUGHT VAKKALERI -28.1 MD -1.8 SEVERELY DRY 60.7 AGRI FAVORABLE 39.3 MODERATE DEP DROUGHT VEMAGAL -11.1 ND -0.7 NEAR NORMAL 57.2 AGRI FAVORABLE 42.8 MODERATE DEP NO DROUGHT MALUR -2.6 ND -0.2 NEAR NORMAL 57.9 AGRI FAVORABLE 42.1 MODERATE DEP NO DROUGHT LAKKUR -5.6 ND -0.3 NEAR NORMAL 53.9 AGRI FAVORABLE 46.1 MODERATE DEP NO DROUGHT MASATHI 7.7 ND 0.4 NEAR NORMAL 57.0 AGRI FAVORABLE 43.0 MODERATE DEP NO DROUGHT TYAKAL -13.7 ND -0.8 NEAR NORMAL 52.1 AGRI FAVORABLE 47.9 MODERATE DEP NO DROUGHT MULABAGAL -18.2 ND -1.2 MODERATELY DRY 64.4 AGRI FAVORABLE 35.6 MODERATE DEP NO DROUGHT AVANI 8.5 ND 0.6 NEAR NORMAL 65.8 AGRI FAVORABLE 34.2 MODERATE DEP NO DROUGHT BAIRAKUR -29.2 MD -1.9 SEVERELY DRY 48.2 MODERATE 51.8 SEVERE DEP DROUGHT DUGGASANDRA -27.0 MD -1.8 SEVERELY DRY 44.6 MODERATE 55.4 SEVERE DEP DROUGHT TAYILUR -2.7 ND -0.2 NEAR NORMAL 61.9 AGRI FAVORABLE 38.1 MODERATE DEP NO DROUGHT SRINIVASPUR -1.3 ND -0.1 NEAR NORMAL 61.5 AGRI FAVORABLE 38.5 MODERATE DEP NO DROUGHT NELAVANKI 14.9 ND 0.9 NEAR NORMAL 72.3 AGRI FAVORABLE 27.7 MILD DEP NO DROUGHT RONURU -3.6 ND -0.2 NEAR NORMAL 62.3 AGRI FAVORABLE 37.7 MODERATE DEP NO DROUGHT RAYALPADU -18.3 ND -1.1 MODERATELY DRY 55.0 AGRI FAVORABLE 45.0 MODERATE DEP NO DROUGHT YELLDUR -38.9 MD -2.4 EXTREMELY DRY 42.0 MODERATE 58.0 SEVERE DEP DROUGHT