Download as PDF, PPTX

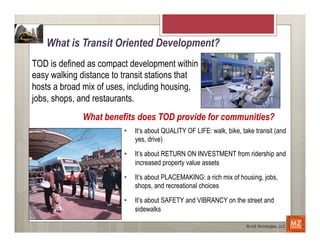
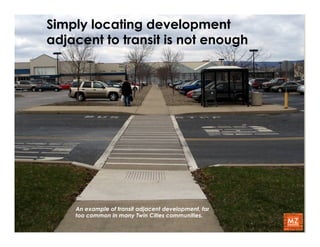
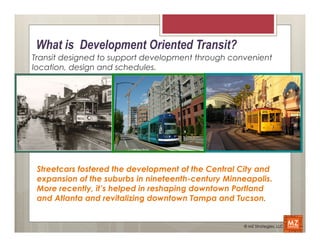


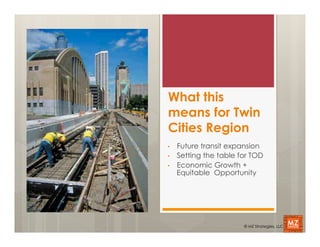

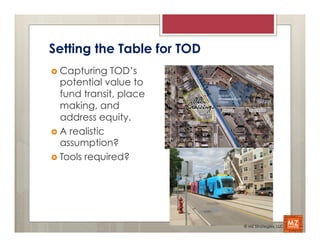
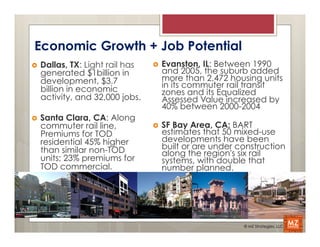

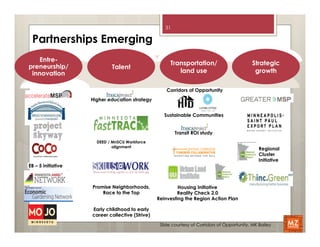
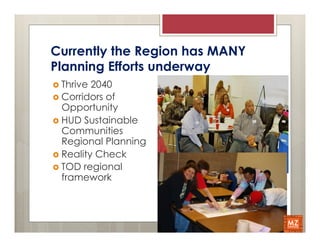


This document discusses transit oriented development (TOD) and the opportunities it provides for communities. TOD is compact, mixed-use development located within walking distance of transit stations. It improves quality of life by promoting walkability and access to transit. TOD also increases property values and fosters vibrant, mixed-use neighborhoods. Simply locating development near transit is not enough - true TOD requires transit systems designed to support development through convenient access. The document outlines challenges to aligning transit expansion and development but argues that capitalizing on TOD can drive economic growth and equitable opportunities for communities.


