Download to read offline
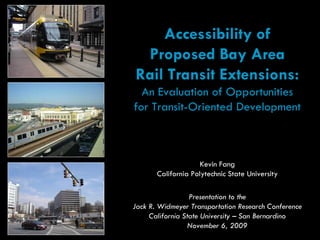


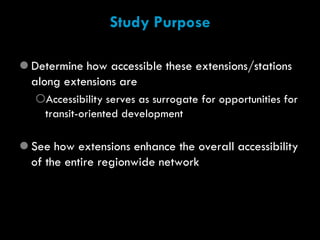


This document evaluates the accessibility and opportunities for transit-oriented development of proposed rail transit extensions in the Bay Area. It finds that the extensions would increase regional accessibility, especially for central cities and inner suburbs. The highest ranked extension is BART to Silicon Valley, while Caltrain to downtown SF adds value as a major activity center. Accessibility is one factor for transit-oriented development potential, and surrounding land use and proximity to jobs also impact opportunities.