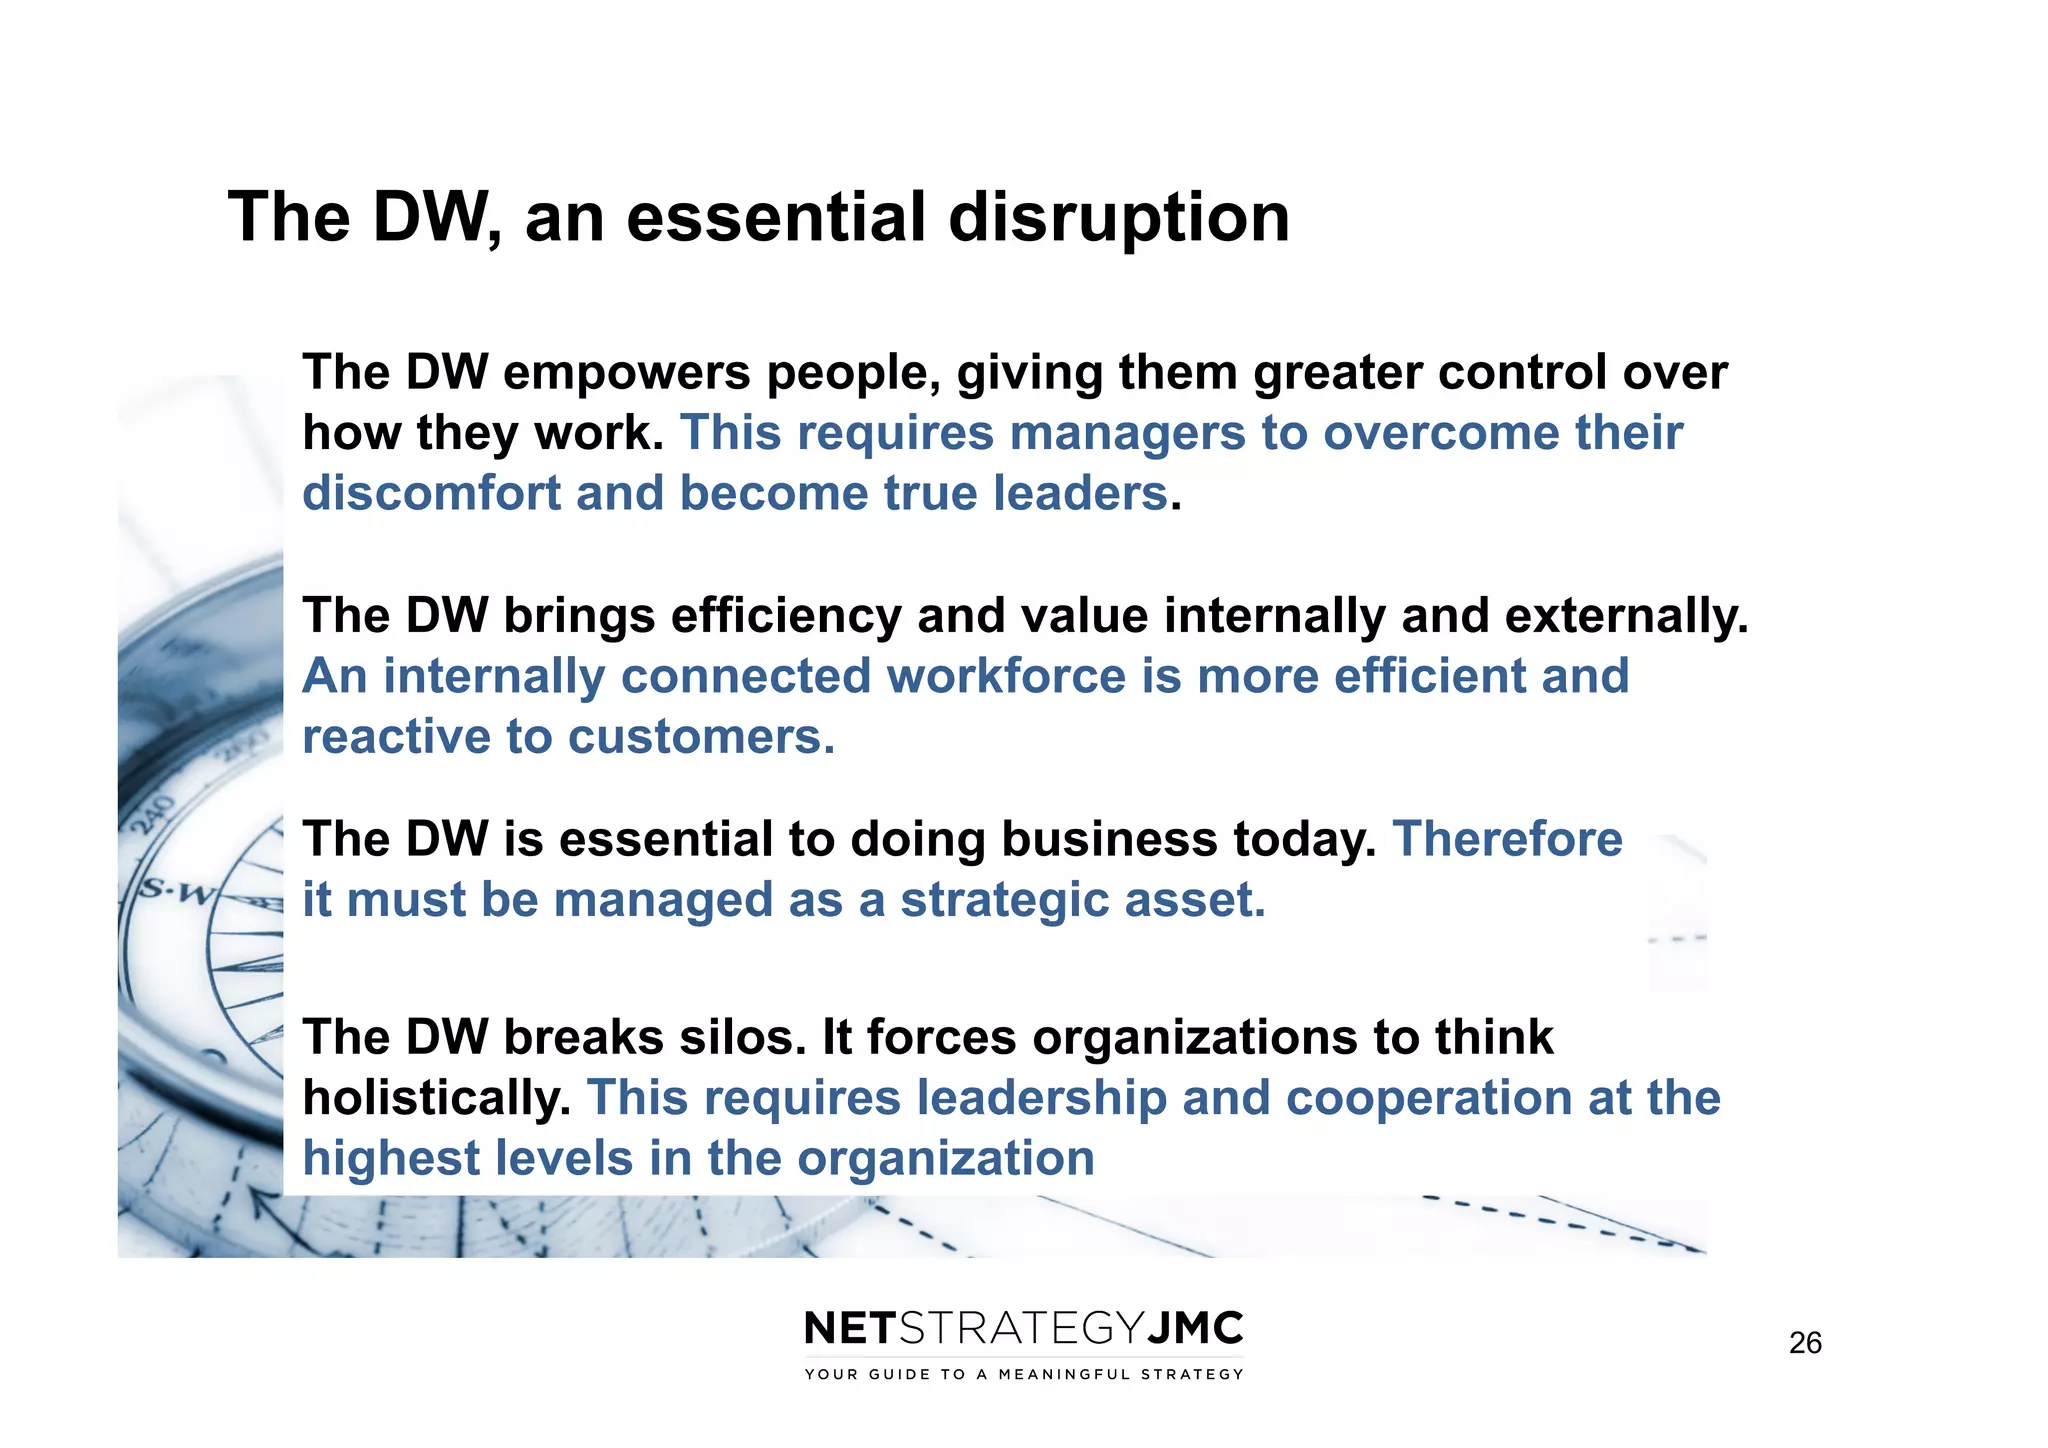
Digital Workplace – Trends & transformation
Jane McConnell

Rencontre internationale des responsables intranet et RSE
Novembre 2013

The 8th annual worldwide survey
Over 300 participating organizations
“The purpose of the Digital Workplace
Trends reports is to provide executives
and practitioners with data, analysis
and firsthand stories to help them see
where they are today and what early
adopters are doing.” Jane McConnell

www.digital-workplace-trends.com
1
Digital Workplace Trends 2014
Published Jan 31st 2014

2014

This presentation is
the second public
presentation of the
data from the DW
survey that closed at
the end of October.

2
Digital Workplace Advisory Board for 2014
• 

Bjoern Negelmann, European Enterprise 2.0 (Germany)

• 

Brian Holness International Power – GDF SUEZ (UK)

• 

Céline Schillinger, SANOFI PASTEUR (France)

• 

Cornelis van der Brugge, NOKIA (Finland)

• 

Ernst Décsey, UNICEF (Switzerland)

• 

Franklin Bradley, Architect of the Capitol (US)

• 

Gloria Burke, UNISYS (US)

• 

Jon Husband, Wirearchy (Canada)

• 

Linda Tinnert, IKEA (Sweden)

• 

Martin Risgaard, Grundfos (Denmark)

• 

Rawn Shah, Forbes.com (US)

• 

Sam Marshall, ClearBox Consulting Ltd. (UK)

• 

Stéphane Aknin, AXA, (France)

• 

Susan Scrupski, Change Agents Worldwide LLC. (US)

• 

Thomas Maeder, Swisscom AG (Switzerland)

3
315 organizations
10% headquartered in France

Com: internal and external – 26%
Com: internal only – 17%
IT – 27%
Knowledge – 8%
Marketing – 5%
HR – 3%
•  One entry per organization
•  Team work in 20% of the
participating organizations
•  Digital Workplace
Scorecard – Selfassessment, in the context
of similar organizations

4
Interrogations….
•  Mobilité: que font les early adopters ?
•  Social : quel apport pour le business ?
•  Les top 50 en « people capabilities » : quel impact sur
l’organisation ?
•  Changement : quels modes de leadership ?
•  Quels leviers pour réussir ?

5
Top 50: Enabling people: scoring criteria
• 

Reacting to news, information and content.
– 

• 

Sharing information and knowledge with others.
– 

• 

Examples: enabling people across the organization (from the “crowd”) to propose ideas in response to an issue, a challenge, a need, etc., an to
interact with other people’s ideas by using crowdsourcing, ideation, enterprise jams or other tools.

Communicating in real time.
– 

• 

Examples: enabling people and teams to co-created documents and to jointly build and maintain web content in wikis, team spaces, or in a
“corporate-pedia”.

Crowdsourcing and developing ideas.
– 

• 

Examples: enabling people to find other people based on a wide variety of attributes including name, experience, expertise, responsibilities and
interests through employee directories or other tools and spaces where people themselves can provide much of the information about
themselves.

Co-creating content.
– 

• 

Examples: enabling individual people to share their experiences, express opinions, etc. by using blogs, wikis or other tools.

Finding people and expertise.
– 

• 

Examples: enabling people throughout the organization to make comments or indicate “like” on official news, published information and content.

Examples: enabling people to see when colleagues are available, have short spontaneous conversations and meetings online by using tools like
web conferencing, presence indicators, instant messaging, etc.

User-generated videos.
– 

Do you have an employee channel where people can make and share videos freely a la YouTube? If so, how easy is it for people to make and
upload videos to share with others?

6
MOBILE

7
Approximately 35% for top 50
“enabling people” organizations

Mobile is slow

Approximately the same degree of interest and investment as one year ago

*

High priority and significant investment
already made

Considered important, some investment
made
DWT 2014
DWT 2013
DWT 2012

Moderate level of interest but no
investment yet

Little or no interest at present

0

10

20

30

40

50

60

%

8
Mobile use cases investigated
• 

Sales people

• 

Service people

• 

Emergency response people

• 

Operational people

• 

Employee self-service

• 

Employee education

• 

Managers on the road or off site

• 

Management reporting

• 

Percentages based on 276
organizations (out of 315)

5 to 10% are piloting or plan
to launch by end 2013.
10 to 20%
planned for 2014

Project managers

• 

Max 30%
End 2014

Floor and field workers in general

• 

No actual implementation
yet.

10% or fewer have
implemented.

Max 40%
End 2014

5 to 10% are piloting or
plan to launch by end 2013.
10 to 20%
planned for 2014.

Management strategic news

9
Mobile use cases investigated

Top 50
Emphasis on “floor-field” and “project management”
• 

Sales people

• 

Service people

• 

Emergency response people

• 

Operational people

• 

Floor and field workers in general

• 

Project managers

• 

Employee self-service

• 

Employee education

• 

Managers on the road or off site

• 

Management reporting

30% implemented or
pilot or launch at end
of in 2013

• 

Management strategic news

15% planned 2014

Percentages based on Top 50 organizations in
“people capabilities” (out of 315)

40-45% implemented
or pilot or launch at
end of 2013

Max 55%
End 2014

10% planned 2014

Max 45%
End 2014

10
BYOD: policy

Yes, and policy in place

29%

Defining our policy

21%

Unofficially accepted

27%

Not allowed

Have not thought about it

n = 284

Percentages based on 284
organizations (out of 315)

15%

3%

Q85

11
SOCIAL

12
“I should be able to…
Describe myself, share information
about myself with others in the
organization,

Share my information and my ideas
openly,

55% end 2013
20% in 2008

65% end 2013
35% in 2008

React to ideas of other people
openly,

49% end 2013

Participate openly in developing new
ideas and innovations.”

30% end 2013

40% in 2010

25 - 30% in 2010
% based on number of organizations that have
deployed these capabilities. They do not necessarily
reflect the level of adoption.
13
Far from a social way of working
“To what extent is your ESN integrated into peoples’ daily work?”

Enterprise social network: integration into daily work
Achieved in most cases

2%

10%

Well under way

8%

Making progress

35%

Just started

33%

Planning to do this

13%

No plans at present

Don’t know

n = 132

5%

5%

Percentages based on the 132
organizations (out of 315) that have ESN
in production use “enterprise wide” or “in
some parts”.
Q59

14
TOP 50 – GREATER IMPACT
Out of a total of 315 organizations

15
Half of the Top 50 report high degree of
confidence in business critical areas.

How easy is it ….?
Retain knowledge when
the baby boomers leave

Very

Top 50

Relatively

Full group
Retaining knowledge
Develop skills and
knowledge naturally
on the job

Top 50
People development
Full group

Top 50
Business flexibility and
adaptability in periods
of major changes
Full group
Business flexibility
Top 50
Smooth, efficient
experience for customerfacing workforce
Customer-facing
Full group
0

10

20

30

40

50

60

70

80

%

16
CHANGEMENT & LEVIERS

17
Top 50 organizational mindset: collaborative, open, empowering
Team-oriented
80	
   %
Info sys mostly closed

Full group

Freedom to experiment
60	
  

Top 50

40	
  

Punish mistakes

20	
  

Initiatives, entrepreneur

0	
  

Follow instructions

Learn from mistakes

Rules mandatory

Info sys mostly open
Individually competitive

Top 50 organizations in terms of people capabilities offered
in the digital workplace: self-expression, sharing information
and knowledge with others, reacting to news and content,
co-creation, real-time communication, finding people and
expertise, Scale 1 to 5. From low to high. Data points =
percentage or organizations that responded 4 or 5.

Question inspired by ‘Culture Assessment’ tool
presented by Sandy Carter, VP Social Business
Sales & Evangelism, IBM, at Enterprise 2.0
Summit in Paris March 2013.

18
Communities – new organizational
design that complements hierarchies

19
Enterprise-wide is the significant difference
Communities

+ 43 % points

Top 50

Full network
Enterprise social group

Team spaces

Top 50
Enterprise-wide
In some parts

Full group
Team (structured) places

Enterprise
social network

+ 38 % points

Top 50
Communities
Full group
0

10

20

30

40

50

60

70

80

90

100

%

20
Top management – voice and behavior
send strong signals

21
Top management support much stronger
0

10

20

30

40

50

60

70

80

90

%

Top 50
Vocally supportive

Vocally supportive

Strongly agree

Full group

Agree

Act as role models

Act as role model

Top 50

Full group
Driving force

Driving force

Top 50

Full group

Neutral or
indifferent

Neutral or indifferent
Top 50

Full group

22
Change drivers are changing…
•  Internal communication messages and campaigns
•  Line and operational managers

23
Key change drivers
Internal communication messages and campaigns

65%

Behavior of colleagues and peers

62%

A compelling story, sense of “why

52%

Success stories from the organization

49%

Role-modeling: senior leaders

46%

Role-modeling: line and operational managers
Communities of practice

Up 17%
points since
last year

42%
41%

Integ. social collabor. features into business processes

36%

Formal classroom training: awareness, digital skills
Ad hoc, informal gatherings
Inclusion in job objectives, performance reviews

27%
20%
18%

Recognition e.g. rewards, badges

16%

Formal organizational events

15%

n = 286 - multiple answers possible

Up 14 %
points since
last year

Q118
MY CONCLUSION
What do you think?

25
The DW, an essential disruption
The DW empowers people, giving them greater control over
how they work. This requires managers to overcome their
discomfort and become true leaders.
The DW brings efficiency and value internally and externally.
An internally connected workforce is more efficient and
reactive to customers.
The DW is essential to doing business today. Therefore
it must be managed as a strategic asset.
The DW breaks silos. It forces organizations to think
holistically. This requires leadership and cooperation at the
highest levels in the organization

26
Merci !

Jane McConnell
jane@netjmc.com

DW Trends 2014
To be published Jan 31st 2014
www.digital-workplace-trends.com

www.netjmc.com/blog
twitter @netjmc

2014
Email me for a free copy
of DW Highlights 2014.
Available Feb. 2014.

Groupe de travail sur Paris pour responsables
intranet et digital workplace
www.IntraNetwork.fr
Me contacter si vous êtes intéressé(e).
Purchase “DW Trends 2013” at a discount
If you wish to purchase the 2013 report,
use this code for a 40% reduction:
13DWT40JMC
Pricing info and link below:
www.digital-workplace-trends.com.
(The new report – “DW Trends 2014”
will be published at the end of January
2014.)

jane@netjmc.com
twitter @netjmc

28

Digital Workplace Trends 2014 - Paris presentation

  • 1.
    Digital Workplace –Trends & transformation Jane McConnell Rencontre internationale des responsables intranet et RSE Novembre 2013 The 8th annual worldwide survey Over 300 participating organizations “The purpose of the Digital Workplace Trends reports is to provide executives and practitioners with data, analysis and firsthand stories to help them see where they are today and what early adopters are doing.” Jane McConnell www.digital-workplace-trends.com 1
  • 2.
    Digital Workplace Trends2014 Published Jan 31st 2014 2014 This presentation is the second public presentation of the data from the DW survey that closed at the end of October. 2
  • 3.
    Digital Workplace AdvisoryBoard for 2014 •  Bjoern Negelmann, European Enterprise 2.0 (Germany) •  Brian Holness International Power – GDF SUEZ (UK) •  Céline Schillinger, SANOFI PASTEUR (France) •  Cornelis van der Brugge, NOKIA (Finland) •  Ernst Décsey, UNICEF (Switzerland) •  Franklin Bradley, Architect of the Capitol (US) •  Gloria Burke, UNISYS (US) •  Jon Husband, Wirearchy (Canada) •  Linda Tinnert, IKEA (Sweden) •  Martin Risgaard, Grundfos (Denmark) •  Rawn Shah, Forbes.com (US) •  Sam Marshall, ClearBox Consulting Ltd. (UK) •  Stéphane Aknin, AXA, (France) •  Susan Scrupski, Change Agents Worldwide LLC. (US) •  Thomas Maeder, Swisscom AG (Switzerland) 3
  • 4.
    315 organizations 10% headquarteredin France Com: internal and external – 26% Com: internal only – 17% IT – 27% Knowledge – 8% Marketing – 5% HR – 3% •  One entry per organization •  Team work in 20% of the participating organizations •  Digital Workplace Scorecard – Selfassessment, in the context of similar organizations 4
  • 5.
    Interrogations…. •  Mobilité: quefont les early adopters ? •  Social : quel apport pour le business ? •  Les top 50 en « people capabilities » : quel impact sur l’organisation ? •  Changement : quels modes de leadership ? •  Quels leviers pour réussir ? 5
  • 6.
    Top 50: Enablingpeople: scoring criteria •  Reacting to news, information and content. –  •  Sharing information and knowledge with others. –  •  Examples: enabling people across the organization (from the “crowd”) to propose ideas in response to an issue, a challenge, a need, etc., an to interact with other people’s ideas by using crowdsourcing, ideation, enterprise jams or other tools. Communicating in real time. –  •  Examples: enabling people and teams to co-created documents and to jointly build and maintain web content in wikis, team spaces, or in a “corporate-pedia”. Crowdsourcing and developing ideas. –  •  Examples: enabling people to find other people based on a wide variety of attributes including name, experience, expertise, responsibilities and interests through employee directories or other tools and spaces where people themselves can provide much of the information about themselves. Co-creating content. –  •  Examples: enabling individual people to share their experiences, express opinions, etc. by using blogs, wikis or other tools. Finding people and expertise. –  •  Examples: enabling people throughout the organization to make comments or indicate “like” on official news, published information and content. Examples: enabling people to see when colleagues are available, have short spontaneous conversations and meetings online by using tools like web conferencing, presence indicators, instant messaging, etc. User-generated videos. –  Do you have an employee channel where people can make and share videos freely a la YouTube? If so, how easy is it for people to make and upload videos to share with others? 6
  • 7.
  • 8.
    Approximately 35% fortop 50 “enabling people” organizations Mobile is slow Approximately the same degree of interest and investment as one year ago * High priority and significant investment already made Considered important, some investment made DWT 2014 DWT 2013 DWT 2012 Moderate level of interest but no investment yet Little or no interest at present 0 10 20 30 40 50 60 % 8
  • 9.
    Mobile use casesinvestigated •  Sales people •  Service people •  Emergency response people •  Operational people •  Employee self-service •  Employee education •  Managers on the road or off site •  Management reporting •  Percentages based on 276 organizations (out of 315) 5 to 10% are piloting or plan to launch by end 2013. 10 to 20% planned for 2014 Project managers •  Max 30% End 2014 Floor and field workers in general •  No actual implementation yet. 10% or fewer have implemented. Max 40% End 2014 5 to 10% are piloting or plan to launch by end 2013. 10 to 20% planned for 2014. Management strategic news 9
  • 10.
    Mobile use casesinvestigated Top 50 Emphasis on “floor-field” and “project management” •  Sales people •  Service people •  Emergency response people •  Operational people •  Floor and field workers in general •  Project managers •  Employee self-service •  Employee education •  Managers on the road or off site •  Management reporting 30% implemented or pilot or launch at end of in 2013 •  Management strategic news 15% planned 2014 Percentages based on Top 50 organizations in “people capabilities” (out of 315) 40-45% implemented or pilot or launch at end of 2013 Max 55% End 2014 10% planned 2014 Max 45% End 2014 10
  • 11.
    BYOD: policy Yes, andpolicy in place 29% Defining our policy 21% Unofficially accepted 27% Not allowed Have not thought about it n = 284 Percentages based on 284 organizations (out of 315) 15% 3% Q85 11
  • 12.
  • 13.
    “I should beable to… Describe myself, share information about myself with others in the organization, Share my information and my ideas openly, 55% end 2013 20% in 2008 65% end 2013 35% in 2008 React to ideas of other people openly, 49% end 2013 Participate openly in developing new ideas and innovations.” 30% end 2013 40% in 2010 25 - 30% in 2010 % based on number of organizations that have deployed these capabilities. They do not necessarily reflect the level of adoption. 13
  • 14.
    Far from asocial way of working “To what extent is your ESN integrated into peoples’ daily work?” Enterprise social network: integration into daily work Achieved in most cases 2% 10% Well under way 8% Making progress 35% Just started 33% Planning to do this 13% No plans at present Don’t know n = 132 5% 5% Percentages based on the 132 organizations (out of 315) that have ESN in production use “enterprise wide” or “in some parts”. Q59 14
  • 15.
    TOP 50 –GREATER IMPACT Out of a total of 315 organizations 15
  • 16.
    Half of theTop 50 report high degree of confidence in business critical areas. How easy is it ….? Retain knowledge when the baby boomers leave Very Top 50 Relatively Full group Retaining knowledge Develop skills and knowledge naturally on the job Top 50 People development Full group Top 50 Business flexibility and adaptability in periods of major changes Full group Business flexibility Top 50 Smooth, efficient experience for customerfacing workforce Customer-facing Full group 0 10 20 30 40 50 60 70 80 % 16
  • 17.
  • 18.
    Top 50 organizationalmindset: collaborative, open, empowering Team-oriented 80   % Info sys mostly closed Full group Freedom to experiment 60   Top 50 40   Punish mistakes 20   Initiatives, entrepreneur 0   Follow instructions Learn from mistakes Rules mandatory Info sys mostly open Individually competitive Top 50 organizations in terms of people capabilities offered in the digital workplace: self-expression, sharing information and knowledge with others, reacting to news and content, co-creation, real-time communication, finding people and expertise, Scale 1 to 5. From low to high. Data points = percentage or organizations that responded 4 or 5. Question inspired by ‘Culture Assessment’ tool presented by Sandy Carter, VP Social Business Sales & Evangelism, IBM, at Enterprise 2.0 Summit in Paris March 2013. 18
  • 19.
    Communities – neworganizational design that complements hierarchies 19
  • 20.
    Enterprise-wide is thesignificant difference Communities + 43 % points Top 50 Full network Enterprise social group Team spaces Top 50 Enterprise-wide In some parts Full group Team (structured) places Enterprise social network + 38 % points Top 50 Communities Full group 0 10 20 30 40 50 60 70 80 90 100 % 20
  • 21.
    Top management –voice and behavior send strong signals 21
  • 22.
    Top management supportmuch stronger 0 10 20 30 40 50 60 70 80 90 % Top 50 Vocally supportive Vocally supportive Strongly agree Full group Agree Act as role models Act as role model Top 50 Full group Driving force Driving force Top 50 Full group Neutral or indifferent Neutral or indifferent Top 50 Full group 22
  • 23.
    Change drivers arechanging… •  Internal communication messages and campaigns •  Line and operational managers 23
  • 24.
    Key change drivers Internalcommunication messages and campaigns 65% Behavior of colleagues and peers 62% A compelling story, sense of “why 52% Success stories from the organization 49% Role-modeling: senior leaders 46% Role-modeling: line and operational managers Communities of practice Up 17% points since last year 42% 41% Integ. social collabor. features into business processes 36% Formal classroom training: awareness, digital skills Ad hoc, informal gatherings Inclusion in job objectives, performance reviews 27% 20% 18% Recognition e.g. rewards, badges 16% Formal organizational events 15% n = 286 - multiple answers possible Up 14 % points since last year Q118
  • 25.
    MY CONCLUSION What doyou think? 25
  • 26.
    The DW, anessential disruption The DW empowers people, giving them greater control over how they work. This requires managers to overcome their discomfort and become true leaders. The DW brings efficiency and value internally and externally. An internally connected workforce is more efficient and reactive to customers. The DW is essential to doing business today. Therefore it must be managed as a strategic asset. The DW breaks silos. It forces organizations to think holistically. This requires leadership and cooperation at the highest levels in the organization 26
  • 27.
    Merci ! Jane McConnell jane@netjmc.com DWTrends 2014 To be published Jan 31st 2014 www.digital-workplace-trends.com www.netjmc.com/blog twitter @netjmc 2014 Email me for a free copy of DW Highlights 2014. Available Feb. 2014. Groupe de travail sur Paris pour responsables intranet et digital workplace www.IntraNetwork.fr Me contacter si vous êtes intéressé(e).
  • 28.
    Purchase “DW Trends2013” at a discount If you wish to purchase the 2013 report, use this code for a 40% reduction: 13DWT40JMC Pricing info and link below: www.digital-workplace-trends.com. (The new report – “DW Trends 2014” will be published at the end of January 2014.) jane@netjmc.com twitter @netjmc 28