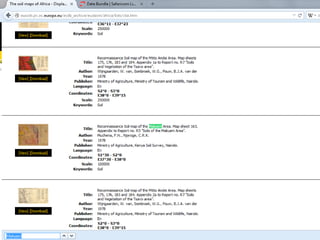
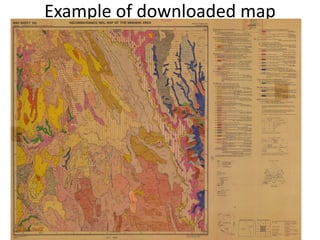
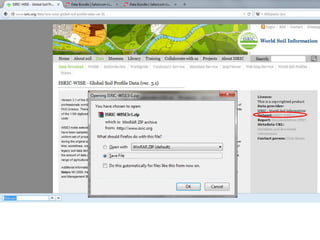
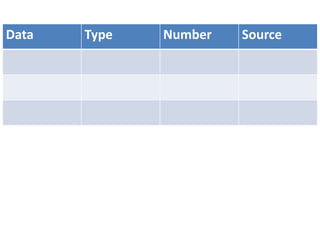
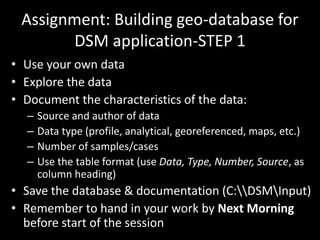
DSM TOOLS AND METHODS
Day1: Lecture 3
Database development
• The core of DSM
• Features
– It should be user friendly
– It should contain adequate information
– Amenable to DSM software
• Software
– MS Office
– QGIS
– ILWIS
Obtaining DSM data
• Clarify what is to be done (Map properties/classes)
• Specify type of data needed
• Identify sources and summarize data availability
• Document available data and check for gaps
• Obtain the data
Data Type Source
Soil Soil profiles ISRIC (http://www.isric.org/data/isric-wise-global-soil-profile-data-ver-31)
Soil maps UN-FAO (http://www.fao.org/soils-portal/soil-survey/soil-maps-and-
databases/soil-profile-databases/en/)
IIASA
(http://www.iiasa.ac.at/web/home/research/modelsData/HWSD/HWSD.en.html)
Soil legacy reports FAO (http://www.fao.org/soils-portal/soil-survey/soil-maps-and-databases/soil-
legacy-reports/en/)
Laboratory analytical
data
National soil laboratories, research institutes (e.g. NGOs, Universities, etc)
Remote
sensing image
MODIS NDVI (250 m) USDA (http://pekko.geog.umd.edu/usda/apps/)
Land cover (300 m) ESA (http://due.esrin.esa.int/globcover/)
Landsat (30 m) GLCF (http://glcf.umd.edu/data/)
Cover (< 30 m) National aerial photo missions
DEM SRTM (90 m) http://srtm.usgs.gov/
ASTER (30 m) http://asterweb.jpl.nasa.gov/gdem.asp
DEM (<30 m) National contour maps
Geology 1:1 M National geologic maps
> 1:1 M Sub-regional (sub-national) geologic maps
Climate Rainfall National meteorological departments
Create DSM workspace
 C:DSM - where we will work
 C:DSMInput - where to keep input data
 C:DSMOutput - where to keep output data
Example data acquisition
• Interest: to map clay content
• Identified study area – in Makueni (Kenya)
• Data sources
– ISRIC – soil profiles
– EUSOILS – Soil map
– Government soil department – soil profiles
– Academic institution – soil profile
• Document the data availability and gaps
Soil data
Download online data
• Soil map at
http://eusoils.jrc.ec.europa.eu/esdb_archive/
eudasm/africa/index.html
• Soil profile at
http://www.isric.org/data/isric-wise-global-soil-
profile-data-ver-31
• Other soil data
– Gvt
– Academic institution
Obtaining data from EUSOIL
Example
Example of downloaded map
Obtaining data from ISRIC
Example
Other examples: online data acquisition
• Land cover
http://due.esrin.esa.int/globcover/
• DEM
http://srtm.usgs.gov/
• Other (Gvt departments)
– Rainfall
– Geology
– Landform
Environmental covariate data
Example: 300 m Land cover (2009)
Example: 30 m DEM
Example: Downloading MODIS
Which soil data is available
Which environmental covariate is available
Detailed soil map with
Legends and soil data
Soil point data with site
description
Detailed soil map
with legend
No data
All covariates
C, O, R, P
At least 3 covariates
Including R & O
At least 2 covariates
Including R
Only one covariate No data
Increasing level of data inadequacy
Climate (C)
Organism (O)
Relief (R)
Parent (P)
Relief (R)
Organism (O)
Relief (R)
Climate – mean rainfall (map or weather station data)
Organism – Land use/land cover
Relief – Elevation map (DEM)
Parent – Geology map
Soil – georeferenced soil properties, profile, map
Data Type Number Source
Assignment: Building geo-database for
DSM application-STEP 1
• Use your own data
• Explore the data
• Document the characteristics of the data:
– Source and author of data
– Data type (profile, analytical, georeferenced, maps, etc.)
– Number of samples/cases
– Use the table format (use Data, Type, Number, Source, as
column heading)
• Save the database & documentation (C:DSMInput)
• Remember to hand in your work by Next Morning
before start of the session

Digital Soil Mapping Tools and Methods 1

  • 1.
    DSM TOOLS ANDMETHODS Day1: Lecture 3
  • 2.
    Database development • Thecore of DSM • Features – It should be user friendly – It should contain adequate information – Amenable to DSM software • Software – MS Office – QGIS – ILWIS
  • 3.
    Obtaining DSM data •Clarify what is to be done (Map properties/classes) • Specify type of data needed • Identify sources and summarize data availability • Document available data and check for gaps • Obtain the data Data Type Source Soil Soil profiles ISRIC (http://www.isric.org/data/isric-wise-global-soil-profile-data-ver-31) Soil maps UN-FAO (http://www.fao.org/soils-portal/soil-survey/soil-maps-and- databases/soil-profile-databases/en/) IIASA (http://www.iiasa.ac.at/web/home/research/modelsData/HWSD/HWSD.en.html) Soil legacy reports FAO (http://www.fao.org/soils-portal/soil-survey/soil-maps-and-databases/soil- legacy-reports/en/) Laboratory analytical data National soil laboratories, research institutes (e.g. NGOs, Universities, etc) Remote sensing image MODIS NDVI (250 m) USDA (http://pekko.geog.umd.edu/usda/apps/) Land cover (300 m) ESA (http://due.esrin.esa.int/globcover/) Landsat (30 m) GLCF (http://glcf.umd.edu/data/) Cover (< 30 m) National aerial photo missions DEM SRTM (90 m) http://srtm.usgs.gov/ ASTER (30 m) http://asterweb.jpl.nasa.gov/gdem.asp DEM (<30 m) National contour maps Geology 1:1 M National geologic maps > 1:1 M Sub-regional (sub-national) geologic maps Climate Rainfall National meteorological departments Create DSM workspace  C:DSM - where we will work  C:DSMInput - where to keep input data  C:DSMOutput - where to keep output data
  • 4.
    Example data acquisition •Interest: to map clay content • Identified study area – in Makueni (Kenya) • Data sources – ISRIC – soil profiles – EUSOILS – Soil map – Government soil department – soil profiles – Academic institution – soil profile • Document the data availability and gaps Soil data
  • 5.
    Download online data •Soil map at http://eusoils.jrc.ec.europa.eu/esdb_archive/ eudasm/africa/index.html • Soil profile at http://www.isric.org/data/isric-wise-global-soil- profile-data-ver-31 • Other soil data – Gvt – Academic institution
  • 6.
    Obtaining data fromEUSOIL Example
  • 7.
  • 8.
    Obtaining data fromISRIC Example
  • 9.
    Other examples: onlinedata acquisition • Land cover http://due.esrin.esa.int/globcover/ • DEM http://srtm.usgs.gov/ • Other (Gvt departments) – Rainfall – Geology – Landform Environmental covariate data
  • 10.
    Example: 300 mLand cover (2009)
  • 11.
  • 12.
  • 13.
    Which soil datais available Which environmental covariate is available Detailed soil map with Legends and soil data Soil point data with site description Detailed soil map with legend No data All covariates C, O, R, P At least 3 covariates Including R & O At least 2 covariates Including R Only one covariate No data Increasing level of data inadequacy Climate (C) Organism (O) Relief (R) Parent (P) Relief (R) Organism (O) Relief (R) Climate – mean rainfall (map or weather station data) Organism – Land use/land cover Relief – Elevation map (DEM) Parent – Geology map Soil – georeferenced soil properties, profile, map
  • 14.
  • 15.
    Assignment: Building geo-databasefor DSM application-STEP 1 • Use your own data • Explore the data • Document the characteristics of the data: – Source and author of data – Data type (profile, analytical, georeferenced, maps, etc.) – Number of samples/cases – Use the table format (use Data, Type, Number, Source, as column heading) • Save the database & documentation (C:DSMInput) • Remember to hand in your work by Next Morning before start of the session