Install Digital Soil Mapping Software
•
3 likes•1,060 views

http://www.fao.org/globalsoilpartnership This Presentation was made during the Digital Soil Mapping training that took place in Amman - Jordan from 29 November - 7 December 2015, and it presents how to install DSM softeware © FAO: http://www.fao.org
Report
Share
Report
Share
Download to read offline

Recommended
Digital Soil Mapping steps
http://www.fao.org/globalsoilpartnership
This Presentation was made during the Digital Soil Mapping training that took place in Amman - Jordan from 29 November - 7 December 2015, and it presents the Digital Soil Mapping steps
© FAO: http://www.fao.org
Review of Digital Soil Mapping steps
The document outlines the key steps for digital soil mapping (DSM) which includes 1) deciding on the mapping focus and study area, 2) identifying and collecting relevant soil and environmental data, and 3) organizing and preprocessing the data. It then discusses 4) choosing appropriate GIS, terrain modeling, and image processing tools to analyze the data and 5) systematically applying the tools while documenting the process. The final steps involve 6) assessing the accuracy of the soil maps produced and 7) reporting the results.
R programming language in spatial analysis
R is a free software environment for statistical computing and graphics. It can be used for spatial data analysis and GIS tasks. Spatial data such as points, polygons, and raster files can be imported and analyzed in R using specialized packages. Two case studies demonstrated using R for spatial interpolation of temperature data, LiDAR data processing to create digital elevation models, and developing online viewers for spatial datasets. R allows for reproducible analysis through scripting and has numerous packages that implement statistical procedures, graphics, and interfaces with GIS software like GRASS and ArcGIS.
R spatial presentation
This document discusses using R for spatial and geospatial analysis. It provides an overview of key R packages for working with spatial data like ggplot2, rgdal, and maptools. It also demonstrates how to create basic maps from shapefiles, perform spatial joins to add data attributes, and generate choropleth and heat maps for visualization and analysis. The document serves as a tutorial for getting started with spatial analysis and visualization using open-source R tools and libraries.
Exploring Spatial data in GIS Environment
This document provides an overview of a GIS training on exploring spatial data. It describes the key components of ArcGIS including ArcMap for viewing and editing data, ArcCatalog for data management, and ArcToolbox for geoprocessing tools. It also outlines the different data formats like shapefiles that can be used and exported in GIS. The training covers understanding the ArcGIS interface, working with raster and vector data, and demonstrations of ArcMap, ArcCatalog, and exporting data to shapefiles.
Introduction to GIS
This document provides an introduction to Geographic Information Systems (GIS). It defines GIS as a computer system for capturing, storing, manipulating, analyzing and presenting spatially-referenced data. The document discusses examples of GIS applications, the history of GIS from the 1970s to present, and its use in fields like urban planning, hydrological modeling and the water sector. It also compares open source GIS software like QGIS to proprietary software like ESRI ArcGIS, and reviews some key open source GIS tools including GDAL, Python and OSGeo4W.
Arc gis introduction-ppt
This document provides an overview of ArcGIS and its components. It discusses how data are stored in ArcGIS using different data models over time, including coverages, shapefiles, and geodatabases. It describes the main ArcGIS applications - ArcMap for viewing and editing data, ArcCatalog for data management, and ArcToolbox for geoprocessing tools. It also outlines some key ArcGIS extensions for spatial, geostatistical, and 3D analysis.
An Introduction to Mapping, GIS and Spatial Modelling in R (presentation)
A presentation given to the Institute of Geographical Sciences and Natural Resource Research, Chinese Academy of Sciences, November 2013
Using R to Visualize Spatial Data: R as GIS - Guy Lansley
This talk demonstrates some of the benefits of using R to visualize spatial data efficiently and clearly.
It was originally presented by Guy Lansley (UCL and the Consumer Data Research Centre) to the GIS for Social Data and Crisis Mapping Workshop at the University of Kent.
Spatial Data Science with R
Slide show for the webinar on "Spatial Data Science with R" organized for the GeoDevelopers.org community. The video of the webinar and all the related materials including source code and sample data can be downloaded from this link: http://amsantac.co/blog/en/2016/08/07/spatial-data-science-r.html
In this webinar I talked about Data Science in the context of its application to spatial data and explained how we can use the R language for the analysis of geographic information within the different stages of a data science workflow, from the import and processing of spatial data to visualization and publication of results.
Portfolio_Gis_others
This document discusses using GIS for landscape planning and management. It describes how to create geodatabases and import data. It also covers georeferencing data, analyzing Landsat imagery and DEM data. Village census data and groundwater resources are analyzed. Natural layers like soil, geology and land use are studied to determine characteristics, erosion risk, recharge potential and agricultural suitability. The document presents case studies on regional planning in Mt. Abu, environmental monitoring of rivers and groundwater, city planning in Ahmedabad, and ecological restoration of mangroves. Figures provide examples of maps and analyses produced through GIS.
Adding data into GIS
This document summarizes a GIS training session at IOE Pulchowk covering adding various data types to projects, including vector shapefiles, coordinate data from Excel, and image data from online sources like the Shuttle Radar Topography Mission. It discusses importing Excel data, defining the coordinate system, classifying data as points, lines or polygons, and the differences between shapefile and layer file formats. The training covered using shapefiles to store location and attribute data, while layer files primarily store symbology and properties without the raw data.
Józsa e.
This document describes a study that used ArcGIS and R software to automatically analyze catchments based on digital elevation models. The study area was the Vasas-Belvárd catchment in Hungary. Methods included using TauDEM tools in ArcGIS to extract watersheds and stream networks from a DEM and attribute tables. R was integrated to perform statistical analyses. Results included floodplain maps extracted after normalizing slope and curvature data to improve interpretation, and long profiles of elevation drop and sinuosity. The study demonstrated the interoperability of ArcGIS and R for automated catchment analysis and that normalizing land surface parameters was useful for floodplain extraction. Further research was suggested to automate mapping, fine-tune thresholds, and
Spatial is Not Special ?
Spatial analysis is not just about GIS software skills. While GIS techniques like projections, data models, analysis, and rendering are important aspects of spatial analysis, maps simplify complex spatial relationships and spatial data can be understood in various ways. True understanding of spatial concepts requires going beyond just GIS software to consider how maps convey information and how people interpret spatial information differently.
Lecture 1b introduction to arc gis
GIS is a system for storing, mapping, and analyzing spatial data. ArcGIS is a GIS software created by ESRI. It includes ArcCatalog for data management, ArcMap for visualization and analysis, and ArcToolbox for geoprocessing tools. ArcGIS uses both vector and raster data models to represent geographic features and imagery. It can store data in shapefiles, geodatabases, coverages, and other formats. ArcCatalog allows users to organize, search, and document their spatial data with metadata. ArcMap allows users to visualize, query, and analyze spatial data in layers.
Defination of gis and components of arc gis
GIS is a combination of software, hardware, geographical data, and tools for capturing, storing, retrieving, manipulating, analyzing, and presenting map-based information. The document outlines the history and components of ArcGIS software, the most popular GIS platform, including ArcMap for mapping and editing, ArcCatalog for database management, and ArcScene and ArcGlobe for 3D visualization and analysis.
The National Soil Information System of Sudan
The document summarizes the steps taken to establish the National Soil Information System of Sudan (SUSIS) from 2013 to 2016. It involved data collection from archives and field work, data entry and harmonization, recruiting consultants, purchasing equipment, setting up a geoportal, and training on open source software and data. Various maps were produced, including soil maps, property maps on texture, carbon, and threats. Field data was merged with existing data to create national soil maps and identify gaps for further data collection and analysis. The system aims to make soil data accessible online through a geoportal.
R Spatial Analysis using SP
This document summarizes the use of spatial data analysis in R using the sp package. It discusses how to create and manipulate spatial point, line, polygon and grid objects. It provides an example of analyzing Colorado tornado data and counting storms in hexagonal grids over the United States to demonstrate spatial analysis techniques in R.
Georeferencing
Geo-referencing aligns raster or CAD data to a reference dataset with a known coordinate system. This process identifies control points visible in both datasets and links them, applying a transformation to align the original dataset to the reference. Geo-referencing can correct minor shifts or more drastic displacements. It saves transformation information in an external file or rectifies the data into the reference system. Spatial adjustment similarly aligns vector data during an edit session using transformation, edge-matching, or rubber sheeting methods based on control point links.
Exploring spatial data in GIS Environment
This document outlines the agenda for day 5 of a GIS training at IOE Pulchowk, including understanding file types like shapefiles and their components, exploring data properties and tools in the Arc Toolbox, and three assignments - creating a proportional point symbol map of gas stations, making a custom toolbar, and finding differences between two point layers.
e-SOTER Regional pilot platform as EU contribution to a Global Soil observing...
http://www.fao.org/globalsoilpartnership
This presentation was made during the GSP/E-SOTER Global Soil Information workshop that took place at the FAO HQ, Rome , Italy from 20-23 March 2012. This presentation was made on the second day by Joanna Zawadzka, and it presents Enhancing the terrain component in SOTER database.
©FAO: http://www.fao.org
Dr Richard Fry - Using R as a GIS
R is a free and open-source programming language and software environment for statistical analysis and graphics. It has over 9,000 packages that allow users to perform spatial analysis and visualization. R allows users to integrate multiple analyses in one software, link to different resources, and build various outputs. It is useful for spatial analysis tasks like interpolation of data, producing density maps, and examining residuals without being a "black box." R and R Studio allow reproducible research through R Markdown and sharing of workflows and analysis tools through packages.
Projections
This document discusses map projections and their use in GIS. It begins by explaining that map projections are needed to portray the spherical Earth on a flat surface, and that coordinate reference systems define the relationship between projected maps and real-world locations. It then discusses different types of map projections, including their advantages and disadvantages. Specifically, it covers conformal, equal-distance, and equal-area projections. It also discusses terminology like datum, spheroid, and false northing/easting values. Finally, it provides guidance on choosing a suitable projection and properly assigning projections in GIS projects.
The Analogues R-Package - Ramirez-Villegas
The Analogues R-Package - Ramirez-VillegasCCAFS | CGIAR Research Program on Climate Change, Agriculture and Food Security
Presentation by Julian Ramirez-Villegas.
CCAFS workshop titled "Using Climate Scenarios and Analogues for Designing Adaptation Strategies in Agriculture," 19-23 September in Kathmandu, Nepal. Os Percy
The document discusses best practices for open source web mapping using open source GIS software. It describes the typical "LAMP" stack components of Linux, Apache, MySQL, and PHP/MapServer that are often used. Specific open source libraries and software discussed include GDAL, OGR, GD, Proj.4, FreeType, GEOS, and Shapelib. It also summarizes the choices for developing web mapping applications using PHP/MapScript with JavaScript or pure CGI templates. Examples of special features in some web mapping applications are provided.
GIS fundamentals - raster
This document discusses raster data in GIS. Raster data represents geographic information as a grid of cells or pixels organized into a matrix of rows and columns. Each cell contains a value representing information such as elevation, vegetation index, or land use class. Raster data can represent data as integers, floats, or other data types and comes in various resolutions, with higher resolution providing more detail. Rasters can be single band (one value per cell) or multiband (multiple values per cell representing different wavelengths). Examples of raster data sources include remote sensing imagery, digital elevation models, and land cover maps.
GIS and QGIS training notes
The document provides an introduction to Geographic Information Systems (GIS) and the open-source GIS software QGIS. It discusses John Snow's 1854 map of a cholera outbreak in London and how it helped establish epidemiology. It then defines GIS and describes common components like data input/output, data models, and editing tools. The document also demonstrates how to perform tasks in QGIS like adding vector and raster layers, importing GPX files, editing shapefiles, creating new layers, merging shapefiles, and filtering/separating data.
GIS and Mapping Software Introduction
This document provides an introduction to geographic information systems (GIS) and mapping software. It discusses that GIS integrates spatial data by capturing, storing, analyzing, displaying, and outputting different layers of information. These layers can represent data as either raster images made of cells or vector features defined by points, lines, and polygons with associated attributes. The document recommends QGIS as open source software that is easy to learn and has an active user community for creating and analyzing maps.
ArcGIS and Multi-D: Tools & Roadmap
The document discusses Esri's tools and roadmap for working with multi-dimensional (MD) scientific data in ArcGIS. It outlines Esri's efforts to directly read HDF, GRIB, and netCDF files as raster layers or feature/table views in ArcGIS. MD mosaic datasets allow users to manage variables and dimensions across multiple files and perform on-the-fly computations and visualization of MD data. New functions have been added to improve MD data analysis and visualization, including a vector field renderer to depict raster data as vectors. Esri is also working to better support OPeNDAP data sources.
Day 6 - PostGIS
This document introduces PostGIS, an extension to PostgreSQL that adds support for geographic objects allowing location queries to be run in SQL. It discusses geospatial data types and functions in PostGIS for working with spatial features like points, lines, polygons, and rasters. PostGIS allows importing and exporting geospatial data, integration with GIS software, and access to open mapping data sources. It also covers spatial queries and analysis in PostGIS using functions for distance, containment, intersections and more. Additional topics mentioned include pgRouting for routing/navigation, generating maps/images from PostGIS data, and real-world use cases.
More Related Content
What's hot
Using R to Visualize Spatial Data: R as GIS - Guy Lansley
This talk demonstrates some of the benefits of using R to visualize spatial data efficiently and clearly.
It was originally presented by Guy Lansley (UCL and the Consumer Data Research Centre) to the GIS for Social Data and Crisis Mapping Workshop at the University of Kent.
Spatial Data Science with R
Slide show for the webinar on "Spatial Data Science with R" organized for the GeoDevelopers.org community. The video of the webinar and all the related materials including source code and sample data can be downloaded from this link: http://amsantac.co/blog/en/2016/08/07/spatial-data-science-r.html
In this webinar I talked about Data Science in the context of its application to spatial data and explained how we can use the R language for the analysis of geographic information within the different stages of a data science workflow, from the import and processing of spatial data to visualization and publication of results.
Portfolio_Gis_others
This document discusses using GIS for landscape planning and management. It describes how to create geodatabases and import data. It also covers georeferencing data, analyzing Landsat imagery and DEM data. Village census data and groundwater resources are analyzed. Natural layers like soil, geology and land use are studied to determine characteristics, erosion risk, recharge potential and agricultural suitability. The document presents case studies on regional planning in Mt. Abu, environmental monitoring of rivers and groundwater, city planning in Ahmedabad, and ecological restoration of mangroves. Figures provide examples of maps and analyses produced through GIS.
Adding data into GIS
This document summarizes a GIS training session at IOE Pulchowk covering adding various data types to projects, including vector shapefiles, coordinate data from Excel, and image data from online sources like the Shuttle Radar Topography Mission. It discusses importing Excel data, defining the coordinate system, classifying data as points, lines or polygons, and the differences between shapefile and layer file formats. The training covered using shapefiles to store location and attribute data, while layer files primarily store symbology and properties without the raw data.
Józsa e.
This document describes a study that used ArcGIS and R software to automatically analyze catchments based on digital elevation models. The study area was the Vasas-Belvárd catchment in Hungary. Methods included using TauDEM tools in ArcGIS to extract watersheds and stream networks from a DEM and attribute tables. R was integrated to perform statistical analyses. Results included floodplain maps extracted after normalizing slope and curvature data to improve interpretation, and long profiles of elevation drop and sinuosity. The study demonstrated the interoperability of ArcGIS and R for automated catchment analysis and that normalizing land surface parameters was useful for floodplain extraction. Further research was suggested to automate mapping, fine-tune thresholds, and
Spatial is Not Special ?
Spatial analysis is not just about GIS software skills. While GIS techniques like projections, data models, analysis, and rendering are important aspects of spatial analysis, maps simplify complex spatial relationships and spatial data can be understood in various ways. True understanding of spatial concepts requires going beyond just GIS software to consider how maps convey information and how people interpret spatial information differently.
Lecture 1b introduction to arc gis
GIS is a system for storing, mapping, and analyzing spatial data. ArcGIS is a GIS software created by ESRI. It includes ArcCatalog for data management, ArcMap for visualization and analysis, and ArcToolbox for geoprocessing tools. ArcGIS uses both vector and raster data models to represent geographic features and imagery. It can store data in shapefiles, geodatabases, coverages, and other formats. ArcCatalog allows users to organize, search, and document their spatial data with metadata. ArcMap allows users to visualize, query, and analyze spatial data in layers.
Defination of gis and components of arc gis
GIS is a combination of software, hardware, geographical data, and tools for capturing, storing, retrieving, manipulating, analyzing, and presenting map-based information. The document outlines the history and components of ArcGIS software, the most popular GIS platform, including ArcMap for mapping and editing, ArcCatalog for database management, and ArcScene and ArcGlobe for 3D visualization and analysis.
The National Soil Information System of Sudan
The document summarizes the steps taken to establish the National Soil Information System of Sudan (SUSIS) from 2013 to 2016. It involved data collection from archives and field work, data entry and harmonization, recruiting consultants, purchasing equipment, setting up a geoportal, and training on open source software and data. Various maps were produced, including soil maps, property maps on texture, carbon, and threats. Field data was merged with existing data to create national soil maps and identify gaps for further data collection and analysis. The system aims to make soil data accessible online through a geoportal.
R Spatial Analysis using SP
This document summarizes the use of spatial data analysis in R using the sp package. It discusses how to create and manipulate spatial point, line, polygon and grid objects. It provides an example of analyzing Colorado tornado data and counting storms in hexagonal grids over the United States to demonstrate spatial analysis techniques in R.
Georeferencing
Geo-referencing aligns raster or CAD data to a reference dataset with a known coordinate system. This process identifies control points visible in both datasets and links them, applying a transformation to align the original dataset to the reference. Geo-referencing can correct minor shifts or more drastic displacements. It saves transformation information in an external file or rectifies the data into the reference system. Spatial adjustment similarly aligns vector data during an edit session using transformation, edge-matching, or rubber sheeting methods based on control point links.
Exploring spatial data in GIS Environment
This document outlines the agenda for day 5 of a GIS training at IOE Pulchowk, including understanding file types like shapefiles and their components, exploring data properties and tools in the Arc Toolbox, and three assignments - creating a proportional point symbol map of gas stations, making a custom toolbar, and finding differences between two point layers.
e-SOTER Regional pilot platform as EU contribution to a Global Soil observing...
http://www.fao.org/globalsoilpartnership
This presentation was made during the GSP/E-SOTER Global Soil Information workshop that took place at the FAO HQ, Rome , Italy from 20-23 March 2012. This presentation was made on the second day by Joanna Zawadzka, and it presents Enhancing the terrain component in SOTER database.
©FAO: http://www.fao.org
Dr Richard Fry - Using R as a GIS
R is a free and open-source programming language and software environment for statistical analysis and graphics. It has over 9,000 packages that allow users to perform spatial analysis and visualization. R allows users to integrate multiple analyses in one software, link to different resources, and build various outputs. It is useful for spatial analysis tasks like interpolation of data, producing density maps, and examining residuals without being a "black box." R and R Studio allow reproducible research through R Markdown and sharing of workflows and analysis tools through packages.
Projections
This document discusses map projections and their use in GIS. It begins by explaining that map projections are needed to portray the spherical Earth on a flat surface, and that coordinate reference systems define the relationship between projected maps and real-world locations. It then discusses different types of map projections, including their advantages and disadvantages. Specifically, it covers conformal, equal-distance, and equal-area projections. It also discusses terminology like datum, spheroid, and false northing/easting values. Finally, it provides guidance on choosing a suitable projection and properly assigning projections in GIS projects.
The Analogues R-Package - Ramirez-Villegas
The Analogues R-Package - Ramirez-VillegasCCAFS | CGIAR Research Program on Climate Change, Agriculture and Food Security
Presentation by Julian Ramirez-Villegas.
CCAFS workshop titled "Using Climate Scenarios and Analogues for Designing Adaptation Strategies in Agriculture," 19-23 September in Kathmandu, Nepal. Os Percy
The document discusses best practices for open source web mapping using open source GIS software. It describes the typical "LAMP" stack components of Linux, Apache, MySQL, and PHP/MapServer that are often used. Specific open source libraries and software discussed include GDAL, OGR, GD, Proj.4, FreeType, GEOS, and Shapelib. It also summarizes the choices for developing web mapping applications using PHP/MapScript with JavaScript or pure CGI templates. Examples of special features in some web mapping applications are provided.
GIS fundamentals - raster
This document discusses raster data in GIS. Raster data represents geographic information as a grid of cells or pixels organized into a matrix of rows and columns. Each cell contains a value representing information such as elevation, vegetation index, or land use class. Raster data can represent data as integers, floats, or other data types and comes in various resolutions, with higher resolution providing more detail. Rasters can be single band (one value per cell) or multiband (multiple values per cell representing different wavelengths). Examples of raster data sources include remote sensing imagery, digital elevation models, and land cover maps.
GIS and QGIS training notes
The document provides an introduction to Geographic Information Systems (GIS) and the open-source GIS software QGIS. It discusses John Snow's 1854 map of a cholera outbreak in London and how it helped establish epidemiology. It then defines GIS and describes common components like data input/output, data models, and editing tools. The document also demonstrates how to perform tasks in QGIS like adding vector and raster layers, importing GPX files, editing shapefiles, creating new layers, merging shapefiles, and filtering/separating data.
GIS and Mapping Software Introduction
This document provides an introduction to geographic information systems (GIS) and mapping software. It discusses that GIS integrates spatial data by capturing, storing, analyzing, displaying, and outputting different layers of information. These layers can represent data as either raster images made of cells or vector features defined by points, lines, and polygons with associated attributes. The document recommends QGIS as open source software that is easy to learn and has an active user community for creating and analyzing maps.
What's hot (20)
Using R to Visualize Spatial Data: R as GIS - Guy Lansley
Using R to Visualize Spatial Data: R as GIS - Guy Lansley
e-SOTER Regional pilot platform as EU contribution to a Global Soil observing...
e-SOTER Regional pilot platform as EU contribution to a Global Soil observing...
Similar to Install Digital Soil Mapping Software
ArcGIS and Multi-D: Tools & Roadmap
The document discusses Esri's tools and roadmap for working with multi-dimensional (MD) scientific data in ArcGIS. It outlines Esri's efforts to directly read HDF, GRIB, and netCDF files as raster layers or feature/table views in ArcGIS. MD mosaic datasets allow users to manage variables and dimensions across multiple files and perform on-the-fly computations and visualization of MD data. New functions have been added to improve MD data analysis and visualization, including a vector field renderer to depict raster data as vectors. Esri is also working to better support OPeNDAP data sources.
Day 6 - PostGIS
This document introduces PostGIS, an extension to PostgreSQL that adds support for geographic objects allowing location queries to be run in SQL. It discusses geospatial data types and functions in PostGIS for working with spatial features like points, lines, polygons, and rasters. PostGIS allows importing and exporting geospatial data, integration with GIS software, and access to open mapping data sources. It also covers spatial queries and analysis in PostGIS using functions for distance, containment, intersections and more. Additional topics mentioned include pgRouting for routing/navigation, generating maps/images from PostGIS data, and real-world use cases.
Building Location Aware Apps - Get Started with PostGIS, PART II
This document provides an introduction to using PostGIS for building location-aware applications. It discusses importing geospatial data like shapefiles, CSVs, and OpenStreetMap data into a Postgres database using tools like shp2pgsql, psql, and osm2pgsql. It also covers visualizing the data in desktop GIS tools like QGIS and OpenJUMP and performing spatial queries and analyses. Exercises demonstrate importing different data sources and setting up database tables and stored procedures to power a mobile application for finding nearby points of interest based on a user's location.
GIS for Recorders
This document provides an introduction to Geographic Information Systems (GIS) and discusses how they can be used by recorders to map plant records and distributions. It covers the history and democratization of GIS, introduces the open-source software QGIS, and provides examples of data sources and basic mapping processes like creating base maps, progress reports, and printed/web maps. The document aims to illustrate how GIS can enhance the work of recorders beyond traditional spreadsheet software.
GIS_Whirlwind_Tour.ppt
This document provides a whirlwind tour of GIS concepts in 25 slides. It defines GIS as geographical information science and discusses data capture methods like surveys and remote sensing. It explores analysis and visualization techniques, different GIS platforms, common spatial phenomena modeled in GIS, and modeling approaches. The document also covers GIS history, software, data types, attributes, overlay operations, coordinate reference systems, common file formats, data storage, open source GIS, web GIS, and potential future directions for GIS including location-based services and cloud computing.
GIS_Whirlwind_Tour.ppt
This document provides a whirlwind tour of GIS concepts in 25 slides. It defines GIS as geographical information science and discusses data capture techniques including remote sensing and sensor networks. It explores analysis and visualization of spatial data in 2D and 3D maps and how visualization can enable further analysis. The document also briefly outlines the history of GIS software and formats, as well as concepts like spatial data types, attributes, modeling frameworks, coordinate reference systems, and industry standard and open source GIS tools. It concludes with discussions of future directions for GIS including location-based services, sensors, cloud computing, and social implications.
GIS_Whirlwind_Tour.ppt
This document provides a whirlwind tour of GIS concepts in 25 slides. It defines GIS as geographical information science and discusses data capture methods like remote sensing and GPS. It explains how spatial data can be analyzed and visualized in 2D and 3D maps. Common data types in GIS like vector and raster data are introduced along with concepts like attributes, overlay operations, and coordinate reference systems. Popular GIS software like ArcGIS and open source options are overviewed. The document concludes by discussing emerging areas in GIS like web mapping, mobile apps, sensor networks, and cloud computing.
GIS_Whirlwind_Tour.ppt
This document provides a whirlwind tour of GIS concepts in 25 slides. It defines GIS as geographical information science and discusses data capture methods like surveys and remote sensing. It explains how GIS allows for analysis and visualization of spatial data in 2D and 3D maps. Key aspects of GIS covered include its history, common data types of vector and raster, attributes, modeling frameworks, data storage, open source options, and future directions such as location-based services and cloud computing. The document aims to quickly introduce fundamental GIS concepts.
Gis and digital_map_fundamentals
The document provides information about an Earth Sciences and Geology Honours Foundation course. It outlines the topics to be covered in three Thursday seminars in May on GIS, imagery, digital maps, and MapInfo. It describes available departmental software and notes some software is not available. It assigns a module project due June 4th to create a GIS dataset and map mock-up demonstrating key skills and concepts. It provides guidance on submitting the assignment and notes the department file structure for course materials. It also includes background information on databases, spreadsheet databases, relational databases, and best practices for database design.
Databases Basics and Spacial Matrix - Discussig Geographic Potentials of Data...
A core introduction to Data Types, Databases around us and the use cases, Integrating GeoSpacial Arrangements to our projects. This include Speaker Notes. and is indented to give an overall idea about things not focusing on a specific focus. This Incudes references of Relational Databases likePostgresql and Mysql, Key Value databases like Redis, Document DB like MongoDB, Search Engines like ElasticSearch, and the second part handles with GeoSpatial Arrangements in Postgis.
Modelling complex geometry structures using SAP2000 API
This document discusses modelling complex geometry structures using computational tools. It describes various complex geometries used in architecture like shells, helicoids and catenoids. It then discusses using Rhinoceros and Grasshopper to model these and exporting models to SAP2000 for structural analysis. It also describes using SAP2000's API to directly model geometries without intermediate files. A case study is presented on modelling the Kresge Auditorium using the API to define nodes, elements, loads and material properties in an .s2k file for analysis in SAP2000. The API approach is said to allow customized modelling procedures tailored for specific projects without intermediate files.
Efficient Query Processing in Geographic Web Search Engines
Geographic web search engines allow users to constrain and order search results in an intuitive manner by focusing a query on a particular geographic region. Geographic search technology, also called local search, has recently received significant interest from major search engine companies. Academic research in this area has focused primarily on techniques for extracting geographic knowledge from the web. In this paper, we study the problem of efficient query processing in scalable geographic search engines. Query processing is a major bottleneck in standard web search engines, and the main reason for the thousands of machines used by the major engines. Geographic search engine query processing is different in that it requires a combination of text and spatial data processing techniques. We propose several algorithms for efficient query processing in geographic search engines, integrate them into an existing web search query processor, and evaluate them on large sets of real data and query traces.
Q GIS Training Presentation
This document provides an introduction to Geographic Information Systems (GIS) and the open-source GIS software Quantum GIS (QGIS). It discusses what GIS is, its components and uses, and gives an overview of QGIS's interface and functions. The document then demonstrates how to load shapefiles and join CSV files in QGIS, and provides examples of creating graduated, hot spot and density maps. Finally, it discusses QGIS installation, documentation, file formats and a practical assignment on mapping immunization data.
Scala and spark
This document provides an introduction to Apache Spark, including its architecture and programming model. Spark is a cluster computing framework that provides fast, in-memory processing of large datasets across multiple cores and nodes. It improves upon Hadoop MapReduce by allowing iterative algorithms and interactive querying of datasets through its use of resilient distributed datasets (RDDs) that can be cached in memory. RDDs act as immutable distributed collections that can be manipulated using transformations and actions to implement parallel operations.
Essentials of R
The presentation was given by Mr. Bas Kempen, ISRIC, during the GSOC Mapping Global Training hosted by ISRIC - World Soil Information, 6 - 23 June 2017, Wageningen (The Netherlands).
ITResumeKlonWaldrip
Klon Joseph Waldrip is an experienced stormwater infrastructure specialist and GIS analyst seeking a position providing skills in data management, analysis, and spatial analysis. He has a background in authoring NPDES and SWMP reports for Rockdale County and helping to educate county staff on GIS benefits. His skills include remote sensing, geospatial analysis, Python programming, database management, and LiDAR processing.
Advancing Scientific Data Support in ArcGIS
The document discusses how ArcGIS can be used to ingest, visualize, analyze, and share scientific data stored in formats like netCDF, HDF, and GRIB, including directly reading these files, creating multidimensional mosaics for aggregation, analyzing spatial and temporal patterns, publishing services and maps, and extending capabilities through Python tools and custom geoprocessing. ArcGIS supports the full scientific data workflow from ingesting data to sharing final results and apps on the web and with other platforms like WMS and Dapple Earth Explorer.
Geocart workshop
This document provides an overview of mapping and visualization techniques using ArcGIS. It discusses mapping concepts like reference mapping, thematic mapping, page layouts, 3D mapping, web maps and apps, story maps, and smart mapping. It also introduces the ArcGIS Living Atlas and Firefly cartography. Exercises are included to allow users to practice different mapping skills within ArcGIS like symbolizing layers, labeling maps, making page layouts, converting maps to scenes, and creating web apps.
Vancouver AWS Meetup Slides 11-20-2018 Apache Spark with Amazon EMR
An Introduction to Apache Spark with Amazon EMR. Dr. Peter Smith's presentation slides from the Vancouver Amazon Web Services User Group Meetup on November 20, 2018 at ACL hosted and presented by Onica.
Large Scale Geo Processing on Hadoop
This document discusses large scale geo processing on Hadoop. It begins with an introduction to geo processing and spatial data. It then covers pre-processing spatial data, loading it into HDFS, and performing analysis using tools like Hive, ESRI, and Hadoop. Finally, it provides examples of use cases like network analysis at T-Mobile Austria and traffic prediction using GPS data.
Similar to Install Digital Soil Mapping Software (20)
Building Location Aware Apps - Get Started with PostGIS, PART II
Building Location Aware Apps - Get Started with PostGIS, PART II
Databases Basics and Spacial Matrix - Discussig Geographic Potentials of Data...
Databases Basics and Spacial Matrix - Discussig Geographic Potentials of Data...
Modelling complex geometry structures using SAP2000 API
Modelling complex geometry structures using SAP2000 API
Efficient Query Processing in Geographic Web Search Engines
Efficient Query Processing in Geographic Web Search Engines
Vancouver AWS Meetup Slides 11-20-2018 Apache Spark with Amazon EMR
Vancouver AWS Meetup Slides 11-20-2018 Apache Spark with Amazon EMR
More from FAO
Mozambique
AfriLAB: Regional Soil Laboratory Network for Africa | First meeting. 21 - 24 May 2019 | Nairobi, Kenya
Zimbabwe takesure
AfriLAB: Regional Soil Laboratory Network for Africa | First meeting. 21 - 24 May 2019 | Nairobi, Kenya
Spal presentation
AfriLAB: Regional Soil Laboratory Network for Africa | First meeting. 21 - 24 May 2019 | Nairobi, Kenya
Nigeria uponi
AfriLAB: Regional Soil Laboratory Network for Africa | First meeting. 21 - 24 May 2019 | Nairobi, Kenya
The multi-faced role of soil in the NENA regions (part 2)
The Near East and North Africa (NENA) Land and Water Days
31 March-4 April 2019
Cairo, Egypt
Lucrezia Caon, GSP secretariat
The multi-faced role of soil in the NENA regions (part 1)
The Near East and North Africa (NENA) Land and Water Days
31 March-4 April 2019
Cairo, Egypt
Lucrezia Caon, GSP secretariat
Agenda of the launch of the soil policy brief at the Land&Water Days
The Near East and North Africa (NENA) Land and Water Days
31 March-4 April 2019
Cairo, Egypt
Lucrezia Caon, GSP secretariat
Agenda of the 5th NENA Soil Partnership meeting
The Fifth meeting of the Near East and North African (NENA) Soil Partnership will take place from 1-2 April 2019 in Cairo, Egypt. The objectives of the meeting are to consolidate the NENA Soil Partnership, review the work plan, organize activities to establish National Soil Information Systems, agree to launch a Regional Soil Laboratory for NENA, and strengthen networking. The meeting agenda includes discussions on soil information systems, a soil laboratory network, and implementing the Voluntary Guidelines for Sustainable Soil Management. The performance of the NENA Soil Partnership will also be assessed and future strategies developed.
The Voluntary Guidelines for Sustainable Soil Management
The 5th NENA Soil Partnership meeting
01 Apr 2019 - 02 Apr 2019
Cairo, Egypt
Lucrezia Caon, GSP secretariat
GLOSOLAN - Mission, status and way forward
This document summarizes the proceedings of the first meeting of the Global Soil Laboratory Network (GLOSOLAN). GLOSOLAN was established to harmonize soil analysis methods and strengthen the performance of laboratories through standardized protocols. The meeting discussed the role of National Reference Laboratories in promoting harmonization, and how GLOSOLAN is structured with regional networks feeding into the global network. Progress made in 2018 included registering over 200 laboratories, assessing capacities and needs, and establishing regional networks. The work plan for 2019 includes further developing regional networks, standard methods, a best practice manual, and the first global proficiency testing. The document concludes by outlining next steps to launch the regional network for North Africa and the Near East.
Towards a Global Soil Information System (GLOSIS)
The 5th NENA Soil Partnership meeting
01 Apr 2019 - 02 Apr 2019
Cairo, Egypt
Lucrezia Caon, GSP secretariat
GSP developments of regional interest in 2019
The 5th NENA Soil Partnership meeting
01 Apr 2019 - 02 Apr 2019
Cairo, Egypt
Lucrezia Caon, GSP secretariat
More from FAO (20)
The multi-faced role of soil in the NENA regions (part 2)
The multi-faced role of soil in the NENA regions (part 2)
The multi-faced role of soil in the NENA regions (part 1)
The multi-faced role of soil in the NENA regions (part 1)
Agenda of the launch of the soil policy brief at the Land&Water Days
Agenda of the launch of the soil policy brief at the Land&Water Days
The Voluntary Guidelines for Sustainable Soil Management
The Voluntary Guidelines for Sustainable Soil Management
Recently uploaded
ISO/IEC 27001, ISO/IEC 42001, and GDPR: Best Practices for Implementation and...
Denis is a dynamic and results-driven Chief Information Officer (CIO) with a distinguished career spanning information systems analysis and technical project management. With a proven track record of spearheading the design and delivery of cutting-edge Information Management solutions, he has consistently elevated business operations, streamlined reporting functions, and maximized process efficiency.
Certified as an ISO/IEC 27001: Information Security Management Systems (ISMS) Lead Implementer, Data Protection Officer, and Cyber Risks Analyst, Denis brings a heightened focus on data security, privacy, and cyber resilience to every endeavor.
His expertise extends across a diverse spectrum of reporting, database, and web development applications, underpinned by an exceptional grasp of data storage and virtualization technologies. His proficiency in application testing, database administration, and data cleansing ensures seamless execution of complex projects.
What sets Denis apart is his comprehensive understanding of Business and Systems Analysis technologies, honed through involvement in all phases of the Software Development Lifecycle (SDLC). From meticulous requirements gathering to precise analysis, innovative design, rigorous development, thorough testing, and successful implementation, he has consistently delivered exceptional results.
Throughout his career, he has taken on multifaceted roles, from leading technical project management teams to owning solutions that drive operational excellence. His conscientious and proactive approach is unwavering, whether he is working independently or collaboratively within a team. His ability to connect with colleagues on a personal level underscores his commitment to fostering a harmonious and productive workplace environment.
Date: May 29, 2024
Tags: Information Security, ISO/IEC 27001, ISO/IEC 42001, Artificial Intelligence, GDPR
-------------------------------------------------------------------------------
Find out more about ISO training and certification services
Training: ISO/IEC 27001 Information Security Management System - EN | PECB
ISO/IEC 42001 Artificial Intelligence Management System - EN | PECB
General Data Protection Regulation (GDPR) - Training Courses - EN | PECB
Webinars: https://pecb.com/webinars
Article: https://pecb.com/article
-------------------------------------------------------------------------------
For more information about PECB:
Website: https://pecb.com/
LinkedIn: https://www.linkedin.com/company/pecb/
Facebook: https://www.facebook.com/PECBInternational/
Slideshare: http://www.slideshare.net/PECBCERTIFICATION
Leveraging Generative AI to Drive Nonprofit Innovation
In this webinar, participants learned how to utilize Generative AI to streamline operations and elevate member engagement. Amazon Web Service experts provided a customer specific use cases and dived into low/no-code tools that are quick and easy to deploy through Amazon Web Service (AWS.)
The Diamonds of 2023-2024 in the IGRA collection
A review of the growth of the Israel Genealogy Research Association Database Collection for the last 12 months. Our collection is now passed the 3 million mark and still growing. See which archives have contributed the most. See the different types of records we have, and which years have had records added. You can also see what we have for the future.
Reimagining Your Library Space: How to Increase the Vibes in Your Library No ...
Librarians are leading the way in creating future-ready citizens – now we need to update our spaces to match. In this session, attendees will get inspiration for transforming their library spaces. You’ll learn how to survey students and patrons, create a focus group, and use design thinking to brainstorm ideas for your space. We’ll discuss budget friendly ways to change your space as well as how to find funding. No matter where you’re at, you’ll find ideas for reimagining your space in this session.
What is Digital Literacy? A guest blog from Andy McLaughlin, University of Ab...
What is Digital Literacy? A guest blog from Andy McLaughlin, University of Aberdeen
Main Java[All of the Base Concepts}.docx
This is part 1 of my Java Learning Journey. This Contains Custom methods, classes, constructors, packages, multithreading , try- catch block, finally block and more.
BÀI TẬP DẠY THÊM TIẾNG ANH LỚP 7 CẢ NĂM FRIENDS PLUS SÁCH CHÂN TRỜI SÁNG TẠO ...
BÀI TẬP DẠY THÊM TIẾNG ANH LỚP 7 CẢ NĂM FRIENDS PLUS SÁCH CHÂN TRỜI SÁNG TẠO ...Nguyen Thanh Tu Collection
https://app.box.com/s/qhtvq32h4ybf9t49ku85x0n3xl4jhr15Beyond Degrees - Empowering the Workforce in the Context of Skills-First.pptx
Iván Bornacelly, Policy Analyst at the OECD Centre for Skills, OECD, presents at the webinar 'Tackling job market gaps with a skills-first approach' on 12 June 2024
ANATOMY AND BIOMECHANICS OF HIP JOINT.pdf
it describes the bony anatomy including the femoral head , acetabulum, labrum . also discusses the capsule , ligaments . muscle that act on the hip joint and the range of motion are outlined. factors affecting hip joint stability and weight transmission through the joint are summarized.
How to deliver Powerpoint Presentations.pptx
"How to make and deliver dynamic presentations by making it more interactive to captivate your audience attention"
Pengantar Penggunaan Flutter - Dart programming language1.pptx
Pengantar Penggunaan Flutter - Dart programming language1.pptx
How to Setup Warehouse & Location in Odoo 17 Inventory
In this slide, we'll explore how to set up warehouses and locations in Odoo 17 Inventory. This will help us manage our stock effectively, track inventory levels, and streamline warehouse operations.
Pollock and Snow "DEIA in the Scholarly Landscape, Session One: Setting Expec...
Pollock and Snow "DEIA in the Scholarly Landscape, Session One: Setting Expec...National Information Standards Organization (NISO)
This presentation was provided by Steph Pollock of The American Psychological Association’s Journals Program, and Damita Snow, of The American Society of Civil Engineers (ASCE), for the initial session of NISO's 2024 Training Series "DEIA in the Scholarly Landscape." Session One: 'Setting Expectations: a DEIA Primer,' was held June 6, 2024.বাংলাদেশ অর্থনৈতিক সমীক্ষা (Economic Review) ২০২৪ UJS App.pdf
বাংলাদেশের অর্থনৈতিক সমীক্ষা ২০২৪ [Bangladesh Economic Review 2024 Bangla.pdf] কম্পিউটার , ট্যাব ও স্মার্ট ফোন ভার্সন সহ সম্পূর্ণ বাংলা ই-বুক বা pdf বই " সুচিপত্র ...বুকমার্ক মেনু 🔖 ও হাইপার লিংক মেনু 📝👆 যুক্ত ..
আমাদের সবার জন্য খুব খুব গুরুত্বপূর্ণ একটি বই ..বিসিএস, ব্যাংক, ইউনিভার্সিটি ভর্তি ও যে কোন প্রতিযোগিতা মূলক পরীক্ষার জন্য এর খুব ইম্পরট্যান্ট একটি বিষয় ...তাছাড়া বাংলাদেশের সাম্প্রতিক যে কোন ডাটা বা তথ্য এই বইতে পাবেন ...
তাই একজন নাগরিক হিসাবে এই তথ্য গুলো আপনার জানা প্রয়োজন ...।
বিসিএস ও ব্যাংক এর লিখিত পরীক্ষা ...+এছাড়া মাধ্যমিক ও উচ্চমাধ্যমিকের স্টুডেন্টদের জন্য অনেক কাজে আসবে ...
How to Manage Your Lost Opportunities in Odoo 17 CRM
Odoo 17 CRM allows us to track why we lose sales opportunities with "Lost Reasons." This helps analyze our sales process and identify areas for improvement. Here's how to configure lost reasons in Odoo 17 CRM
Recently uploaded (20)
ISO/IEC 27001, ISO/IEC 42001, and GDPR: Best Practices for Implementation and...
ISO/IEC 27001, ISO/IEC 42001, and GDPR: Best Practices for Implementation and...
Leveraging Generative AI to Drive Nonprofit Innovation
Leveraging Generative AI to Drive Nonprofit Innovation
Reimagining Your Library Space: How to Increase the Vibes in Your Library No ...
Reimagining Your Library Space: How to Increase the Vibes in Your Library No ...
What is Digital Literacy? A guest blog from Andy McLaughlin, University of Ab...
What is Digital Literacy? A guest blog from Andy McLaughlin, University of Ab...
Film vocab for eal 3 students: Australia the movie
Film vocab for eal 3 students: Australia the movie
BÀI TẬP DẠY THÊM TIẾNG ANH LỚP 7 CẢ NĂM FRIENDS PLUS SÁCH CHÂN TRỜI SÁNG TẠO ...
BÀI TẬP DẠY THÊM TIẾNG ANH LỚP 7 CẢ NĂM FRIENDS PLUS SÁCH CHÂN TRỜI SÁNG TẠO ...
Beyond Degrees - Empowering the Workforce in the Context of Skills-First.pptx
Beyond Degrees - Empowering the Workforce in the Context of Skills-First.pptx
Pengantar Penggunaan Flutter - Dart programming language1.pptx
Pengantar Penggunaan Flutter - Dart programming language1.pptx
How to Setup Warehouse & Location in Odoo 17 Inventory
How to Setup Warehouse & Location in Odoo 17 Inventory
Digital Artefact 1 - Tiny Home Environmental Design
Digital Artefact 1 - Tiny Home Environmental Design
Pollock and Snow "DEIA in the Scholarly Landscape, Session One: Setting Expec...
Pollock and Snow "DEIA in the Scholarly Landscape, Session One: Setting Expec...
বাংলাদেশ অর্থনৈতিক সমীক্ষা (Economic Review) ২০২৪ UJS App.pdf
বাংলাদেশ অর্থনৈতিক সমীক্ষা (Economic Review) ২০২৪ UJS App.pdf
How to Manage Your Lost Opportunities in Odoo 17 CRM
How to Manage Your Lost Opportunities in Odoo 17 CRM
Install Digital Soil Mapping Software
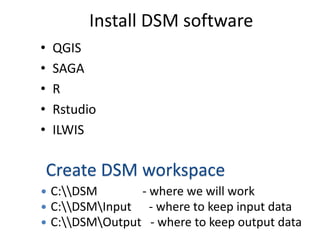
- 1. Install DSM software • QGIS • SAGA • R • Rstudio • ILWIS Create DSM workspace C:DSM - where we will work C:DSMInput - where to keep input data C:DSMOutput - where to keep output data
- 2. Familiarity with MS Office
- 3. Example: Soil profile data from ISRIC
- 4. Explore data and develop database • Import maps in QGIS and explore • Open MS Office data and explore • Scan hard copy maps and explore • Exploration – Legend – Contents (codes, classes, missing, range, etc.) – Georeferencing (Projection, coordinates, tie-points) – Documentation (report, methods, etc) • Classify data quality
- 5. Building geo-database • Geo-reference the images • Digitize boundaries where possible • Enter/convert the point-data into CSV database • Re-project the maps to common datum – MODIS (in Sinusoidal-Sphere projection) : convert +proj=sinu +lon_0=30 +x_0=0 +y_0=0 +a=6370997 +b=6371000 +units=m +no_defs • Save all the project/database in one folder
- 6. Example geo-database • Use tie-points to georeference the jpeg image • Digitize and build geo-database where possible (and clean using topology clean tool) • Import other layers (environmental factors) • Import MS Excel files into geo-database (use CSV) and convert to shapefiles • Document all the data in the database
- 7. Assignment: Building geo-database for DSM application-STEP 1 • Use your own data • Explore the data • Follow the steps for building the geo-database • Build the DSM geo-database • Save the database (C:DSMInput) • Remember to hand in your work by Next Morning before start of the session