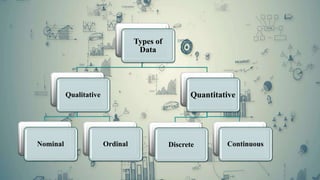
Brief introduction to Data and its types.
There are different types of data in Statistics, that are collected, analysed, interpreted and presented. The data are the individual pieces of factual information recorded, and it is used for the purpose of the analysis process. The two processes of data analysis are interpretation and presentation. Statistics are the result of data analysis. Data classification and data handling are important processes as it involves a multitude of tags and labels to define the data, its integrity and confidentiality. In this article, we are going to discuss the different types of data in statistics in detail.
The data is classified into majorly four categories:
Nominal data
Ordinal data
Discrete data
Continuous data
Qualitative or Categorical Data
Qualitative data, also known as the categorical data, describes the data that fits into the categories. Qualitative data are not numerical. The categorical information involves categorical variables that describe the features such as a person’s gender, home town etc. Categorical measures are defined in terms of natural language specifications, but not in terms of numbers.
Sometimes categorical data can hold numerical values (quantitative value), but those values do not have a mathematical sense. Examples of the categorical data are birthdate, favourite sport, school postcode. Here, the birthdate and school postcode hold the quantitative value, but it does not give numerical meaning.
Nominal Data
Nominal data is one of the types of qualitative information which helps to label the variables without providing the numerical value. Nominal data is also called the nominal scale. It cannot be ordered and measured. But sometimes, the data can be qualitative and quantitative. Examples of nominal data are letters, symbols, words, gender etc.
The nominal data are examined using the grouping method. In this method, the data are grouped into categories, and then the frequency or the percentage of the data can be calculated. These data are visually represented using the pie charts.
Ordinal Data
Ordinal data/variable is a type of data that follows a natural order. The significant feature of the nominal data is that the difference between the data values is not determined. This variable is mostly found in surveys, finance, economics, questionnaires, and so on.
The ordinal data is commonly represented using a bar chart. These data are investigated and interpreted through many visualisation tools. The information may be expressed using tables in which each row in the table shows the distinct category.
Quantitative or Numerical Data
Quantitative data is also known as numerical data which represents the numerical value (i.e., how much, how often, how many). Numerical data gives information about the quantities of a specific thing. Some examples of numerical data are height, length, size, weight, and so on. The quantitative data can be classified into two different types based on the data
Data Analysis in Research: Descriptive Statistics & NormalityIkbal Ahmed
A Presentation on Data Analysis using descriptive statistics & normality. From this presentation you can know-
1) What is Data
2) Types of Data
3) What is Data analysis
4) Descriptive Statistics
5) Tools for assessing normality
Types of Data, Difference between Primary and Secondary Data, Collection of Primary Data, Questionnaire, Schedules, Interview, Survey, Observation, Secondary Data, Sources of Secondary Data, Tabulation of Data – Meaning and Types
Its a fully detailed topic about Editing , Coding, Tabulation o Data in research work.
The editing , coding , tabulation of data is been explained in this ppt.
Categorical DataCategorical data represents characteristics..docxketurahhazelhurst
Categorical Data
Categorical data represents characteristics. Therefore it can represent things like a person’s gender, language etc. Categorical data can also take on numerical values (Example: 1 for female and 0 for male). Note that those numbers don’t have mathematical meaning.
Nominal Data
Nominal values represent discrete units and are used to label variables, that have no quantitative value. Just think of them as „labels“. Note that nominal data that has no order. Therefore if you would change the order of its values, the meaning would not change. You can see two examples of nominal features below:
The left feature that describes a persons gender would be called „dichotomous“, which is a type of nominal scales that contains only two categories.
Ordinal Data
Ordinal values represent discrete and ordered units. It is therefore nearly the same as nominal data, except that it’s ordering matters. You can see an example below:
Note that the difference between Elementary and High School is different than the difference between High School and College. This is the main limitation of ordinal data, the differences between the values is not really known. Because of that, ordinal scales are usually used to measure non-numeric features like happiness, customer satisfaction and so on.
Numerical Data
1. Discrete Data
We speak of discrete data if its values are distinct and separate. In other words: We speak of discrete data if the data can only take on certain values. This type of data can’t be measured but it can be counted. It basically represents information that can be categorized into a classification. An example is the number of heads in 100 coin flips.
You can check by asking the following two questions whether you are dealing with discrete data or not: Can you count it and can it be divided up into smaller and smaller parts?
2. Continuous Data
Continuous Data represents measurements and therefore their values can’t be counted but they can be measured. An example would be the height of a person, which you can describe by using intervals on the real number line.
Interval Data
Interval values represent ordered units that have the same difference. Therefore we speak of interval data when we have a variable that contains numeric values that are ordered and where we know the exact differences between the values. An example would be a feature that contains temperature of a given place like you can see below:
The problem with interval values data is that they don’t have a „true zero“. That means in regards to our example, that there is no such thing as no temperature. With interval data, we can add and subtract, but we cannot multiply, divide or calculate ratios. Because there is no true zero, a lot of descriptive and inferential statistics can’t be applied.
Ratio Data
Ratio values are also ordered units that have the same difference. Ratio values are the same as interval values, with the difference that they do have an absolute zero. Good e ...
Practical applications and analysis in Research Methodology Hafsa Ranjha
practical application in research, reviews of qualitative and mixed method studies, analysis, processing the data, data editing , data coding , classification of data, analysis of data, parametric test, non parametric test in
Research Methodology
Kompetensi Data analitik merupakan kompetensi yang sangat dibutuhkan pada era industri 4.0. Kami siap memberikan pelatihan kepada karyawan perusahaan yang membutuhkan. Silahkan kontak kami di jhotank@yahoo.com atau di website http://corporaeuniversity-digital.com.
By understanding the different types of numerical data and their properties, we can make informed decisions about the appropriate statistical methods to use in analyzing the data. This can help us draw accurate conclusions and make sound decisions based on the data at hand. Therefore, it is important to have a good grasp of the different types of numerical data and their characteristics.
Classification of data is a crucial part of statistics. Here in this presentation we have discussed everything about classification of data. Watch this presentation till the end to get confident about data classification in statistics.
Read| The latest issue of The Challenger is here! We are thrilled to announce that our school paper has qualified for the NATIONAL SCHOOLS PRESS CONFERENCE (NSPC) 2024. Thank you for your unwavering support and trust. Dive into the stories that made us stand out!
We all have good and bad thoughts from time to time and situation to situation. We are bombarded daily with spiraling thoughts(both negative and positive) creating all-consuming feel , making us difficult to manage with associated suffering. Good thoughts are like our Mob Signal (Positive thought) amidst noise(negative thought) in the atmosphere. Negative thoughts like noise outweigh positive thoughts. These thoughts often create unwanted confusion, trouble, stress and frustration in our mind as well as chaos in our physical world. Negative thoughts are also known as “distorted thinking”.
Embracing GenAI - A Strategic ImperativePeter Windle
Artificial Intelligence (AI) technologies such as Generative AI, Image Generators and Large Language Models have had a dramatic impact on teaching, learning and assessment over the past 18 months. The most immediate threat AI posed was to Academic Integrity with Higher Education Institutes (HEIs) focusing their efforts on combating the use of GenAI in assessment. Guidelines were developed for staff and students, policies put in place too. Innovative educators have forged paths in the use of Generative AI for teaching, learning and assessments leading to pockets of transformation springing up across HEIs, often with little or no top-down guidance, support or direction.
This Gasta posits a strategic approach to integrating AI into HEIs to prepare staff, students and the curriculum for an evolving world and workplace. We will highlight the advantages of working with these technologies beyond the realm of teaching, learning and assessment by considering prompt engineering skills, industry impact, curriculum changes, and the need for staff upskilling. In contrast, not engaging strategically with Generative AI poses risks, including falling behind peers, missed opportunities and failing to ensure our graduates remain employable. The rapid evolution of AI technologies necessitates a proactive and strategic approach if we are to remain relevant.
Synthetic Fiber Construction in lab .pptxPavel ( NSTU)
Synthetic fiber production is a fascinating and complex field that blends chemistry, engineering, and environmental science. By understanding these aspects, students can gain a comprehensive view of synthetic fiber production, its impact on society and the environment, and the potential for future innovations. Synthetic fibers play a crucial role in modern society, impacting various aspects of daily life, industry, and the environment. ynthetic fibers are integral to modern life, offering a range of benefits from cost-effectiveness and versatility to innovative applications and performance characteristics. While they pose environmental challenges, ongoing research and development aim to create more sustainable and eco-friendly alternatives. Understanding the importance of synthetic fibers helps in appreciating their role in the economy, industry, and daily life, while also emphasizing the need for sustainable practices and innovation.
The Roman Empire A Historical Colossus.pdfkaushalkr1407
The Roman Empire, a vast and enduring power, stands as one of history's most remarkable civilizations, leaving an indelible imprint on the world. It emerged from the Roman Republic, transitioning into an imperial powerhouse under the leadership of Augustus Caesar in 27 BCE. This transformation marked the beginning of an era defined by unprecedented territorial expansion, architectural marvels, and profound cultural influence.
The empire's roots lie in the city of Rome, founded, according to legend, by Romulus in 753 BCE. Over centuries, Rome evolved from a small settlement to a formidable republic, characterized by a complex political system with elected officials and checks on power. However, internal strife, class conflicts, and military ambitions paved the way for the end of the Republic. Julius Caesar’s dictatorship and subsequent assassination in 44 BCE created a power vacuum, leading to a civil war. Octavian, later Augustus, emerged victorious, heralding the Roman Empire’s birth.
Under Augustus, the empire experienced the Pax Romana, a 200-year period of relative peace and stability. Augustus reformed the military, established efficient administrative systems, and initiated grand construction projects. The empire's borders expanded, encompassing territories from Britain to Egypt and from Spain to the Euphrates. Roman legions, renowned for their discipline and engineering prowess, secured and maintained these vast territories, building roads, fortifications, and cities that facilitated control and integration.
The Roman Empire’s society was hierarchical, with a rigid class system. At the top were the patricians, wealthy elites who held significant political power. Below them were the plebeians, free citizens with limited political influence, and the vast numbers of slaves who formed the backbone of the economy. The family unit was central, governed by the paterfamilias, the male head who held absolute authority.
Culturally, the Romans were eclectic, absorbing and adapting elements from the civilizations they encountered, particularly the Greeks. Roman art, literature, and philosophy reflected this synthesis, creating a rich cultural tapestry. Latin, the Roman language, became the lingua franca of the Western world, influencing numerous modern languages.
Roman architecture and engineering achievements were monumental. They perfected the arch, vault, and dome, constructing enduring structures like the Colosseum, Pantheon, and aqueducts. These engineering marvels not only showcased Roman ingenuity but also served practical purposes, from public entertainment to water supply.
Solid waste management & Types of Basic civil Engineering notes by DJ Sir.pptxDenish Jangid
Solid waste management & Types of Basic civil Engineering notes by DJ Sir
Types of SWM
Liquid wastes
Gaseous wastes
Solid wastes.
CLASSIFICATION OF SOLID WASTE:
Based on their sources of origin
Based on physical nature
SYSTEMS FOR SOLID WASTE MANAGEMENT:
METHODS FOR DISPOSAL OF THE SOLID WASTE:
OPEN DUMPS:
LANDFILLS:
Sanitary landfills
COMPOSTING
Different stages of composting
VERMICOMPOSTING:
Vermicomposting process:
Encapsulation:
Incineration
MANAGEMENT OF SOLID WASTE:
Refuse
Reuse
Recycle
Reduce
FACTORS AFFECTING SOLID WASTE MANAGEMENT:
This is a presentation by Dada Robert in a Your Skill Boost masterclass organised by the Excellence Foundation for South Sudan (EFSS) on Saturday, the 25th and Sunday, the 26th of May 2024.
He discussed the concept of quality improvement, emphasizing its applicability to various aspects of life, including personal, project, and program improvements. He defined quality as doing the right thing at the right time in the right way to achieve the best possible results and discussed the concept of the "gap" between what we know and what we do, and how this gap represents the areas we need to improve. He explained the scientific approach to quality improvement, which involves systematic performance analysis, testing and learning, and implementing change ideas. He also highlighted the importance of client focus and a team approach to quality improvement.
Extraction Of Natural Dye From Beetroot (Beta Vulgaris) And Preparation Of He...SachinKumar945617
If you want to make , ppt, dissertation/research, project or any document edit service
DM me on what's app 8434381558
E-mail sachingone220@gmail.com
I will take charge depend upon how much pages u want
The Indian economy is classified into different sectors to simplify the analysis and understanding of economic activities. For Class 10, it's essential to grasp the sectors of the Indian economy, understand their characteristics, and recognize their importance. This guide will provide detailed notes on the Sectors of the Indian Economy Class 10, using specific long-tail keywords to enhance comprehension.
For more information, visit-www.vavaclasses.com
The Art Pastor's Guide to Sabbath | Steve ThomasonSteve Thomason
What is the purpose of the Sabbath Law in the Torah. It is interesting to compare how the context of the law shifts from Exodus to Deuteronomy. Who gets to rest, and why?
3. Qualitative Data
Qualitative data is information that represents some characteristics or
attributes. It depicts descriptions that cannot be counted, measured, or easily
expressed with the help of numbers.
It can be collected from audio, text, and pictures. It is shared via data
visualization tools, such as concept maps, clouds, infographics, timelines,
and databases.
For instance, collecting data on attributes such as honesty, intelligence,
creativity, wisdom, and cleanliness about students of any class would be
considered as a sample of qualitative data.
Qualitative data is further categorized into two categories that includes,
• Nominal Data
• Ordinal Data
4. Nominal Data
Nominal data is a type of data that consists of categories or names that
cannot be ordered or ranked. Nominal data is often used to categorize
observations into groups, and the groups are not comparable. In other
words, nominal data has no inherent order or ranking.
Examples of nominal data include gender (Male or female), race (White,
Black, Asian), religion (Hinduism, Christianity, Islam, Judaism), and blood
type (A, B, AB, O).
5. Ordinal Data
Ordinal data is a type of data that consists of categories that can be ordered
or ranked. However, the distance between categories is not necessarily
equal. Ordinal data is often used to measure subjective attributes or
opinions, where there is a natural order to the responses.
Examples of ordinal data include education level (Elementary, Middle, High
School, College), job position (Manager, Supervisor, Employee), etc.
6. Quantitative Data
These types of data can be measured but not simply observed. The data can
be numerically represented and used for statistical analysis and
mathematical calculations.
For example, these mathematical derivations can be used in real-life
decisions. Also, the number of students participate in different games from a
class; the mathematical calculation gives an estimate of how many students
are playing in which sport.
Quantitative data is further classified into two categories that are:
• Discrete Data
• Continuous Data
7. Discrete Data
Discrete data type is a type of data in statistics that only uses Discrete Value
or Single Values. These data types have values that can be easily counted as
whole numbers.
The example of the discrete data types is:
• Height of Students in a class
• Marks of the students in a class test
• Weight of different members of a family, etc.
8. Continuous Data
Continuous data is the type of quantitative data that represent the data in a
continuous range. The variable in the data set can have any value between
the range of the data set.
Examples of the continuous data types are:
• Temperature Range
• Salary range of Workers in a Factory, etc.
10. Structured Data
• Structured data refers to data that is organized and formatted in a specific
way to make it easily readable and understandable by both humans and
machines. This is typically achieved by a well-defined schema or data
model, which provides a structure for the data.
• Structured data is typically found in databases and spreadsheets and is
characterized by its organized nature. Each data element is typically
assigned a specific field or column in the schema, and each record or row
represents a specific instance of that data. For example, in a customer
database, each record might contain fields for the customer’s name,
address, phone number, and email address.
11. Semi structured Data
Semi-structured data is a type of data that is not purely structured, but also
not completely unstructured. It contains some level of organization or
structure but does not conform to a rigid schema or data model, and may
contain elements that are not easily categorized or classified.
1. Semi-structured data is typically characterized by the use of metadata or
tags that provide additional information about the data elements. For
example, an XML document might contain tags that indicate the structure
of the document but may also contain additional tags that provide
metadata about the content, such as author, date, or keywords.
2. Other examples of semi-structured data include JSON, which is
commonly used for exchanging data between web applications, and log
files, which often contain a mix of structured and unstructured data.
12. Unstructured data
Unstructured data is the data which does not conforms to a data model and
has no easily identifiable structure such that it can not be used by a
computer program easily.
Example: Text documents, image data