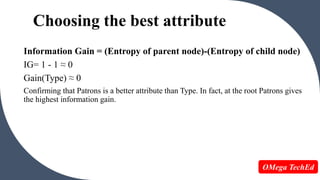
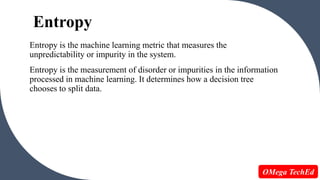
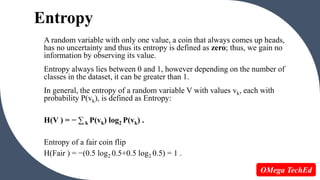
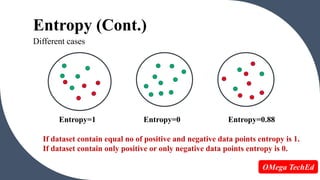
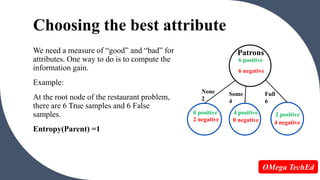
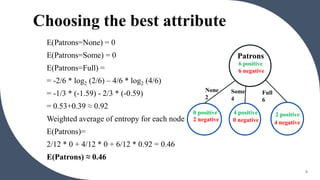
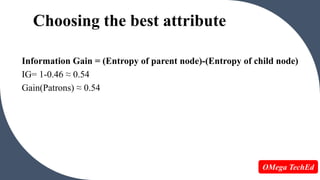
Entropy is a measure of unpredictability or impurity in a data set. It is used in decision trees to determine the best way to split data at each node. High entropy means low purity with an equal mix of classes, while low entropy means high purity with mostly one class. Information gain is the reduction in entropy when splitting on an attribute, with the attribute with the highest information gain chosen as the split. For example, in a data set on restaurant patrons, splitting on the "patrons" attribute results in a higher information gain than splitting on "type of food" so "patrons" would be chosen as the root node.
2. Entropy
Entropy is the machine learning metric that measures the
unpredictability or impurity in the system.
Entropy is the measurement of disorder or impurities in the information
processed in machine learning. It determines how a decision tree
chooses to split data.
2
High Entropy
Low Entropy
OMega TechEd
3. Entropy
A random variable with only one value, a coin that always comes up heads,
has no uncertainty and thus its entropy is defined as zero; thus, we gain no
information by observing its value.
Entropy always lies between 0 and 1, however depending on the number of
classes in the dataset, it can be greater than 1.
In general, the entropy of a random variable V with values vk, each with
probability P(vk), is defined as Entropy:
H(V ) = − ∑ k P(vk) log2 P(vk) .
Entropy of a fair coin flip
H(Fair ) = −(0.5 log2 0.5+0.5 log2 0.5) = 1 .
3
OMega TechEd
4. How to calculate Entropy?
H(V ) = − ∑ k P(vk) log2 P(vk) .
Example:
If we had a total 10 data points in our dataset with 3 belonging to positive
class and 7 belonging to negative class:
-3/10 * log2 (3/10) – 7/10 * log2 (7/10) ≈ 0.876
The Entropy is approximately 0.88 .
High entropy means low level of purity.
4
OMega TechEd
5. Entropy (Cont.)
Different cases
5
Entropy=0
Entropy=1 Entropy=0.88
If dataset contain equal no of positive and negative data points entropy is 1.
If dataset contain only positive or only negative data points entropy is 0.
OMega TechEd
6. Information Gain
Information gain is defined as the pattern observed in the dataset and
reduction in the entropy.
Mathematically, information gain can be expressed with the below formula:
Information Gain = (Entropy of parent node)-(Entropy of child node)
6
OMega TechEd
7. Decision tree using information gain
1. An attribute with the highest information gain from a set should be
selected as the parent (root) node.
2. Build child nodes for every value of attribute A.
3. Repeat iteratively until we finish constructing the whole tree.
7
OMega TechEd
8. Choosing the best attribute
We need a measure of “good” and “bad” for
attributes. One way to do is to compute the
information gain.
Example:
At the root node of the restaurant problem,
there are 6 True samples and 6 False
samples.
Entropy(Parent) =1
8
6 positive
6 negative
2 negative
4 positive 2 positive
4 negative
None
2
Some
4
Full
6
0 positive
0 negative
Patrons
OMega TechEd
10. Choosing the best attribute
10
Information Gain = (Entropy of parent node)-(Entropy of child node)
IG= 1-0.46 ≈ 0.54
Gain(Patrons) ≈ 0.54
OMega TechEd
11. Choosing the best attribute
E(Type=French) = 1
E(Type=Italian) = 1
E(Type=Thai) = 1
E(Type=Burger) =1
Weighted average of entropy for each node
E(Type)=
[2/12 * 1 + 2/12 * 1 + 4/12 * 1 + 4/12 *1]
= 1
E(Type) ≈ 1
11
6 positive
6 negative
2 positive
2 negative
French
2
Italian
2
Thai
4
1 negative
1 positive
1 positive
1 negative
Burger
4
2 positive
2 negative
Type
OMega TechEd
12. Choosing the best attribute
12
Information Gain = (Entropy of parent node)-(Entropy of child node)
IG= 1 - 1 ≈ 0
Gain(Type) ≈ 0
Confirming that Patrons is a better attribute than Type. In fact, at the root Patrons gives
the highest information gain.
OMega TechEd