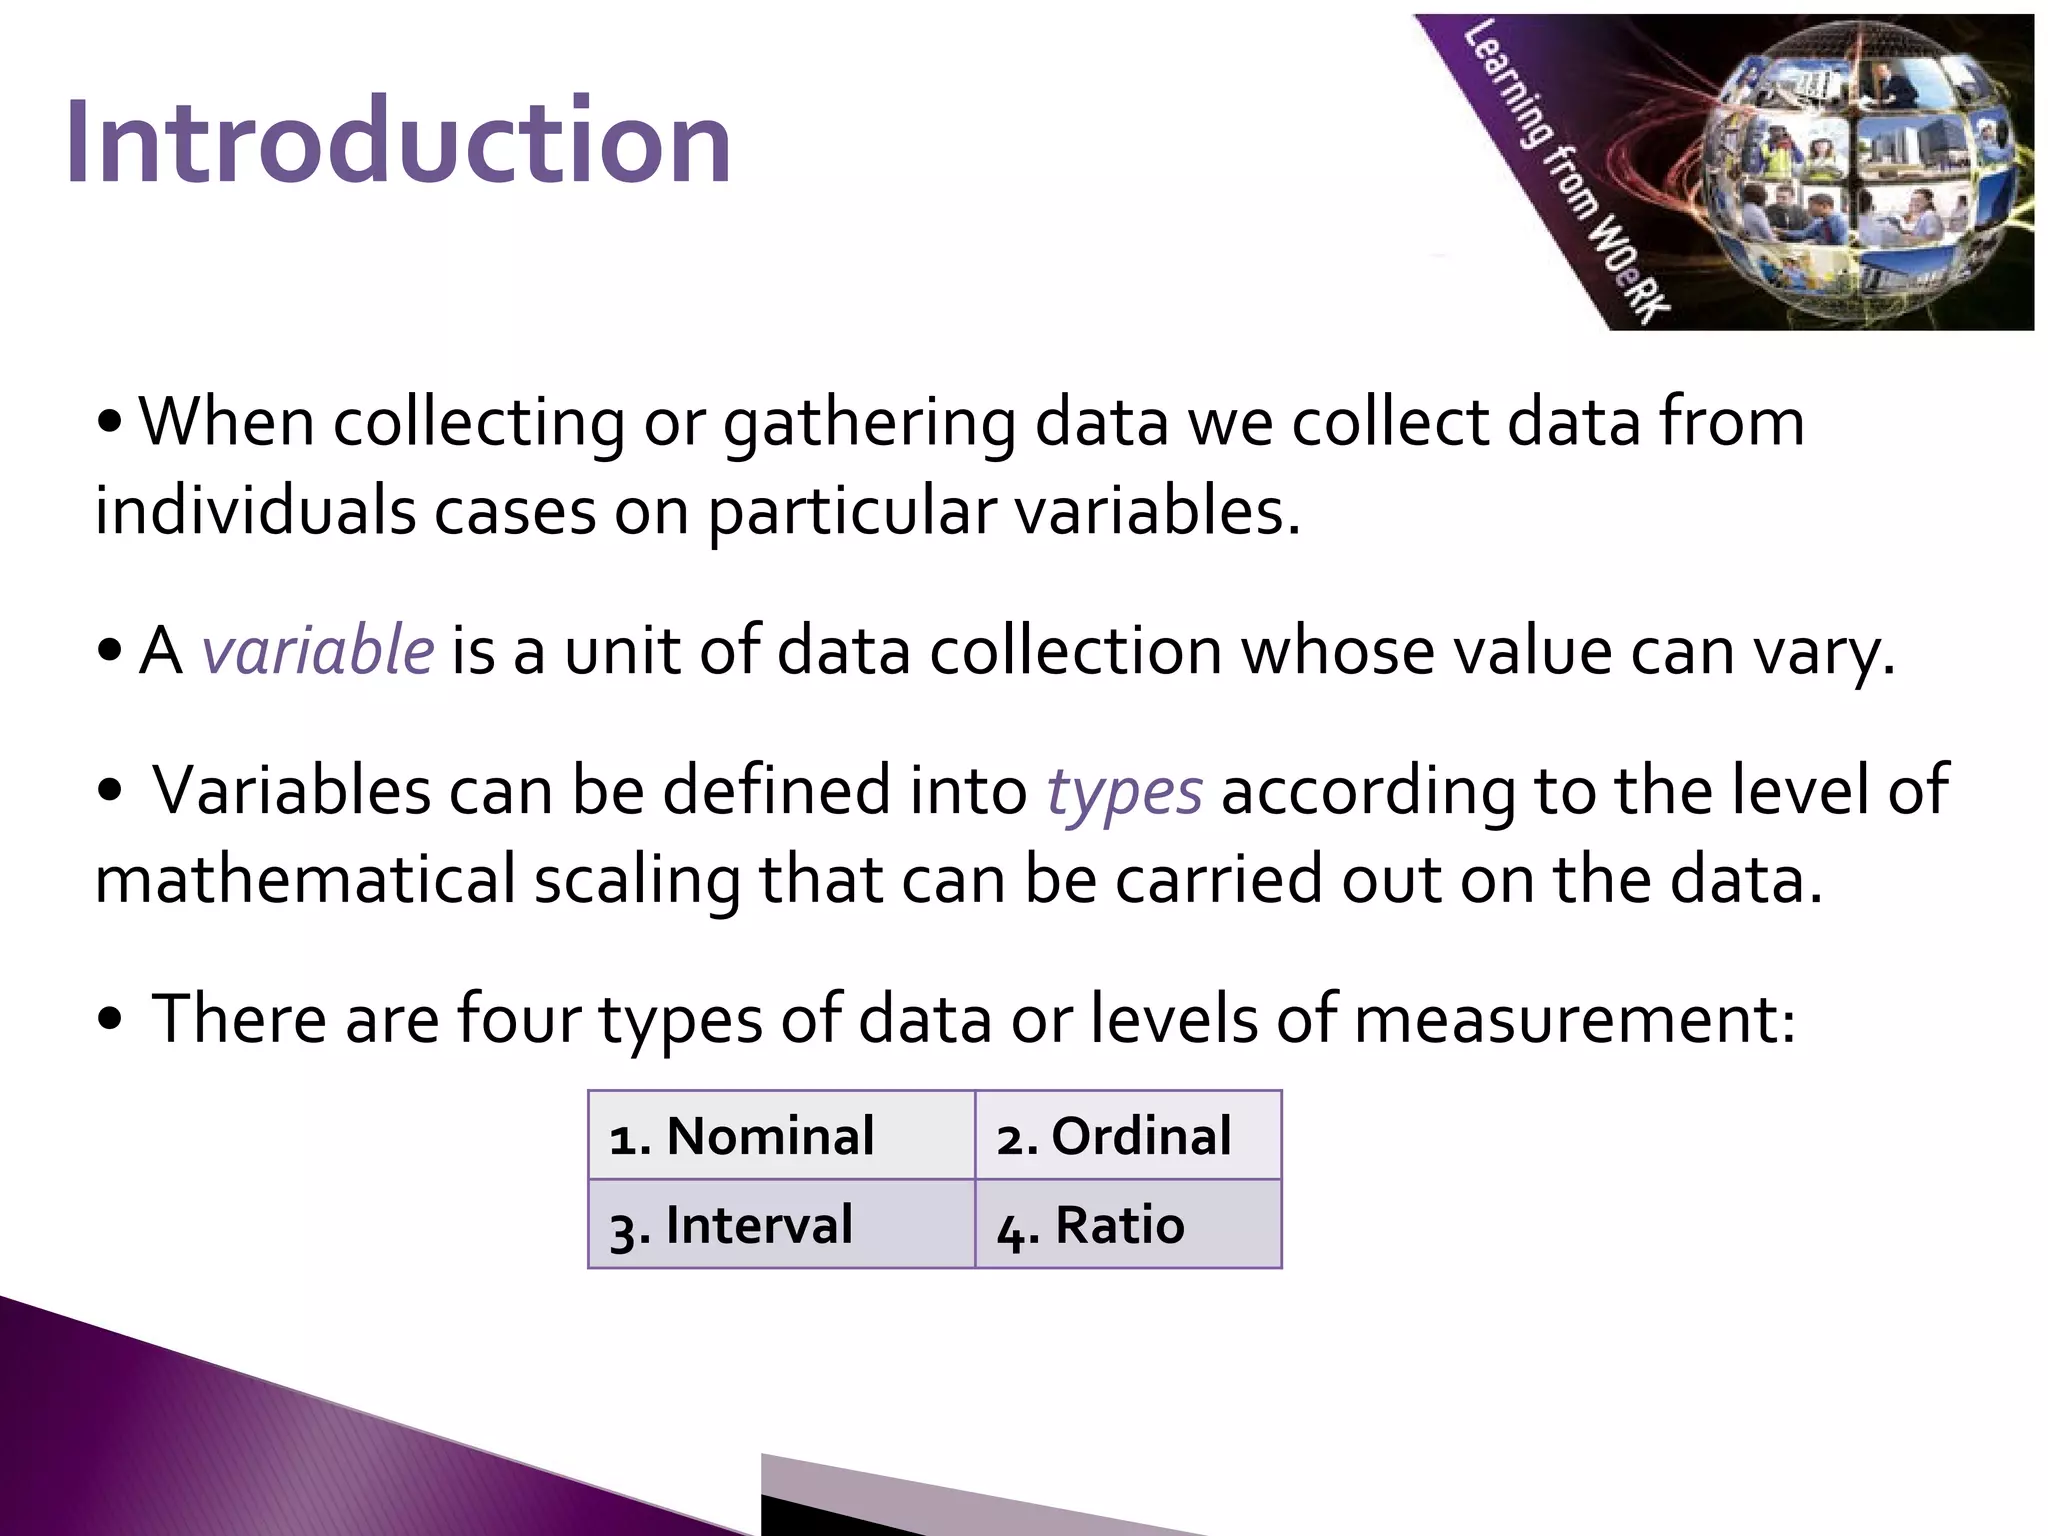
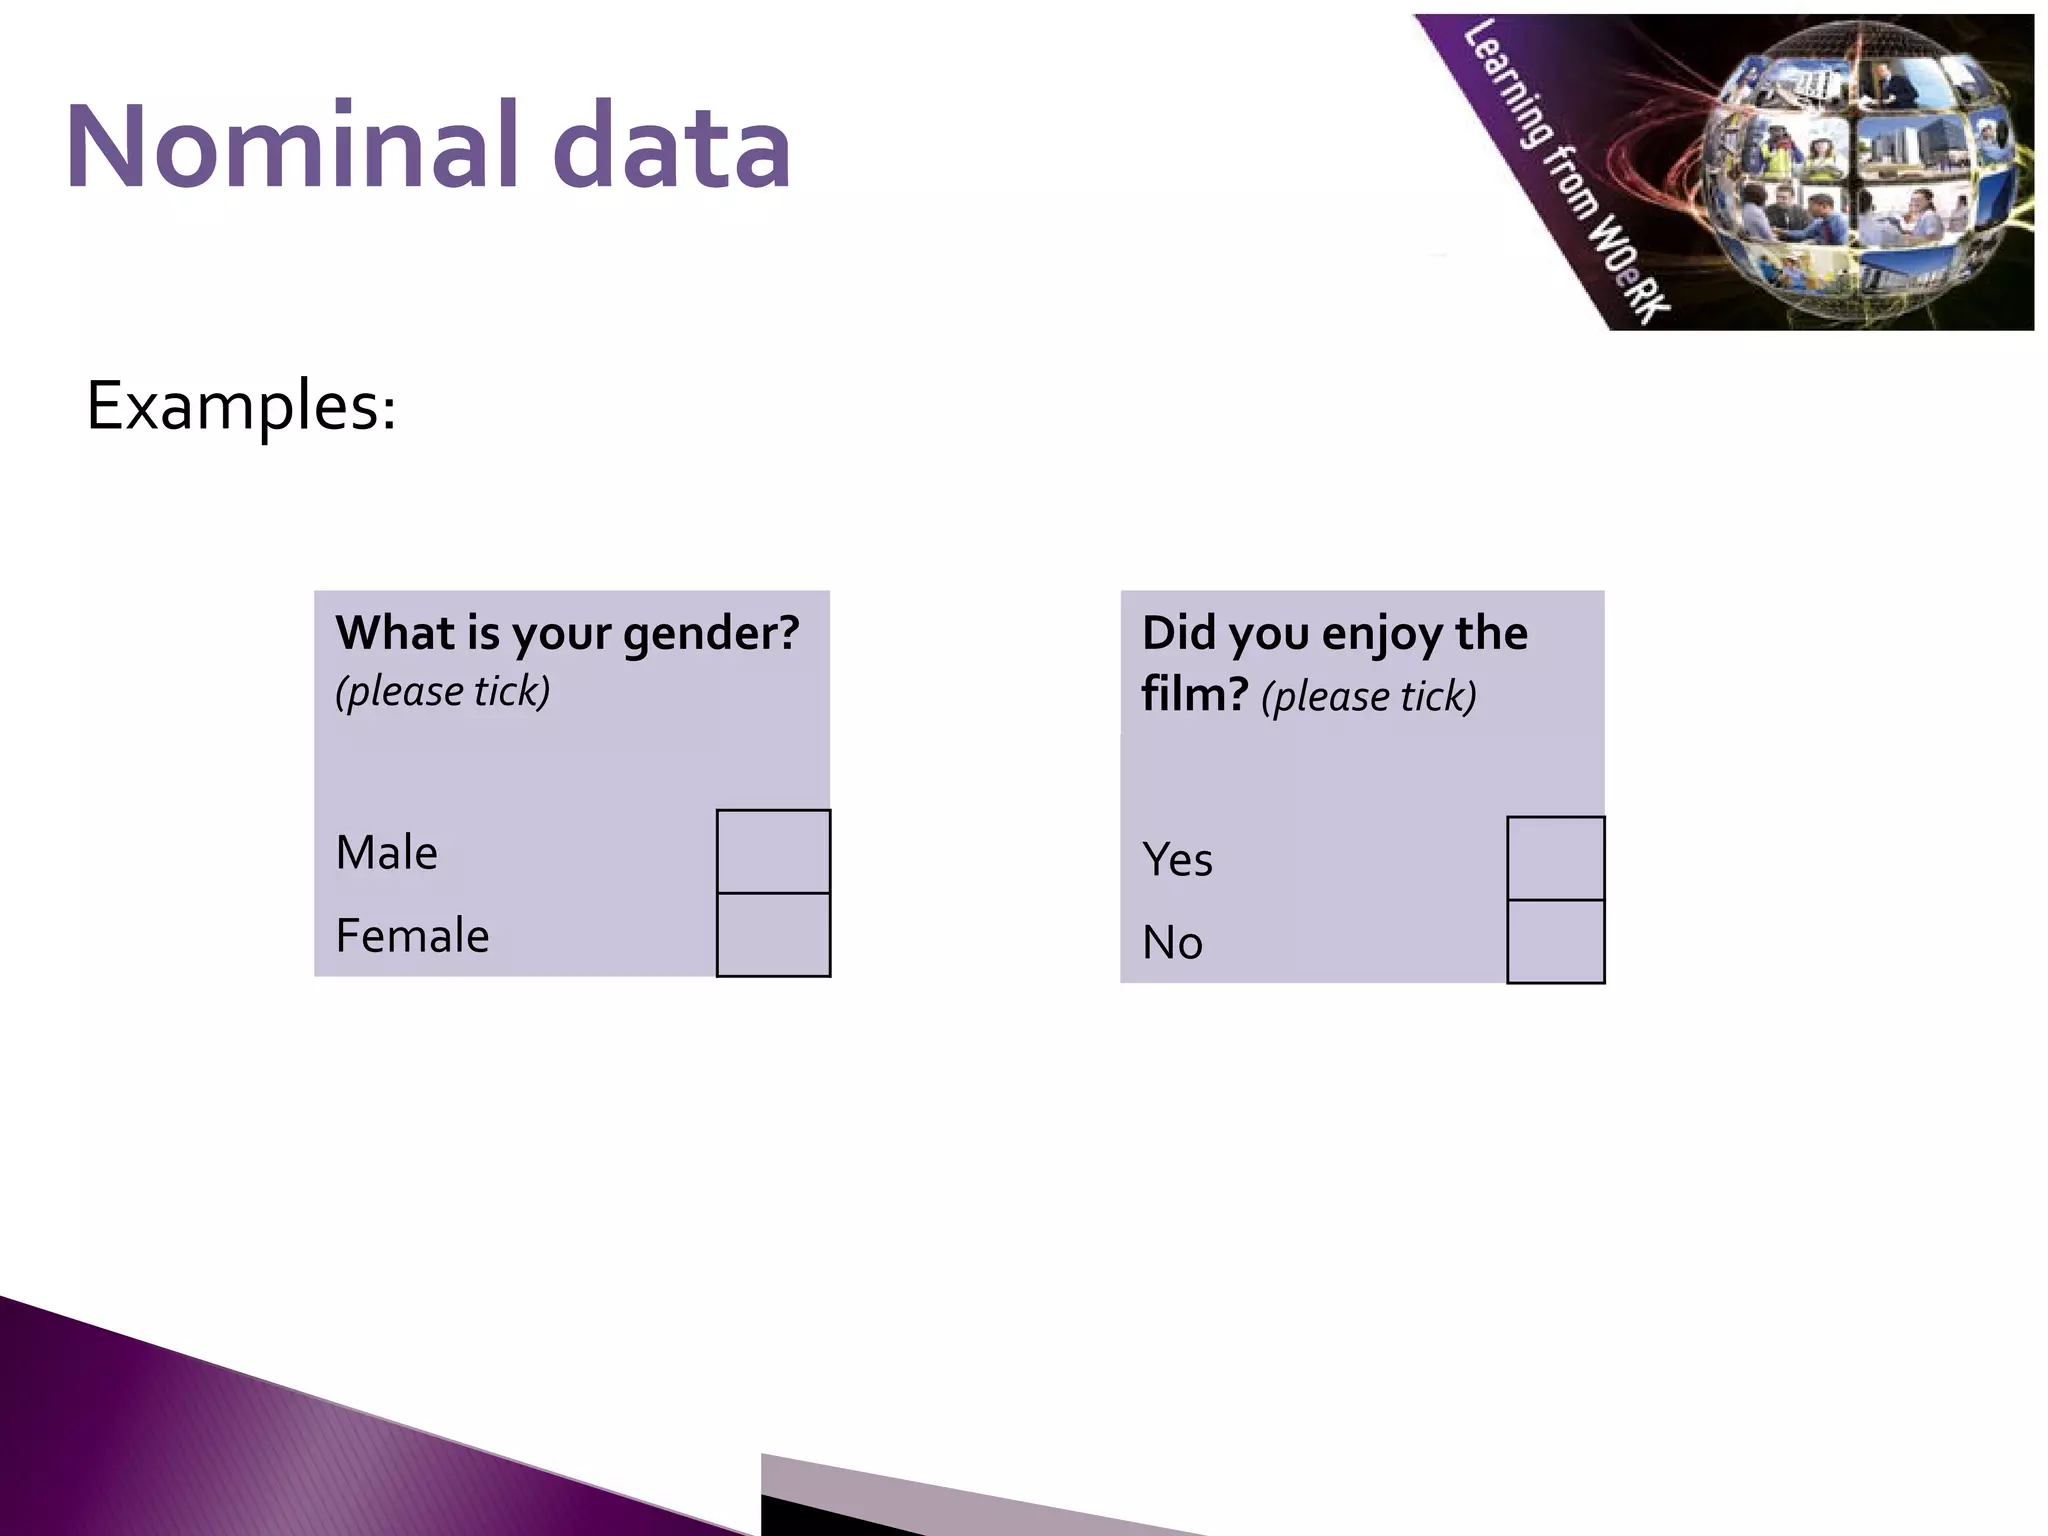
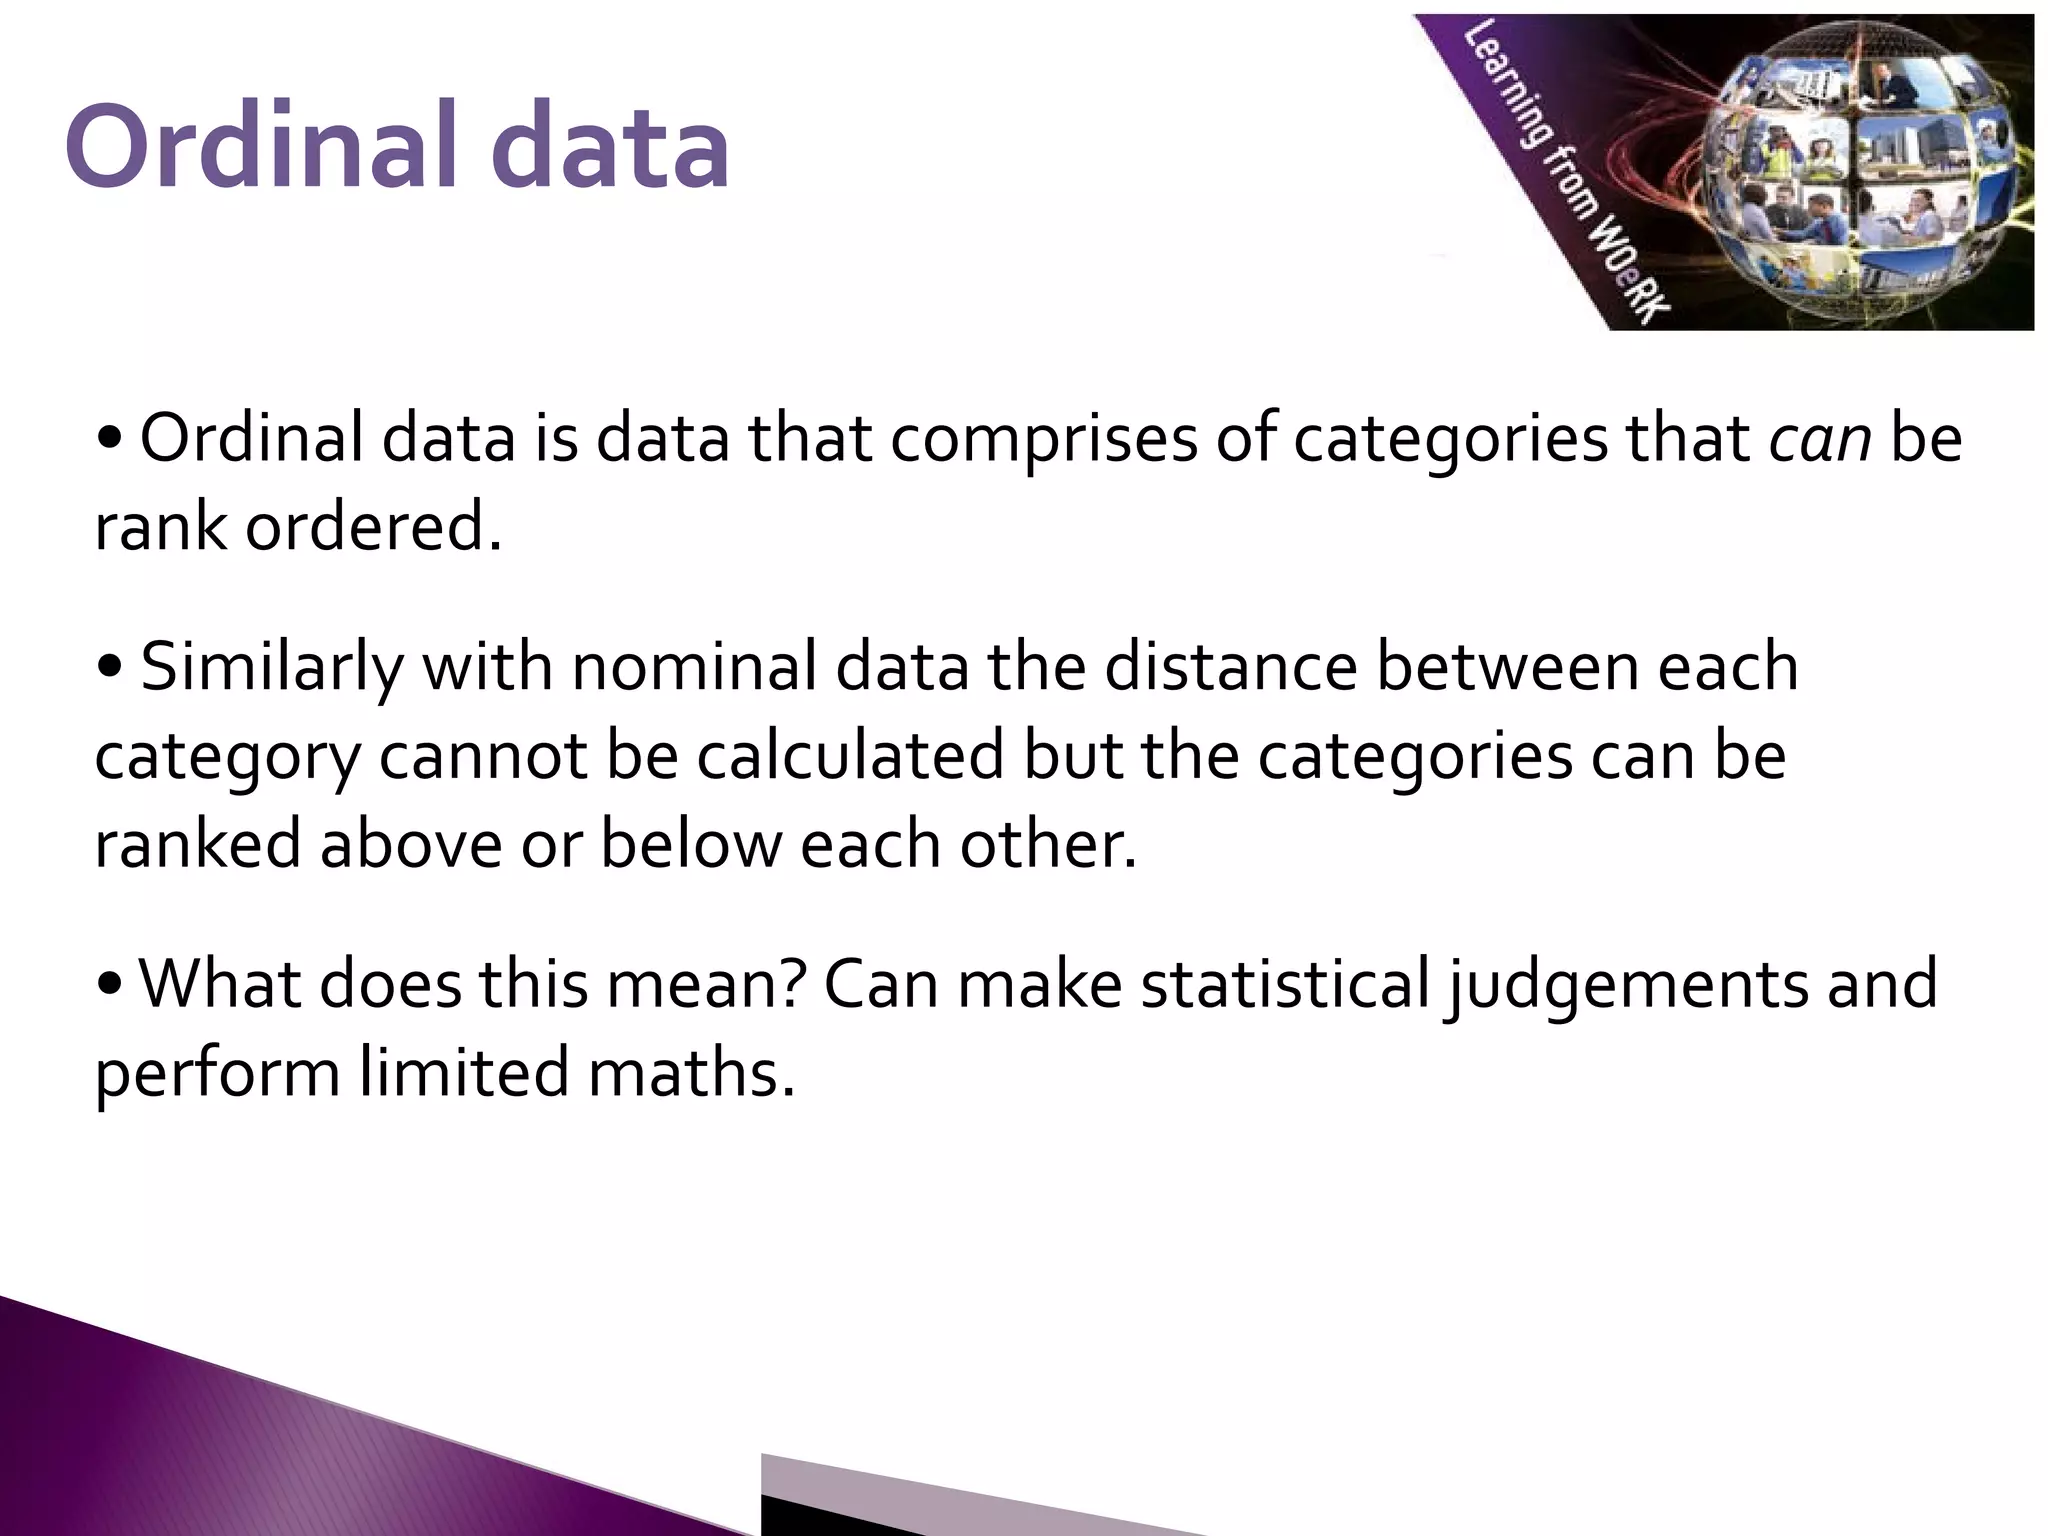
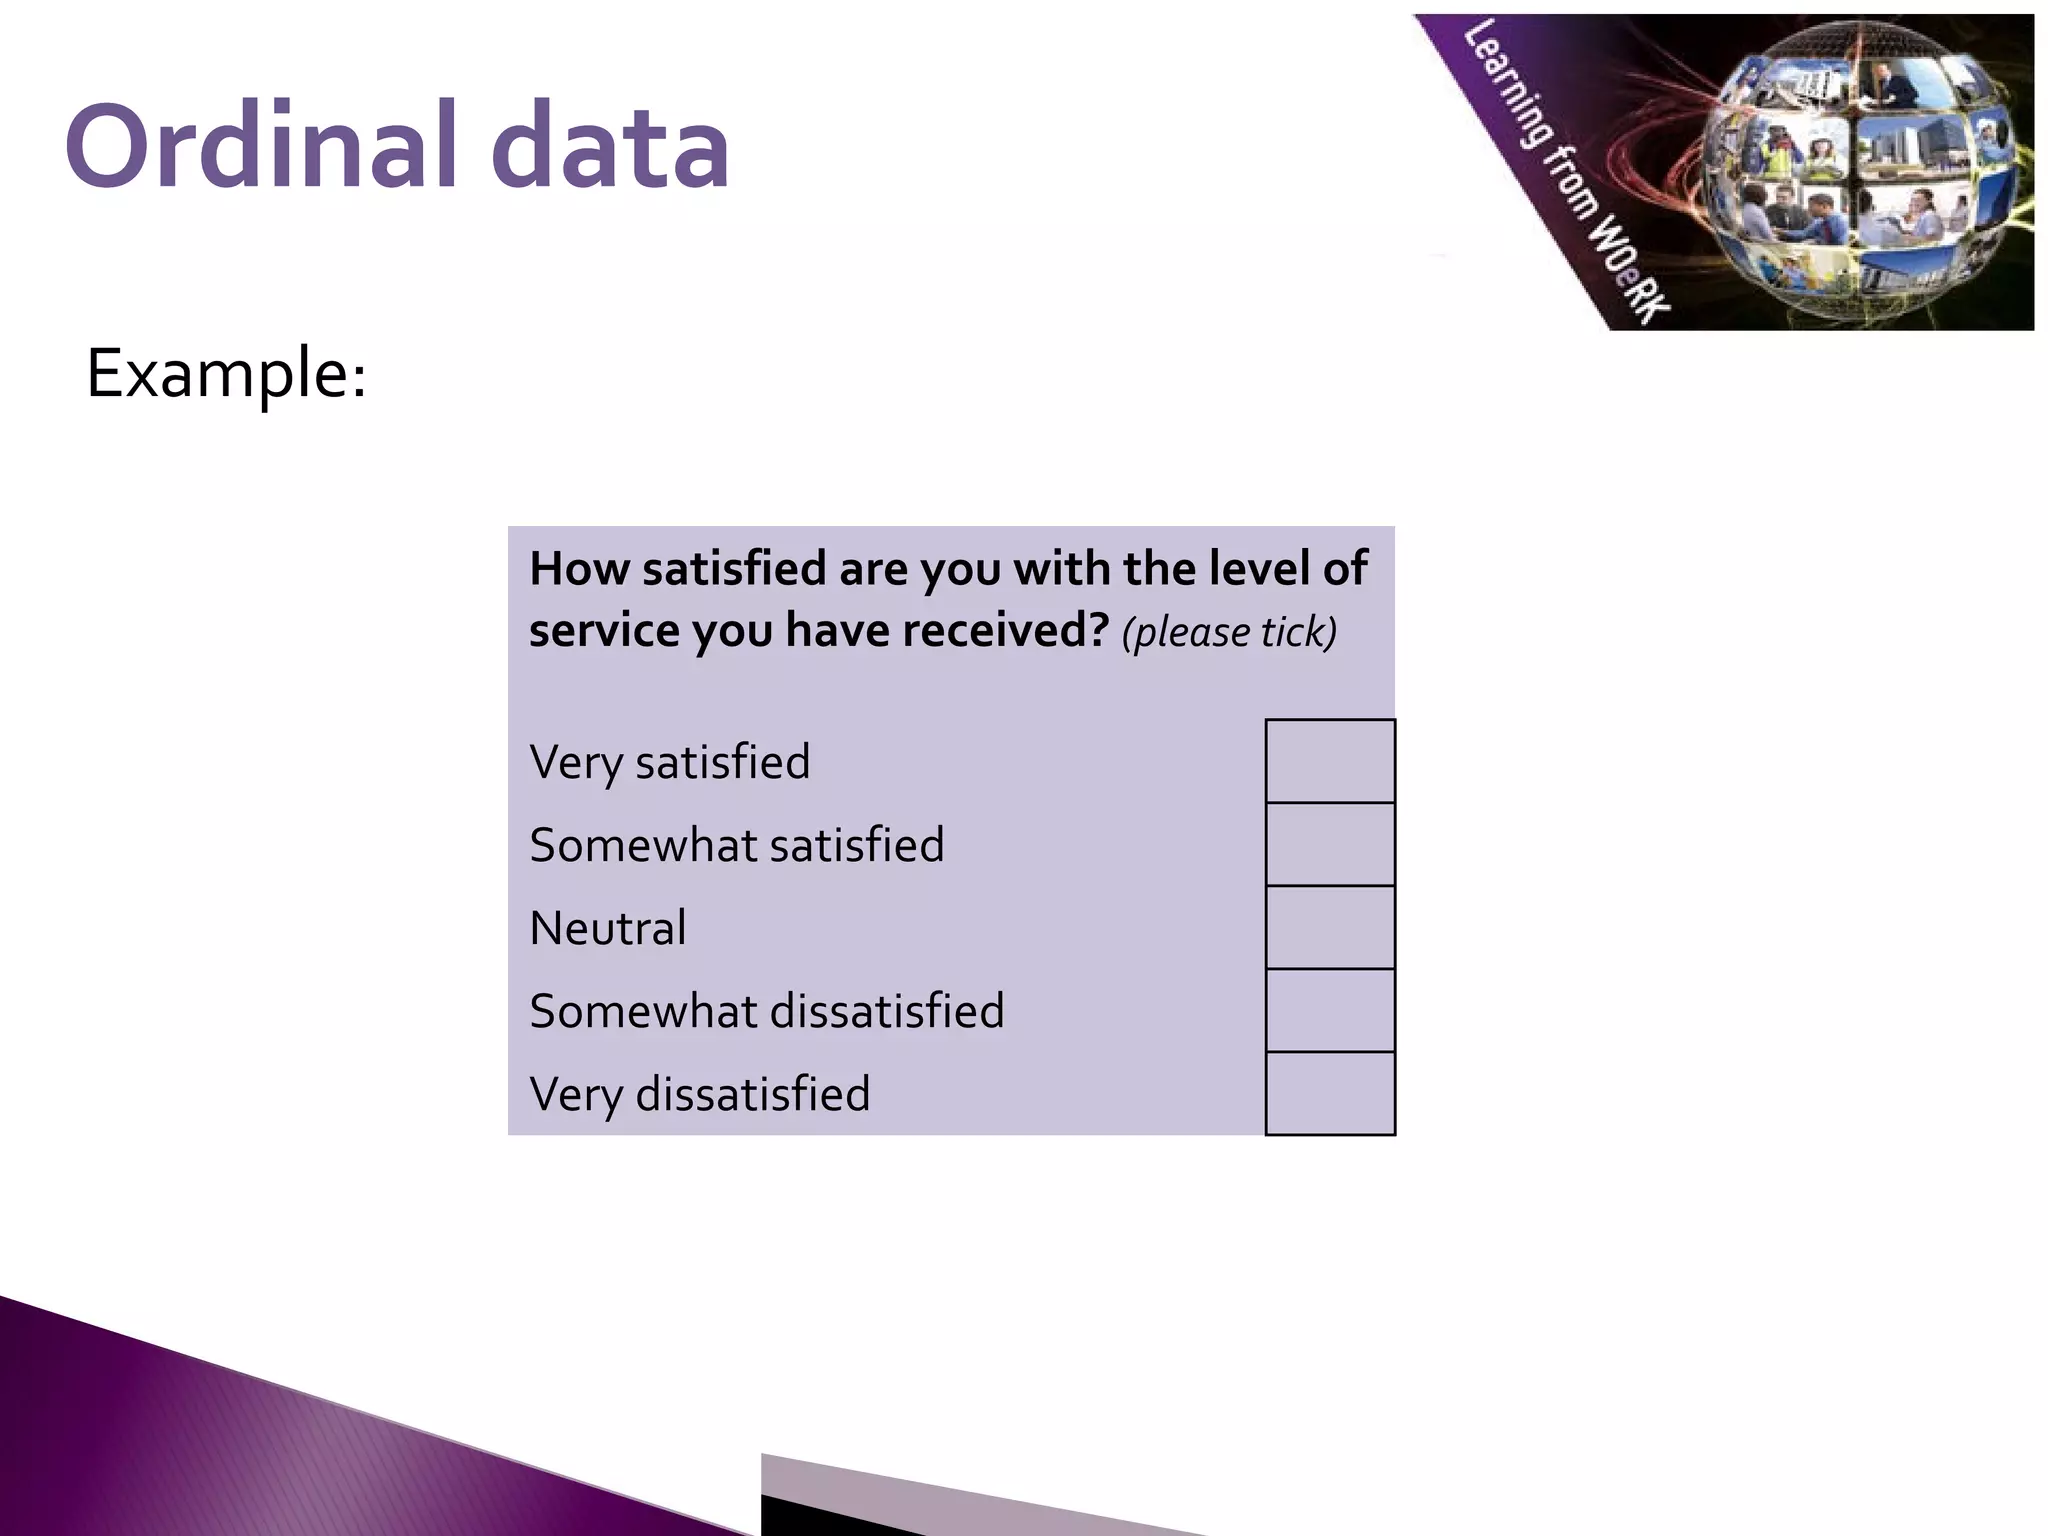
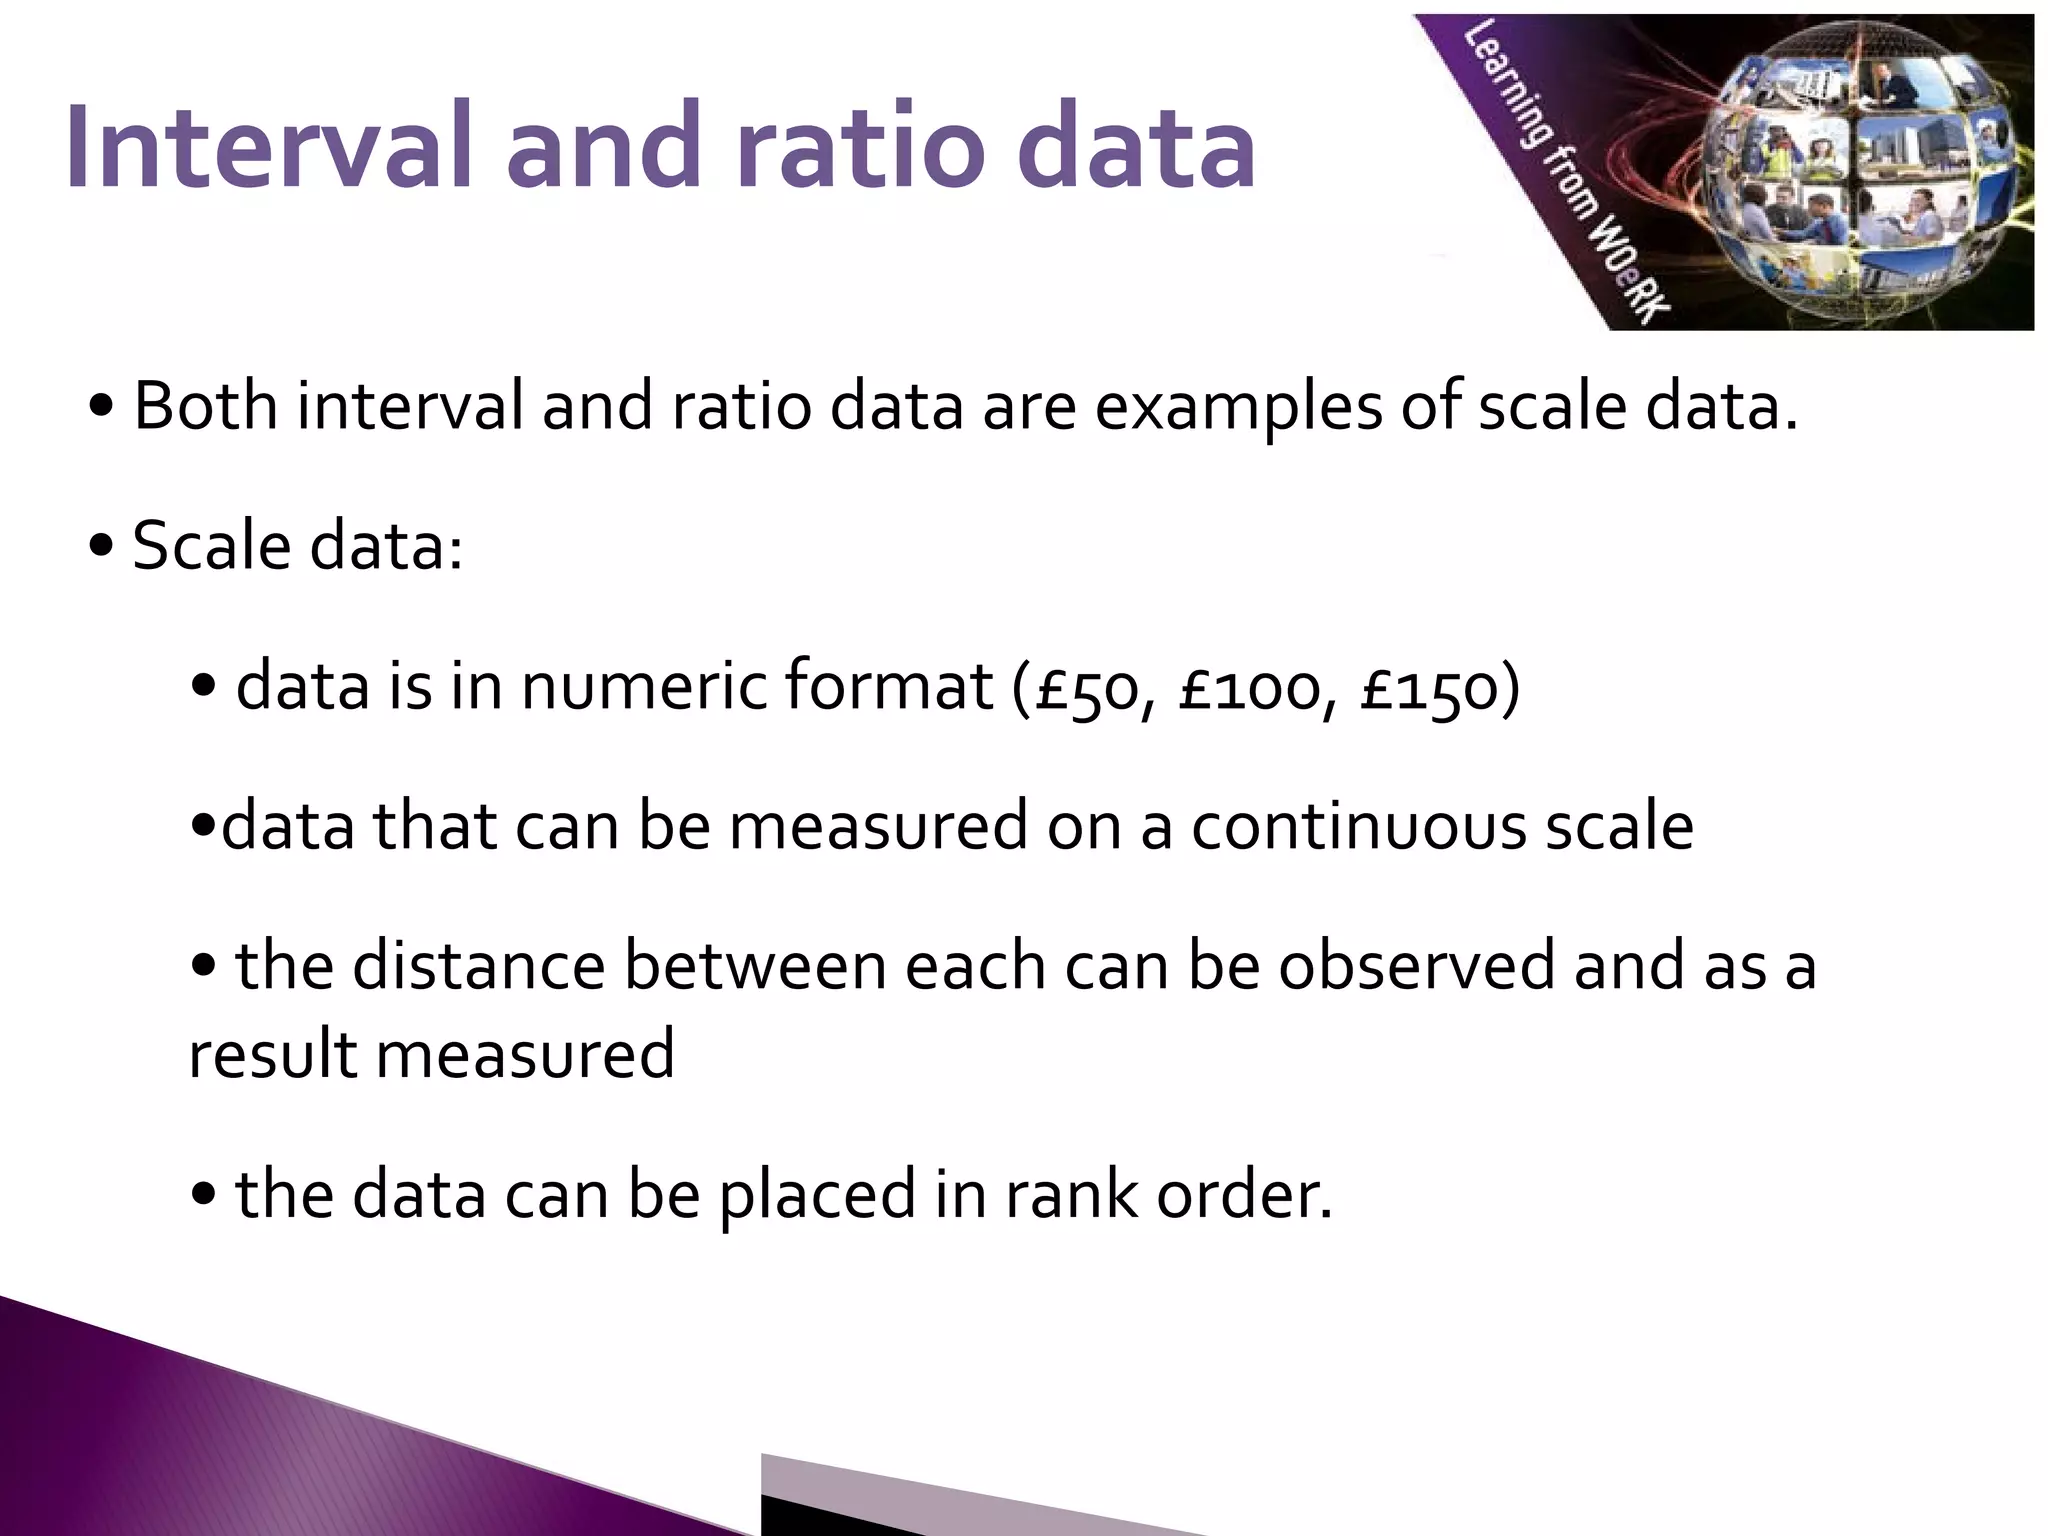
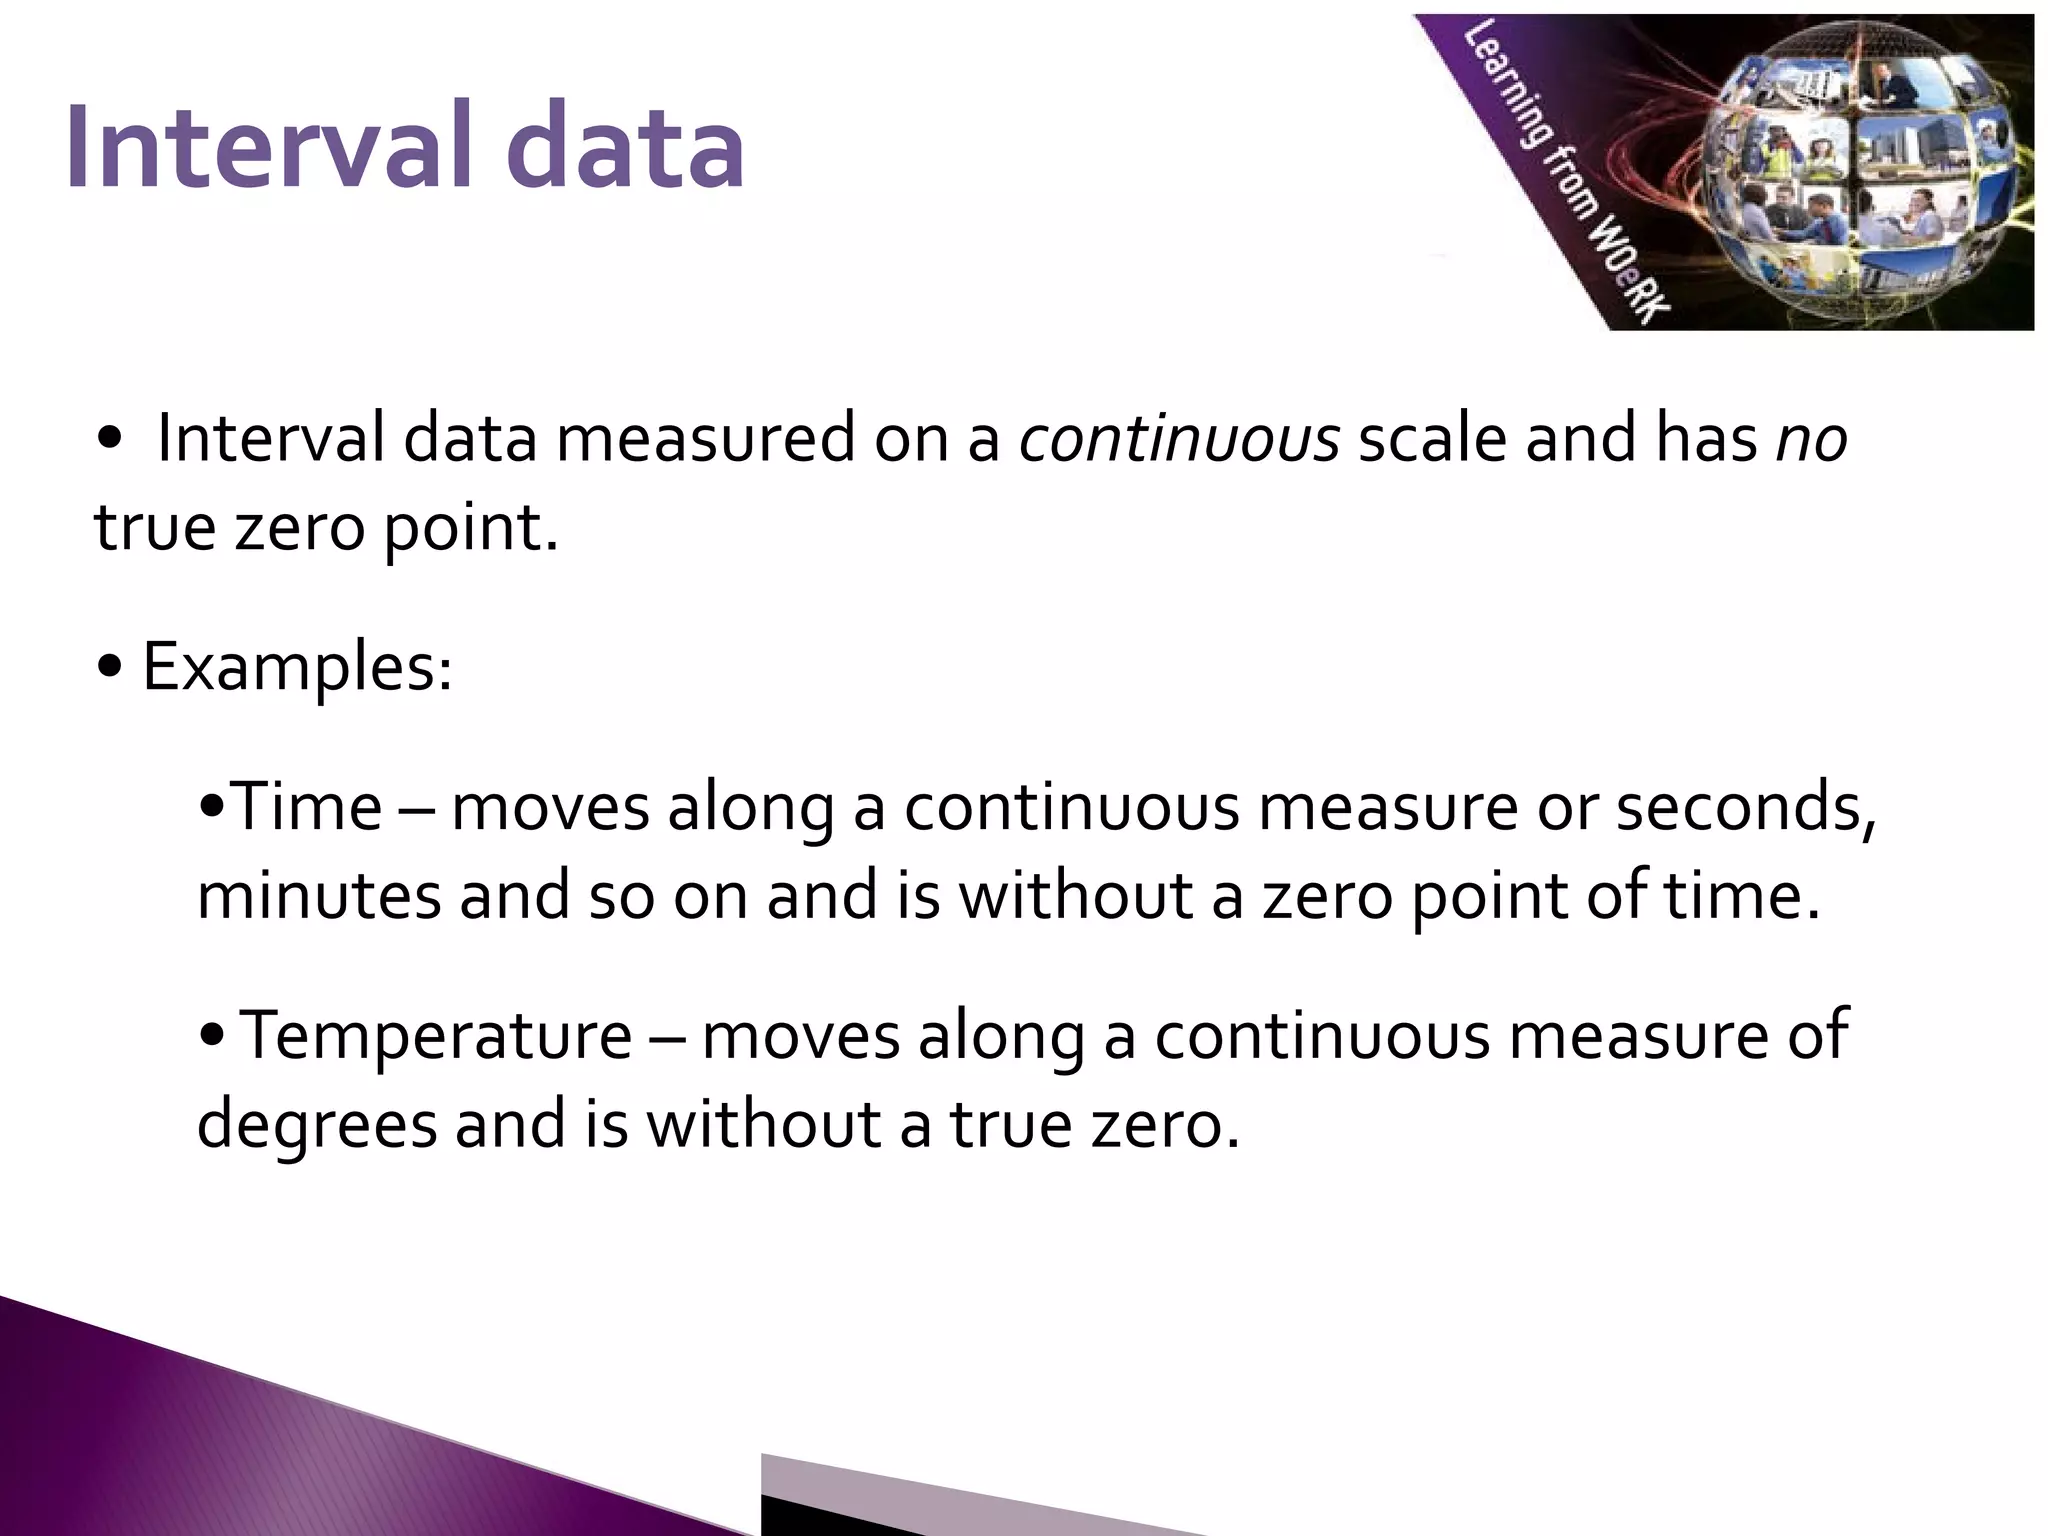
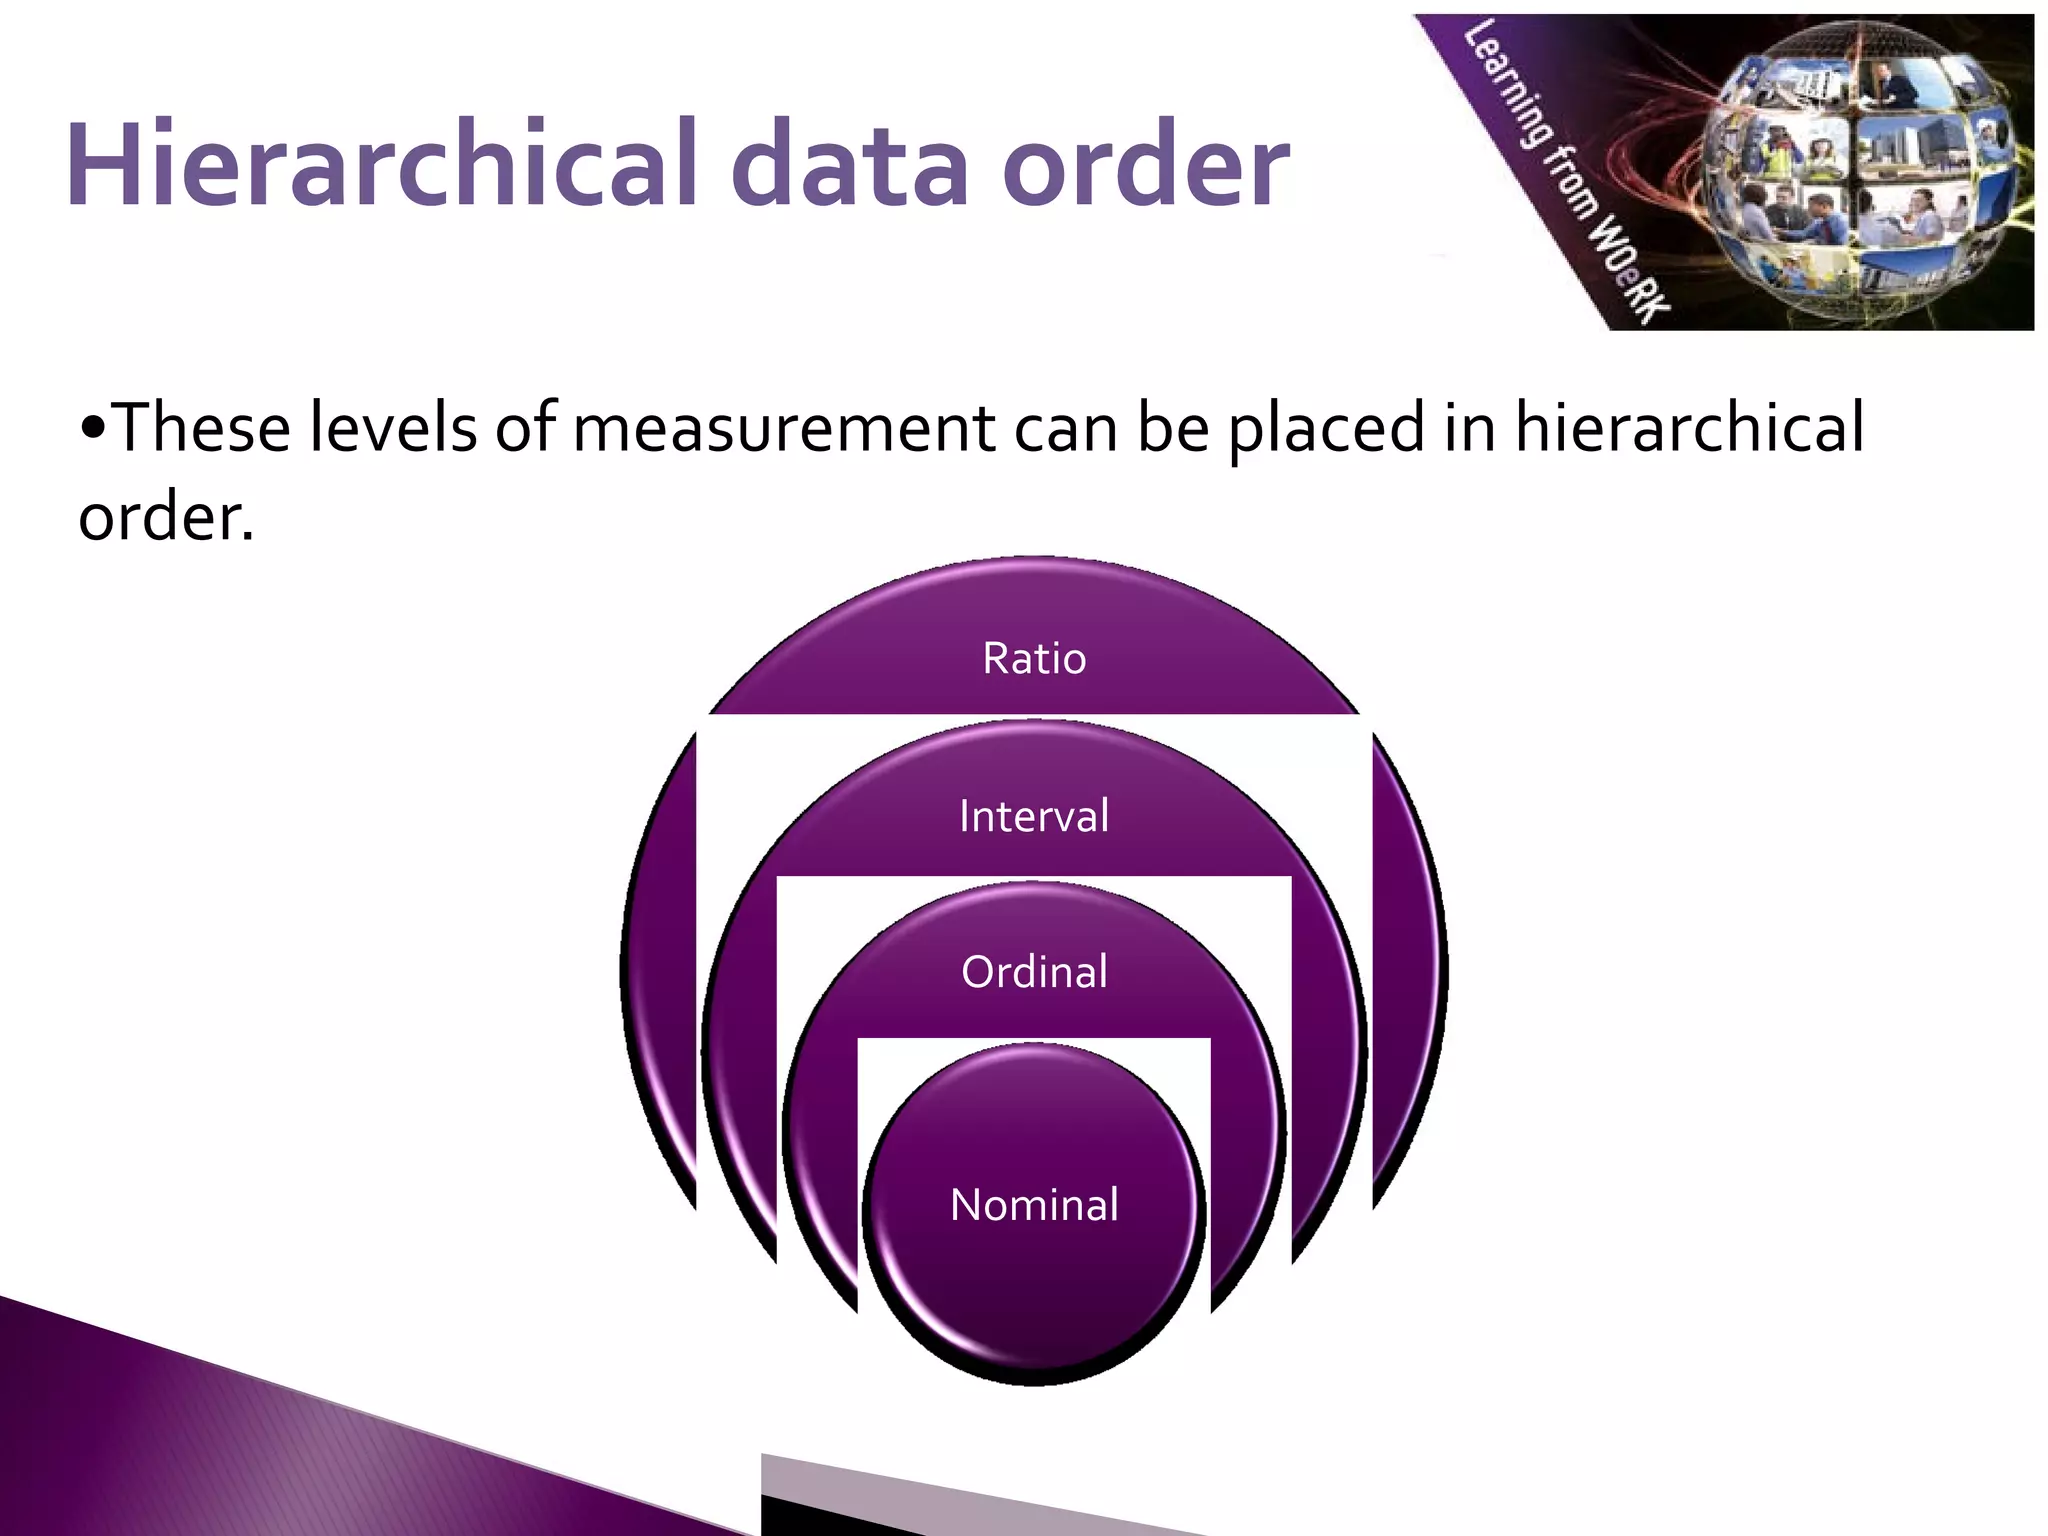
Numeracy & Quantitative Methods:
Numeracy for Professional Purposes
Laura Lake
•When collecting or gathering data we collect data from
individuals cases on particular variables.
• A variable is a unit of data collection whose value can vary.
• Variables can be defined into types according to the level of
mathematical scaling that can be carried out on the data.
• There are four types of data or levels of measurement:
Introduction
Introduction
1. Nominal 2. Ordinal
3. Interval 4. Ratio
• Nominal or categorical data is data that comprises of categories
that cannot be rank ordered – each category is just different.
•The categories available cannot be placed in any order and no
judgement can be made about the relative size or distance from
one category to another.
•What does this mean? No mathematical operations can be
performed on the data relative to each other.
•Therefore, nominal data reflect qualitative differences rather
than quantitative ones.
Nominal data
Nominal data
Examples:
Nominal data
Nominal data
What is your gender?
(please tick)
Male
Female
Did you enjoy the
film? (please tick)
Yes
No
•Systems for measuring nominal data must ensure that each
category is mutually exclusive and the system of
measurement needs to be exhaustive.
• Variables that have only two responses i.e.Yes or No, are
known as dichotomies.
Nominal data
Nominal data
• Ordinal data is data that comprises of categories that can be
rank ordered.
• Similarly with nominal data the distance between each
category cannot be calculated but the categories can be
ranked above or below each other.
•What does this mean? Can make statistical judgements and
perform limited maths.
Ordinal data
Ordinal data
Example:
Ordinal data
Ordinal data
How satisfied are you with the level of
service you have received? (please tick)
Very satisfied
Somewhat satisfied
Neutral
Somewhat dissatisfied
Very dissatisfied
• Both interval and ratio data are examples of scale data.
• Scale data:
• data is in numeric format (£50, £100, £150)
•data that can be measured on a continuous scale
• the distance between each can be observed and as a
result measured
• the data can be placed in rank order.
Interval and ratio data
• Interval data measured on a continuous scale and has no
true zero point.
• Examples:
•Time – moves along a continuous measure or seconds,
minutes and so on and is without a zero point of time.
•Temperature – moves along a continuous measure of
degrees and is without a true zero.
Interval data
Interval data
• Ratio data measured on a continuous scale and does have a
true zero point.
• Examples:
• Age
•Weight
• Height
Ratio data
Ratio data
•These levels of measurement can be placed in hierarchical
order.
Hierarchical data order
Ratio
Interval
Ordinal
Nominal
• Nominal data is the least complex and give a simple measure
of whether objects are the same or different.
• Ordinal data maintains the principles of nominal data but
adds a measure of order to what is being observed.
• Interval data builds on ordinal by adding more information
on the range between each observation by allowing us to
measure the distance between objects.
• Ratio data adds to interval with including an absolute zero.
Hierarchical data order
• Knowing the hierarchy of data is useful.
•Why? It is possible to recode or adjust certain types of data
into others.
• Can go from most complex (interval and ratio) to least
complex (nominal) but cannot go the other way around.
• Interval/ratio can be re-formatted to become ordinal or
nominal, ordinal can become nominal.
Hierarchical data order
• Example: salary data for is often recorded as interval data
(i.e. just a number).
•Why? Because it can then be analysed in many ways:
• Any mathematical operation e.g. average salary
• reformatted into ordinal or nominal data e.g. salary
bands (£10,000 to £14,999, £15,000 to £19,999)
Hierarchical data order
• If salary data is collected as an ordinal variable i.e. in salary
bands, then it becomes impossible to perform mathematical
operations such as finding the average salary.
• So, if possible data such as this should be collected as scale
data and these issues should be thought about at the research
design stage.
Hierarchical data order
• Why do we need to know what type of data we are dealing
with?
•The data type or level of measurement influences the type of
statistical analysis techniques that can be used when
analysing data.
• See the next set of lectures on descriptive statistics.
Data types
Data types –
– important?
important?
Bryman,A. (2008) Social Research Methods. 3rd Ed. Oxford: Oxford
University Press.
David, M. and Sutton, C. (2011) Social Research : An Introduction.
2nd ed. London: Sage.
References
References
This resource was created by the University of Plymouth, Learning fromWOeRk project. This project is funded by HEFCE
as part of the HEA/JISC OER release programme.
This resource is licensed under the terms of the Attribution-Non-Commercial-ShareAlike 2.0 UK: England
&Wales license (http://creativecommons.org/licenses/by-nc-sa/2.0/uk/).
The resource, where specified below, contains other 3rd party materials under their own licenses.The licenses
and attributions are outlined below:
1. The name of the University of Plymouth and its logos are unregistered trade marks of the University. The University reserves all rights
to these items beyond their inclusion in these CC resources.
2. The JISC logo, the and the logo of the Higher Education Academy are licensed under the terms of the Creative Commons Attribution
-non-commercial-No Derivative Works 2.0 UK England & Wales license. All reproductions must comply with the terms of that license.
Author Laura Lake
Institute University of Plymouth
Title
Numeracy & Quantitative Methods
Numeracy for Professional Purposes
Description Overview of data types
Date Created May 2011
Educational Level Level 4
Keywords
Variable, nominal, ordinal, interval, ratio, mutually exclusive, exhaustive,
hierarchical order, dichotomies.
Back page originally developed by the OER phase 1 C-Change project
©University of Plymouth, 2010, some rights reserved

2_Types_of_Data.pdf

  • 1.
    Numeracy & QuantitativeMethods: Numeracy for Professional Purposes Laura Lake
  • 2.
    •When collecting orgathering data we collect data from individuals cases on particular variables. • A variable is a unit of data collection whose value can vary. • Variables can be defined into types according to the level of mathematical scaling that can be carried out on the data. • There are four types of data or levels of measurement: Introduction Introduction 1. Nominal 2. Ordinal 3. Interval 4. Ratio
  • 3.
    • Nominal orcategorical data is data that comprises of categories that cannot be rank ordered – each category is just different. •The categories available cannot be placed in any order and no judgement can be made about the relative size or distance from one category to another. •What does this mean? No mathematical operations can be performed on the data relative to each other. •Therefore, nominal data reflect qualitative differences rather than quantitative ones. Nominal data Nominal data
  • 4.
    Examples: Nominal data Nominal data Whatis your gender? (please tick) Male Female Did you enjoy the film? (please tick) Yes No
  • 5.
    •Systems for measuringnominal data must ensure that each category is mutually exclusive and the system of measurement needs to be exhaustive. • Variables that have only two responses i.e.Yes or No, are known as dichotomies. Nominal data Nominal data
  • 6.
    • Ordinal datais data that comprises of categories that can be rank ordered. • Similarly with nominal data the distance between each category cannot be calculated but the categories can be ranked above or below each other. •What does this mean? Can make statistical judgements and perform limited maths. Ordinal data Ordinal data
  • 7.
    Example: Ordinal data Ordinal data Howsatisfied are you with the level of service you have received? (please tick) Very satisfied Somewhat satisfied Neutral Somewhat dissatisfied Very dissatisfied
  • 8.
    • Both intervaland ratio data are examples of scale data. • Scale data: • data is in numeric format (£50, £100, £150) •data that can be measured on a continuous scale • the distance between each can be observed and as a result measured • the data can be placed in rank order. Interval and ratio data Interval and ratio data
  • 9.
    • Interval datameasured on a continuous scale and has no true zero point. • Examples: •Time – moves along a continuous measure or seconds, minutes and so on and is without a zero point of time. •Temperature – moves along a continuous measure of degrees and is without a true zero. Interval data Interval data
  • 10.
    • Ratio datameasured on a continuous scale and does have a true zero point. • Examples: • Age •Weight • Height Ratio data Ratio data
  • 11.
    •These levels ofmeasurement can be placed in hierarchical order. Hierarchical data order Hierarchical data order Ratio Interval Ordinal Nominal
  • 12.
    • Nominal datais the least complex and give a simple measure of whether objects are the same or different. • Ordinal data maintains the principles of nominal data but adds a measure of order to what is being observed. • Interval data builds on ordinal by adding more information on the range between each observation by allowing us to measure the distance between objects. • Ratio data adds to interval with including an absolute zero. Hierarchical data order Hierarchical data order
  • 13.
    • Knowing thehierarchy of data is useful. •Why? It is possible to recode or adjust certain types of data into others. • Can go from most complex (interval and ratio) to least complex (nominal) but cannot go the other way around. • Interval/ratio can be re-formatted to become ordinal or nominal, ordinal can become nominal. Hierarchical data order Hierarchical data order
  • 14.
    • Example: salarydata for is often recorded as interval data (i.e. just a number). •Why? Because it can then be analysed in many ways: • Any mathematical operation e.g. average salary • reformatted into ordinal or nominal data e.g. salary bands (£10,000 to £14,999, £15,000 to £19,999) Hierarchical data order Hierarchical data order
  • 15.
    • If salarydata is collected as an ordinal variable i.e. in salary bands, then it becomes impossible to perform mathematical operations such as finding the average salary. • So, if possible data such as this should be collected as scale data and these issues should be thought about at the research design stage. Hierarchical data order Hierarchical data order
  • 16.
    • Why dowe need to know what type of data we are dealing with? •The data type or level of measurement influences the type of statistical analysis techniques that can be used when analysing data. • See the next set of lectures on descriptive statistics. Data types Data types – – important? important?
  • 17.
    Bryman,A. (2008) SocialResearch Methods. 3rd Ed. Oxford: Oxford University Press. David, M. and Sutton, C. (2011) Social Research : An Introduction. 2nd ed. London: Sage. References References
  • 18.
    This resource wascreated by the University of Plymouth, Learning fromWOeRk project. This project is funded by HEFCE as part of the HEA/JISC OER release programme. This resource is licensed under the terms of the Attribution-Non-Commercial-ShareAlike 2.0 UK: England &Wales license (http://creativecommons.org/licenses/by-nc-sa/2.0/uk/). The resource, where specified below, contains other 3rd party materials under their own licenses.The licenses and attributions are outlined below: 1. The name of the University of Plymouth and its logos are unregistered trade marks of the University. The University reserves all rights to these items beyond their inclusion in these CC resources. 2. The JISC logo, the and the logo of the Higher Education Academy are licensed under the terms of the Creative Commons Attribution -non-commercial-No Derivative Works 2.0 UK England & Wales license. All reproductions must comply with the terms of that license. Author Laura Lake Institute University of Plymouth Title Numeracy & Quantitative Methods Numeracy for Professional Purposes Description Overview of data types Date Created May 2011 Educational Level Level 4 Keywords Variable, nominal, ordinal, interval, ratio, mutually exclusive, exhaustive, hierarchical order, dichotomies. Back page originally developed by the OER phase 1 C-Change project ©University of Plymouth, 2010, some rights reserved