Download as PDF, PPTX


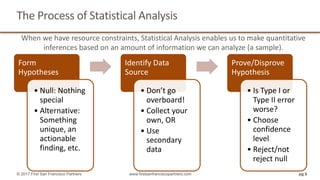
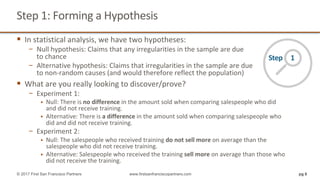


The document provides an overview of the statistical analysis process, including forming hypotheses, identifying sources of data, and proving or disproving hypotheses using descriptive, predictive, and prescriptive analytics. It highlights the importance of understanding different types of data analysis and their applications in decision-making. Additionally, it emphasizes the significance of planning and technical awareness in gaining meaningful insights from data.